
Figure 4.
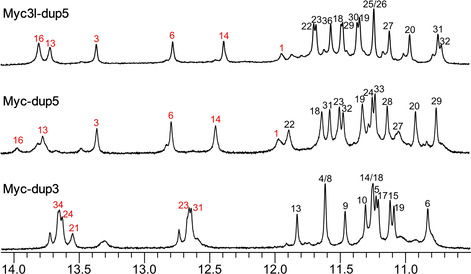
Imino proton spectral region of Myc‐dup3, Myc‐dup5, and Myc3l‐dup5; assigned resonances from the G‐core and Watson–Crick stem‐loop duplex are indicated by black and red numbers, respectively.
Official websites use .gov
A
.gov website belongs to an official
government organization in the United States.
Secure .gov websites use HTTPS
A lock (
) or https:// means you've safely
connected to the .gov website. Share sensitive
information only on official, secure websites.
Imino proton spectral region of Myc‐dup3, Myc‐dup5, and Myc3l‐dup5; assigned resonances from the G‐core and Watson–Crick stem‐loop duplex are indicated by black and red numbers, respectively.