

Abstract
Objective
This study was undertaken to analyze longitudinal changes of retinal thickness and their predictive value as biomarkers of disease progression in idiopathic Parkinson's disease (iPD).
Methods
Patients with Lewy body diseases were enrolled and prospectively evaluated at 3 years, including patients with iPD (n = 42), dementia with Lewy bodies (n = 4), E46K‐SNCA mutation carriers (n = 4), and controls (n = 17). All participants underwent Spectralis retinal optical coherence tomography and Montreal Cognitive Assessment, and Unified Parkinson's Disease Rating Scale score was obtained in patients. Macular ganglion cell–inner plexiform layer complex (GCIPL) and peripapillary retinal nerve fiber layer (pRNFL) thickness reduction rates were estimated with linear mixed models. Risk ratios were calculated to evaluate the association between baseline GCIPL and pRNFL thicknesses and the risk of subsequent cognitive and motor worsening, using clinically meaningful cutoffs.
Results
GCIPL thickness in the parafoveal region (1‐ to 3‐mm ring) presented the largest reduction rate. The annualized atrophy rate was 0.63μm in iPD patients and 0.23μm in controls (p < 0.0001). iPD patients with lower parafoveal GCIPL and pRNFL thickness at baseline presented an increased risk of cognitive decline at 3 years (relative risk [RR] = 3.49, 95% confidence interval [CI] = 1.10–11.1, p = 0.03 and RR = 3.28, 95% CI = 1.03–10.45, p = 0.045, respectively). We did not identify significant associations between retinal thickness and motor deterioration.
Interpretation
Our results provide evidence of the potential use of optical coherence tomography–measured parafoveal GCIPL thickness to monitor neurodegeneration and to predict the risk of cognitive worsening over time in iPD. ANN NEUROL 2021;89:165–176
Cognitive impairment is a common and highly disabling feature of Parkinson's disease (PD). At diagnosis, mild cognitive impairment can be detected in 15 to 40% of PD patients, and 10 years after disease onset dementia affects up to 70% of patients. 1 , 2 , 3 , 4 Some patients with aggressive phenotypes might suffer a more rapid cognitive deterioration and earlier instauration of dementia, but the lack of validated clinical biomarkers has made difficult the prediction of cognitive deterioration and the development of potential neuroprotective agents. 1 , 2 Such severe PD subtypes are believed to share clinical and pathologic commonalities with 2 other less common diffuse Lewy body diseases (LBDs): dementia with Lewy bodies (DLB) and PD associated with E46K mutation in the α‐synuclein gene (E46K‐SNCA). 3 Both entities are characterized by a rapidly progressive clinical deterioration with a marked cognitive impairment that precedes or coincides with the onset of parkinsonian motor signs. 4 , 5 PD patients demonstrate frequent abnormalities in visual functions, including low‐contrast visual acuity, contrast sensitivity, color and pattern discrimination, depth and movement perception, and several higher order visuospatial abilities. 6 , 7 , 8 , 9 , 10 , 11 , 12 , 13 , 14 , 15 , 16 Interestingly, visuospatial impairment, one of the earliest and most prominent clinical features of DLB and E46K‐SNCA patients, is a main predictor of global cognitive decline in PD patients. 17 Moreover, recent evidence supports that visual tests might predict PD dementia. 18 , 19
In line with this, the atrophy of macular ganglion cell–inner plexiform layer complex (GCIPL) measured with optical coherence tomography (OCT) has been shown to be a good marker of visual dysfunction in PD, 20 but the link between macular GCIPL thinning and overall cognitive impairment is poorly understood. Retinal neurodegeneration, neuronal loss, and anomalous α‐synuclein deposits within inner retinal layers are now well‐known pathological features of LBD patients. 21 Several cross‐sectional studies using OCT have demonstrated that, compared to age‐matched controls, PD patients have an atrophy of inner retina that seems to be associated with disease duration and motor disability. 22 More recent publications have shown that the thinning of macular GCIPL in PD is linked to cognitive impairment in de novo patients 23 and to the risk of dementia. 18 Interestingly, our group found that visual dysfunction in PD is selectively associated with the thinning of GCIPL in the 1‐ to 3‐mm diameter ring area around the fovea (parafoveal GCIPL), 20 an OCT feature that has also been identified in patients with idiopathic rapid eye movement sleep behavior disorder—the earliest (prodromal) phase of LBD. 24 So far, only few OCT studies have prospectively evaluated the progression of retinal thinning in PD patients, 25 , 26 , 27 and none has specifically looked at the rate of macular GCIPL atrophy and its relationship with disease worsening.
In this study, we aimed to evaluate longitudinally the dynamics of retinal atrophy and visual deterioration in PD and the ability of single‐timepoint OCT measures and visual tests to predict the risk of motor and cognitive decline. Furthermore, as a strategy to identify PD patients with worse prognosis, we jointly evaluated PD patients together with a cohort of controls, DLB patients, and E46K‐SNCA carriers.
Subjects and Methods
Study Design and Participants
We enrolled 62 patients with LBDs in a 3‐year prospective longitudinal study, including patients with idiopathic PD (iPD; n = 50), DLB patients (n = 8), E46K‐SNCA carriers (n = 4), and 29 controls. A total of 50 LBD patients (n = 42 iPD, n = 4 DLB, n = 4 E46K‐SNCA) and 17 controls successfully completed year 3 of follow‐up assessments. Twelve patients (19%) and 12 controls (41%) were lost to follow‐up; 4 DLB and 2 iPD subjects had severe motor and cognitive worsening related to LBD, 2 iPD subjects had hemorrhagic stroke, 1 iPD subject died of pneumonia, 2 iPD subjects developed ophthalmological exclusion conditions, and 1 iPD subject and 12 controls missed scheduled appointments by 12 months or more. Study participants consisted of a selected cohort of patients and controls recruited between 2015 and 2018 in the Department of Neurology at Cruces University Hospital and in the Biscay PD Association. Patients with iPD fulfilled Parkinson's UK Brain Bank criteria for the diagnosis of PD, and patients with DLB had a diagnosis of probable DLB according to the 2017 Fourth Consensus Report of the DLB Consortium. All patients were studied in an on‐medication condition to complete all study assessments. Before study inclusion and at year 3 follow‐up, all subjects underwent a restrictive screening protocol to exclude participants with relevant confounding factors potentially influencing clinical outcomes or retinal OCT measures. The screening protocol consisted of a comprehensive questionnaire on comorbidities, an ophthalmological examination, and structural brain neuroimaging with 3T magnetic resonance imaging. We excluded any subject with history of severe smoking (>20 cigarettes/day) or heavy alcohol use (>4 drinks/day for men or >3 drinks/day for women), diagnosis of any type or grade of diabetes, uncontrolled or resistant elevated blood pressure, obesity (body mass index > 30), history of consumption of drugs or medications known to induce retinal toxicity or cognitive impairment, chronic inflammatory systemic diseases (eg, lupus erythematosus, sarcoid, Behçet's disease), carotid or cerebral artery disease, moderate to severe deep white matter cerebral small vessel disease (Fazekas grade 2 or higher), or history of brain trauma or other structural brain lesions or central nervous system diseases other than PD. Patients with well‐controlled high blood pressure (hypertension) without complications were included in the study. We also excluded candidates with spherical equivalent refractive error > 4.00 diopters, >3.00 diopters of astigmatism, or any other ocular condition potentially affecting OCT measures, as detailed in OSCAR‐IB criteria. 28 Lastly, to establish reference values for age‐related changes in macular OCT measurements, we used a dataset of OCT images from 250 healthy volunteers. The study protocol was approved by the regional Basque Clinical Research Ethics Committee. All participants gave written informed consent prior to their participation in the study, in accordance with the tenets of the Declaration of Helsinki.
Demographical Features and PD‐Related Variables
Age at baseline and sex were recorded for all participants. Two neurologists experienced in the field of movement disorders recorded disease duration, Hoehn & Yahr scale score, Unified Parkinson's Disease Rating Scale Part III (motor examination) score (UPDRS III), and L‐dopa equivalent daily dose (LEDD).
Cognitive and Visual Outcomes Assessment
General cognition was evaluated with the Montreal Cognitive Assessment (MoCA). 29 , 30 PD patients with severe cognitive deterioration at baseline visit (MoCA < 14) were excluded from the study. All visual function outcomes were obtained binocularly with best‐corrected refraction. We registered high‐contrast visual acuity and low‐contrast visual acuity as the total number of letters correctly identified in, respectively, standard Early Treatment Diabetic Retinopathy Study (ETDRS) charts and Sloan 2.5% charts (Precision Vision, La Salle, IL) mounted in a retroilluminated cabinet at 4m. Contrast sensitivity was measured with a Pelli‐Robson chart at 1m under photopic conditions (280 lux), and the lowest contrast at which 2 letters in a triplet were correctly identified was recorded. In addition, we performed a detailed evaluation of visual cognition with tests including the number of correct answers on the Salthouse Perceptual Comparison Test, Symbol Digit Modalities Test, Picture Completion subtest of the Wechsler Adult Intelligence Scale IV, Benton Judgement of Line Orientation Test (H‐form at baseline, V‐form at follow‐up), Number Location and Cube Analysis tests of the Visual Object and Space Perception battery, inverse of the time to complete Trail Making Test part A, and the score on the Clock Drawing Test (Rouleau scoring method).
OCT Acquisition, Segmentation, and Processing
Macular and peripapillary OCT images were acquired for each eye using Spectralis spectral‐domain OCT (SD‐OCT; Heidelberg Engineering, Heidelberg, Germany), and thickness measures were calculated for peripapillary retinal nerve fiber layer (pRNFL) and for different combinations of layers and regions of the macula, as previously described 20 . Briefly, macular scans consisted of 25 single horizontal axial scans covering a 20° × 20° area (512 A‐scans per B‐scan and 49 frames per B‐scan). Peripapillary scans consisted of a 12° diameter ring scan manually centered on the optic nerve head (768 A‐scans per B‐scan, 100 frames per B‐scan). All OCT images fulfilled OSCAR‐IB quality control criteria. 28 Baseline OCT images were selected as reference with the Follow‐up tool, which ensured identical positioning and scanning parameters at follow‐up examinations.
Statistical Analysis
Statistical analysis was done in R (v3.6.1) and RStudio (v1.2.1335). Group characteristics were compared using Fisher's exact test for categorical variables and Kruskal–Wallis test for quantitative variables. For describing longitudinal progression of OCT measurements, visual function, and cognitive and motor parameters, multivariate linear mixed‐effects regression models (LMMs; lme4 package 31 ) were used. Probability values were obtained with the lmerTest package. Age and sex were used as fixed effects and a random intercept for subjects, separately in iPD patients and controls. To test for differences in retinal and clinical variables between iPD patients and controls, an interaction term between time and group was introduced. In patients, LMM was further adjusted for the following confounding variables: disease duration at study inclusion, UPDRS III score, LEDD, and diagnosis of hypertension. Loss to follow‐up in patients was assumed not to be random, because it was probably associated with study outcomes. Accordingly, to reduce estimate bias we also adjusted the LMM for the pattern of missing data (0 = observation at 2 timepoints; 1 = observation at baseline and missing data at follow‐up).
For predicting clinical outcome worsening from OCT‐derived and visual parameters, we first fitted linear models. Restricted cubic splines analysis with 5 knots revealed a nonlinear relationship between baseline retinal variables and disease‐related changes, which led us to calculate relative risks (RRs). For the latter, outcomes were categorized as follows. We used a 5‐point change in UPDRS III score as the clinically relevant change to consider motor worsening. 32 , 33 The score of MoCA was considered to have declined if there was a reduction of 4 points or more, based on the upper limit of the lowest quartile of MoCA score changes across 2 timepoints in LBD patients. Predictor categorization was based on baseline measurements; we averaged baseline z scores of low‐contrast visual acuity and visual cognition tests in LBD patients for classifying iPD patients into 2 groups using K‐means clustering, 20 and including DLB and E46K‐SNCA within the classification as models. Also, iPD patients were categorized into retinal thickness tertiles. The tertile cutoffs were selected using as reference retinal thickness distribution of 250 controls aged 40 to 83 years. iPD patients below the 25th percentile were assigned to the lowest thickness tertile (for parafoveal GCIPL: 72.1–89.7μm, for pRNFL: 83–92.5μm), patients in the interquartile range were categorized as the intermediate tertile (parafoveal GCIPL: 89.7–98.9μm, pRNFL: 92.5–107μm), and individuals above the 75th percentile were allocated to the highest tertile (parafoveal GCIPL: 98.9–116μm, pRNFL: 107–125μm). RRs were adjusted for baseline age, disease duration, sex, and LEDD with robust Poisson regression models. Logistic regression was used to test whether any baseline clinical variable was associated with motor or cognitive worsening.
Results
Demographics and Clinical Features of Study Population at Baseline
The demographics and clinical characteristics of study participants are detailed in Table 1. Briefly, DLB patients were significantly older (Bonferroni‐corrected p < 0.05). Mean UPDRS III score was 27.6 in iPD, 10 points less than in DLB. Cognitive impairment was more severe for E46K‐SNCA and DLB than for iPD, and MoCA score was significantly lower in iPD than in controls (Bonferroni‐corrected p = 0.02). At study inclusion, 28.5% of iPD patients, 25% of E46K‐SNCA patients, and 62.5% of DLB patients had well‐controlled hypertension and the majority of iPD participants (83.7%) were akinetic‐rigid subtype.
TABLE 1.
Baseline Demographics and Clinical Characteristics
| Characteristic | Control | iPD | E46K‐SNCA | DLB |
|---|---|---|---|---|
| n | 29 | 50 | 4 | 8 |
| Demographics | ||||
| Age, yr | 59.8 (7.1) | 60.6 (8.3) | 57.6 (5.3) | 73.9 (7.3) |
| Sex, % female | 58.6 | 36.7 | 50 | 25 |
| PD‐related features | ||||
| Disease duration, yr | NA | 6.5 (4.0) | 8.8 (5.1) | 8.0 (5.8) |
| Age at disease onset | NA | 54.0 (7.8) | 48.8 (6.6) | 66.0 (9.6) |
| HY score, median (IQR) | NA | 2 (2–2.5) | 2.5 (1.9–2.6) | 2.5 (2.5–3) |
| UPDRS III score | NA | 27.6 (11.1) | 28.3 (20.3) | 37.1 (13.7) |
| LEDD | NA | 677.5 (399.1) | 800.4 (701.6) | 514.1 (329.7) |
| Cognitive status | ||||
| MoCA score | 26.6 (3.3) | 24.3 (3.2) | 19.0 (7.0) | 17.6 (7.5) |
| Visual outcomes | ||||
| High‐contrast VA, correct letters, n | 61.6 (4.2) | 58.8 (5.7) | 52.8 (3.6) | 48.4 (12.1) |
| Low‐contrast VA, correct letters, n | 38.0 (6.2) | 27.5 (12.0) | 11.5 (13.9) | 15.4 (11.6) |
| Contrast sensitivity, logCS | 2.0 (0.1) | 1.9 (0.1) | 1.8 (0.1) | 1.8 (0.2) |
| Trail Making Test part A, s | 45.0 (17.7) | 53.9 (23.2) | 77.7 (21.4) | 77.7 (19.4) |
| Symbol Digit Modality Test | 46.6 (10.9) | 34.2 (14.3) | 20.0 (15.6) | 17.0 (7.0) |
| Salthouse Perceptual Comparison Test | 25.6 (7.8) | 23.3 (9.3) | 11.0 (9.0) | 9.6 (4.8) |
| Benton Judgement Line Orientation | 23.9 (3.9) | 20.3 (5.9) | 16.0 (10.4) | 18.3 (2.5) |
| WAIS IV, Picture Completion | 11.5 (3.8) | 8.8 (4.2) | 5.8 (3.6) | 6.0 (3.5) |
| VOSP, Number Location | 9.0 (1.8) | 8.3 (2.0) | 7.3 (2.2) | 8.0 (0.9) |
| VOSP, Cube Analysis | 9.7 (0.7) | 8.7 (2.0) | 5.3 (3.3) | 7.0 (3.9) |
| Clock Drawing Test | 9.1 (1.3) | 7.8 (2.0) | 3.8 (2.9) | 7.0 (2.5) |
Results are displayed as mean (standard deviation), except for sex and HY score, which are shown as indicated.
DLB = patients with dementia with Lewy bodies; E46K‐SNCA = E46K mutation carriers of α‐synuclein gene; HY = Hoehn & Yahr scale; iPD = idiopathic Parkinson disease; IQR = interquartile range; LEDD = L‐dopa equivalent daily dose; MoCA = Montreal Cognitive Assessment; PD = Parkinson disease; UPDRS III = motor part of Unified Parkinson's Disease Rating Scale; VA = visual acuity; VOSP = Visual Object and Space Perception battery; WAIS IV = Wechsler Adult Intelligence Scale, 4th edition.
Visual outcomes at baseline were worse in iPD patients compared to controls (Fig 1A), and overall, visual impairment was more severe in E46K‐SNCA and DLB patients (see Table 1). According to baseline visual outcomes, iPD patients were phenotypically classified into 2 groups using K‐means clustering. The first group, the “moderate to severe visual dysfunction” group, included 16 iPD patients (32%), 7 DLB patients, and 3 symptomatic E46K‐SNCA carriers, whereas the second group, the “mild visual dysfunction” group, included 34 iPD patients (68%), 1 DLB patient, and 1 asymptomatic E46K‐SNCA mutation carrier.
FIGURE 1.
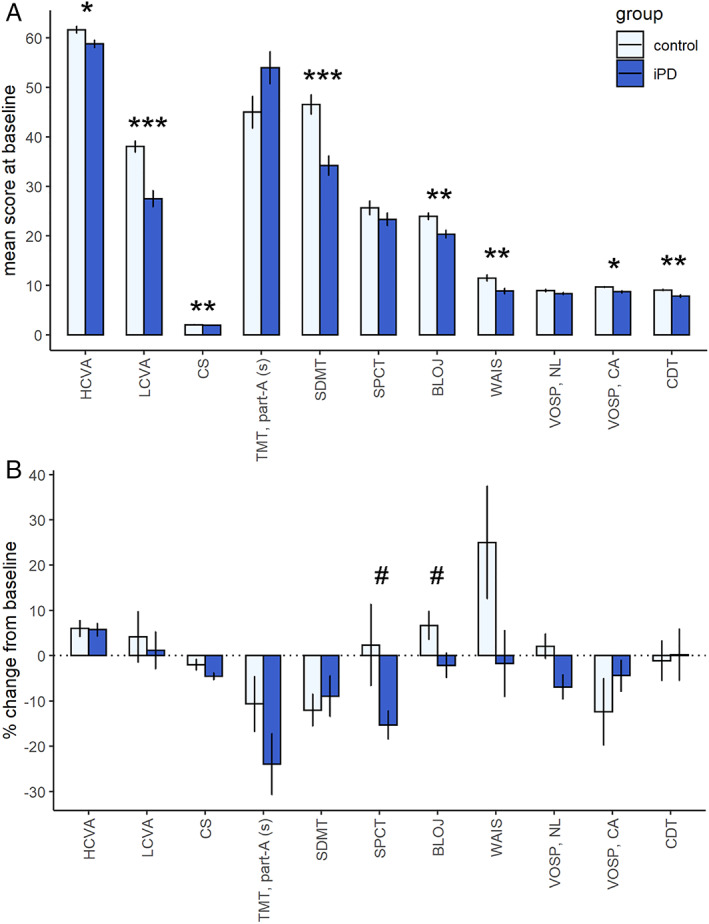
Visual outcomes. (A) Differences in baseline visual outcomes between controls and idiopathic Parkinson disease (iPD) patients. Significant differences are indicated with asterisks (Wilcoxon rank sum test, *p < 0.05, **p < 0.01, ***p < 0.001). (B) Longitudinal changes in visual outcomes. Relative changes (percentage) of visual outcomes were calculated as ([follow‐up visual score – baseline visual score] / baseline visual score) × 100. #p < 0.05 for the interaction term between group and time in linear mixed models. Note that the results of n = 50 iPD patients and n = 29 controls are represented in A and the results of n = 42 iPD patients and n = 17 controls in B. BLOJ = Benton Line Orientation Judgment; CA = cube analysis subitem; CDT = Clock Drawing Test, reproduction, corrected with Rouleau method; CS = contrast sensitivity; HCVA = high‐contrast visual acuity (number of correct letters); LCVA = low‐contrast visual acuity (number of correct letters); NL = number location subitem; SDMT = Symbol Digit Modality Test; SPCT = Salthouse Perceptual Comparison Test; TMT, part‐A (s) = time to complete Trail Making Test, part A, in seconds; VOSP = Visual Object and Space Perception battery; WAIS = figure completion part of Wechsler Adult Intelligence Scale IV. [Color figure can be viewed at www.annalsofneurology.org]
OCT measures at study inclusion showed that, in the central 3mm of the macula, GCIPL was significantly thinner in DLB compared to iPD and controls, and inner nuclear layer (INL) thickness was significantly lower in E46K‐SNCA carriers than in iPD. The difference was largest in the parafoveal area (GCIPL: DLB vs iPD, −9.6μm; DLB vs control, −10.7μm; INL: E46K‐SNCA vs iPD, −4.25μm; E46K‐SNCA vs controls, −3.27μm). Bonferroni‐corrected pairwise comparisons were nonsignificant for the remaining thickness parameters of the macula and pRNFL.
At baseline, parafoveal thickness of GCIPL and INL in iPD were significantly correlated with MoCA score and UPDRS III score (Fig 2A), correlation coefficients being slightly higher for GCIPL than for INL. Cognitive and motor scores were not correlated in iPD patients, although the relationship was significant when akinetic‐rigid iPD subtype was separately analyzed (r = −0.36, p = 0.021).
FIGURE 2.
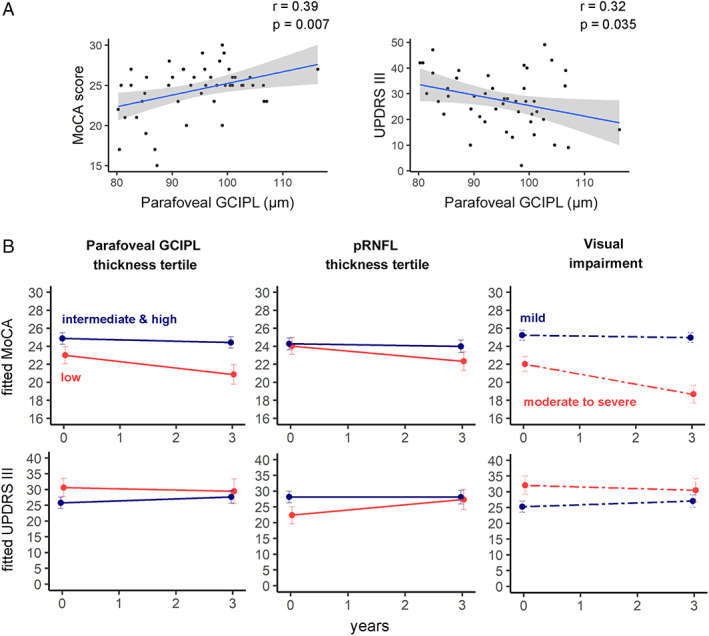
(A) Scatterplots represent the relationship between ganglion cell–inner plexiform layer complex (GCIPL) thickness in the parafoveal area (1‐ to 3mm) and Montreal Cognitive Assessment (MoCA) and Unified Parkinson Disease Rating Scale Part III (motor examination; UPDRS III) scores at baseline. (B) Progression of cognitive and motor manifestations. Parameter estimates from linear mixed‐effect models were converted to and plotted as condition means and standard error. Idiopathic Parkinson disease (iPD) patients were divided into subgroups according to baseline thickness in the parafoveal area (1‐ to 3mm ring) of GCIPL in the macula, baseline peripapillary retinal nerve fiber layer (pRNFL) thickness, and baseline visual outcomes. Retinal thicknesses of iPD patients were divided into tertiles according to the reference population, and visual impairment was determined using K‐means clustering (see Subjects and Methods). Eleven iPD patients from the lowest retinal thickness tertile and 31 iPD patients from the intermediate and highest tertiles completed a follow‐up visit. Thirty‐one patients who were classified as mild visual dysfunction and 11 classified as moderate to severe visual dysfunction completed the 3‐year visit. r = Pearson correlation coefficient. [Color figure can be viewed at www.annalsofneurology.org]
Progression of Motor, Cognitive, and Visual Impairment after 3 Years of Follow‐up
From the 50 LBD patients who completed follow‐up visit, 17 patients (34%; 14 iPD, 1 DLB, and 2 E46K‐SNCA) suffered a clinically relevant motor progression (Δ UPDRS III ≥ 5 points). Motor worsening was not associated with any baseline clinical variable, except for baseline UPDRS III score (odds ratio = 0.897, p = 0.016), whereby per 1‐unit increase in the initial UPDRS III score the odds of having an increase of 5 points or more in UPDRS III at 3 years decreased by a factor of 0.90.
Regarding the progression of cognitive disability, iPD patients showed a significant decrease in the mean MoCA score (from 24.8 to 23.3; LMM, p = 0.01), whereas in controls it slightly increased from 26.8 to 27.6 (LMM, p = 0.360). The decrease in the MoCA score was more pronounced for E46K‐SNCA (from 19.0 to 15.5) and DLB (from 24.0 to 16.0) than for iPD. At follow‐up, 8 iPD (19%), 4 DLB (100%), and 1 E46K‐SNCA subject (25%) presented a worsening of 4 points or more on MoCA. Interestingly, cognitive worsening was not associated with initial MoCA score or any other demographic or disease‐related clinical variable.
Although primary visual functions were clearly affected at baseline in iPD patients as compared to controls, the dynamics of the relative changes were similar, and we found only small differences over time (see Fig 1B). Clinically significant worsening of high‐contrast visual acuity (loss of 5 or more letters, corresponding to 1 logMAR line of ETDRS chart) was observed in 2.5% of iPD patients, with no significant differences when compared to controls. The decrease in low‐contrast visual acuity of 5 letters or more was present in a higher percentage of participants, but in a similar proportion between of iPD patients (20%) and controls (29.4%, p = 0.67), and differences in annualized changes were not statistically significant (LMM, group × time, p = 0.781). Intriguingly, the rate of low‐contrast visual acuity deterioration was more prominent in the E46K‐SNCA and DLB groups (% change, −37.4 and −20.5, respectively) than in iPD patients or controls. In iPD patients, median contrast sensitivity decreased from 1.90 to 1.77 logCS at follow‐up (LMM, p < 0.001), whereas in controls the median of 2.10 logCS did not change, although the difference in the rate of contrast sensitivity change was not statistically significant (LMM, group × time, p = 0.06). Regarding visual cognition tests, we failed to find within‐group significant changes at follow‐up, except for Symbol Digit Modality Test in controls (annualized estimate, −1.5; p = 0.014). However, we found a significant interaction effect of time and group for Benton Line Orientation Judgement (LMM, p = 0.04), and Salthouse Perceptual Comparison Test (LMM, p = 0.03; see Fig 1B).
Increased Rate of GCIPL and pRNFL Thinning in iPD Patients
Using LMM analysis adjusted for age at baseline and sex, we detected a distinct rate of macular GCIPL atrophy between iPD patients and controls (Fig 3). In the control group, the annualized estimates of GCIPL thickness were −0.33μm in the 6mm disc, −0.19μm in the central 3mm disc, and +0.07μm in the central 1mm disc. Additionally, when the annualized GCIPL estimates were calculated in controls for rings around the fovea, a decrease of −0.23μm was found in the 1‐ to 3mm (parafoveal) ring and −0.37μm in the 3‐ to 6mm perifoveal ring (Table 2). In iPD patients, the annual rate of atrophy was largest in the parafoveal ring (−0.67μm), which was 2 times greater than in controls and statistically significant (LMM, group × time, p = 0.007). Similarly, the overall thickness loss in 3mm disc (−0.63μm) was also significant and significantly higher than in controls (LMM, group × time, p = 0.005), as well as within the central 1mm disc (−0.24μm; LMM, group × time, p = 0.045). However, the rate of thinning in the 6mm disc (−0.51μm) and 3‐ to 6mm perifoveal ring (−0.47μm) was not significantly different in iPD patients compared to controls. These estimates slightly increased after adjusting for age and disease duration at baseline, sex, UPDRS III score, LEDD, hypertension, and missing data pattern (see Table 2). When other macular layers were evaluated using LMM, we only observed statistically significant changes for outer plexiform–Henle fiber–outer nuclear layer complex in iPD patients, with a thinning ranging from −0.39 to −0.25μm, but this thinning rate was not statistically different from that observed in controls. The average pRNFL thickness also decreased significantly over time in iPD patients (−0.55μm/yr, p < 0.001) but not in controls (−0.15μm/yr, p = 0.192; LMM, group × time, p = 0.015; see Table 2).
FIGURE 3.
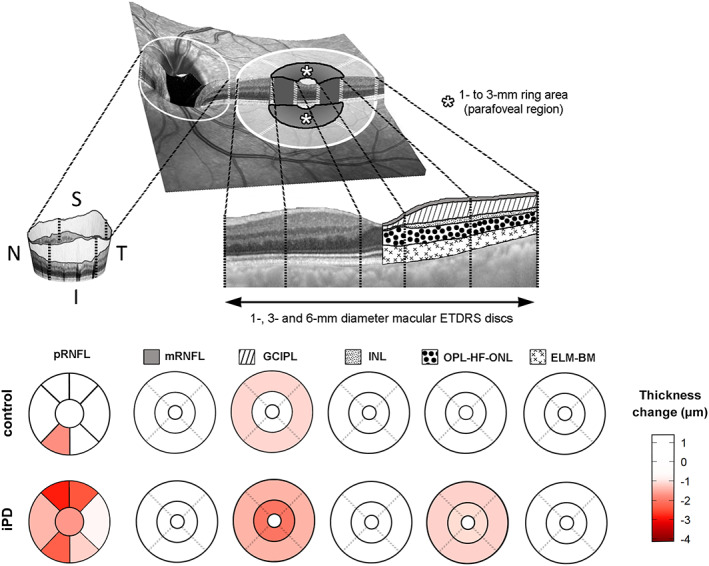
Progression of retinal atrophy in peripapillary peripapillary retinal nerve fiber layer (pRNFL), and in 5 layer complexes of the macula divided in 1mm, 1‐ to 3mm, and 3‐ to 6mm areas. The 1‐ to 3mm area corresponds to the parafoveal area of the macula. Estimated changes of macular and peripapillary thickness between baseline and year 3 follow‐up, adjusted for age and sex, are displayed, and negative values represent retinal thinning over time. ELM‐BM = retinal complex including external limiting membrane, ellipsoid band, retinal pigment epithelium, and Bruch membrane; ETDRS = Early Treatment Diabetic Retinopathy Study; GCIPL = ganglion cell–inner plexiform layer complex; I = inferior; INL = inner nuclear layer of the retina; iPD = idiopathic Parkinson disease; mRNFL, macular retinal nerve fiber layer; N = nasal; OPL‐HF‐ONL = outer plexiform–Henle fiber–outer nuclear layer complex; S = superior; T = temporal. [Color figure can be viewed at www.annalsofneurology.org]
TABLE 2.
Linear Mixed‐Model Effects Estimate of Annualized Atrophy of GCIPL and pRNFL
| Model | iPD | Control | iPD vs Control, p b | ||||
|---|---|---|---|---|---|---|---|
| Estimate | SE | p a | Estimate | SE | p a | ||
| Model 1 | |||||||
| y ij = { | |||||||
| GCIPL 1–3mm | −0.67 | 0.09 | <0.001 | −0.23 | 0.10 | 0.035 | 0.007 |
| GCIPL 3–6mm | −0.47 | 0.06 | <0.001 | −0.37 | 0.12 | 0.006 | 0.443 |
| GCIPL 1mm | −0.24 | 0.08 | 0.008 | 0.07 | 0.12 | 0.532 | 0.045 |
| GCIPL 3mm | −0.63 | 0.09 | <0.001 | −0.19 | 0.10 | 0.063 | 0.005 |
| GCIPL 6mm | −0.51 | 0.06 | <0.001 | −0.33 | 0.10 | 0.005 | 0.125 |
| pRNFL | −0.55 | 0.10 | <0.001 | −0.15 | 0.11 | 0.197 | 0.014 |
| } | |||||||
| Model 2 | |||||||
| y ij = { | |||||||
| GCIPL 1–3mm | −0.76 | 0.10 | <0.0001 | ||||
| GCIPL 3–6mm | −0.52 | 0.07 | <0.0001 | ||||
| GCIPL 1mm | −0.32 | 0.09 | 0.001 | ||||
| GCIPL 3mm | −0.71 | 0.09 | <0.0001 | ||||
| GCIPL 6mm | −0.56 | 0.06 | <0.0001 | ||||
| pRNFL | −0.64 | 0.10 | <0.0001 | ||||
| } | |||||||
Six independent LMMs were fitted within each model. In model 1, the retinal variable y ij for subject i and j‐th timepoint was introduced as the outcome variable, and years to follow‐up, age, and sex as fixed effects, in addition to a random intercept for subjects, therefore represented by y ij = β 0 + β 1 years to follow − up ij + β 2 age ij + β 3 sex ij + b 0i + ɛ ij . In model 2, the same retinal variables as in model 1 were modeled using as fixed effects years to follow‐up, age, sex, baseline disease duration, UPDRS III score, LEDD, hypertension, and a random intercept for subjects, therefore expressed by y ij = β 0 + β 1 years to follow − up ij + β 2 age ij + β 3 sex ij + β 4 disease duration ij + β 5 UPDRS III ij + β 6 LEDD + + β 7 hypertension + β 8 lost to follow − up + b 0i + ɛ ij . For both models, we assume that b 0i and ɛ ij are Gaussian distributed random variables following respectively and . Model 2 is only applicable to patients.
Probability values represent the significance of within‐group progression of retinal thinning.
Probability values of the interaction term between years to follow‐up and group in LMM.
GCIPL = ganglion cell–inner plexiform layer complex; iPD = idiopathic Parkinson disease; LEDD = L‐dopa equivalent daily dose; LMM = linear mixed‐effects regression model; pRNFL = peripapillary nerve fiber layer; SE = standard error; UPDRS III = Unified Parkinson Disease Rating Scale Part III (motor examination).
Prediction of Disease Worsening from Retinal OCT and Visual Function Parameters
Our results showed that iPD patients in the lowest parafoveal GCIPL thickness tertile at baseline had increased adjusted RR of cognitive worsening compared with those in higher tertiles (RR = 3.49, 95% confidence interval [CI] = 1.10–11.11, p = 0.03). On the other hand, the risk of motor worsening of iPD patients based on baseline parafoveal GCIPL thickness was not significant (RR = 0.63, 95% CI = 0.57–6.18, p = 0.566). Similarly, the RR of cognitive decline between patients in the lowest pRNFL tertile compared to patients in the intermediate and highest pRNFL tertiles was significant (RR = 3.28, 95% CI = 1.03–10.45, p = 0.045), but not for motor deterioration (RR = 1.91, 95% CI = 0.75–4.90, p = 0.193). When patients were classified according to their visual outcomes at baseline, the risk of general cognition worsening was almost 5 times greater for patients with visual dysfunction (RR = 4.69, 95% CI = 1.34–16.5, p = 0.01), even after adjusting for confounders (RR = 4.79, 95% CI = 0.91–21.18, p = 0.06). Conversely, the risk of motor deterioration was not different for patients with and without initial visual impairment (adjusted RR = 1.15, 95% CI = 0.36–3.61, p = 0.242).
Discussion
To the best of our knowledge, this is the first prospective longitudinal study to investigate the rate of GCIPL and pRNFL thinning over time in iPD patients using SD‐OCT, and the first to show that GCIPL thickness measured by OCT at a single timepoint can be used as a marker of subsequent worsening of general cognition.
Age‐related reduction rate of GCIPL thickness in a healthy population has been measured in previous OCT studies, with estimated annual thinning up to 0.25μm in cross‐sectional studies and 0.19 to 0.32μm in longitudinal studies, 34 , 35 which is in line with the annual decrease of 0.33μm that we found for the control group in our study. However, the progression of disease‐related retinal thinning in iPD has not been extensively explored. Previous studies investigating longitudinal retinal changes in PD have only evaluated total macular volume or average pRNFL thickness. 25 , 26 , 27 In a prospective 5‐year follow‐up study, Satue et al 26 reported for the first time that macular thinning in PD patients was greater than in controls, finding the largest differences in inner nasal (−8.21μm), outer inferior (−7.85μm), and inner temporal (−6.87μm) macular sectors. These authors also reported that, compared to controls, pRNFL thickness reduction was significantly higher in temporal and superotemporal sectors (3–4μm thinning). Later, Ma et al 27 found in a study of 22 PD patients that macular thickness decreased 7μm and pRNFL 6μm after 2.5 years of follow‐up. A more recent study evaluating 19 early stage PD patients found a mean decrease in macular thickness of 7.4μm without significant changes in pRNFL thickness after an average follow‐up of 19 ± 8.5 months. 25 In our study, pRNFL thickness reduction was almost 4 times greater in patients, with a comparable annual thinning rate to that found by Satue et al. 26 More importantly, according to our findings, the progression of GCIPL atrophy in the macula was 3 times greater in iPD patients than in controls. Unfortunately, the lack of longitudinal OCT studies evaluating GCIPL thinning over time in PD renders it difficult to compare our results.
Our findings revealed that iPD patients with lower initial GCIPL and pRNFL thicknesses presented an increased risk of cognitive decline at 3 years. Similarly, iPD patients with visual dysfunction at baseline had 4 times the risk of global cognition deterioration at follow‐up. Furthermore, in our study, GCIPL and pRNFL measurements were not associated with the progression of motor features. No significant differences were observed in terms of age, sex, LEDD, disease duration, and general cognition in patients with and without motor progression, but lower UPDRS III score at baseline was associated with motor progression. The pathophysiological explanation for the observed relationship between the progression of cognitive decline and retinal atrophy and the lack of association of the latter with the progression of motor symptoms is intriguing. First, it is important to bear in mind that visual stimuli are the main input for most of the standard neuropsychological tests and that the retina is the first processing station of visual information in the central nervous system. Basic computations for the analysis and interpretation of images, like edge detection, are accomplished in the retina, where immunohistological studies in PD have detected neuronal loss, synaptic and dendritic abnormalities, and deposits of phosphorylated α‐synuclein, especially in ganglion cells. 21 Although abnormalities in perception and processing of visual information in PD might be in part related to the injury of cortical and subcortical areas of the brain, 36 , 37 , 38 the involvement of the retina in visual cognition abnormalities of PD patients is firmly supported by several in vivo electrophysiological and OCT studies. 39 Our findings underpinning that visual dysfunction and macular GCIPL and pRNFL atrophy can independently predict the progression of cognitive disability in iPD are supported by the recent publication by Leyland et al. 18 Moreover, visual loss has an impact on physical activity, mental stimulation, and social interactions—factors reported to reduce the progression of cognitive impairment and the risk of dementia. 40 Therefore, all the aforementioned aspects may contribute to the effect of retinal injury and associated visual impairment on future risk of dementia, as observed in the elderly population. 41 , 42 Finally, our findings showing a lack of association between motor worsening and macular GCIPL atrophy may suggest different pathophysiological mechanisms underlying neurodegeneration of the retina and brain structures involved in motor manifestations. To date, only one neuroimaging study has evaluated in vivo the relation between retinal thickness and the integrity of brain regions involved in motor manifestations of PD, finding an association between inner retinal atrophy and lower dopamine transporter uptake in substantia nigra. 43 However, the majority of previous OCT studies in PD failed to demonstrate statistically significant results or yielded contradictory findings regarding the link between retinal atrophy and motor disability or disease duration. 22 Given that macular GCIPL atrophy has been reported in de novo PD patients 23 and in prodromal phases of LBD 24 and the lack of its correlation with disease duration or motor manifestations, it may suggest that retinal injury is an early phenomenon of iPD. Nonetheless, the mechanisms mediating the initiation and progression of retinal thinning in iPD are unknown. Ortuño‐Lizaran et al 44 identified phosphorylated α‐synuclein–reactive cells in the retina of 9 postmortem PD patients and 4 patients with incidental LBD. More recently, Shi et al 45 observed that retinal capillary complexity was decreased in the 2.5mm annular zone that approximately coincides with the parafoveal region in which we found the largest retinal atrophy. In line with this, Kwapong et al 46 found a correlation between the impairment in the microvasculature in that area and GCIPL thinning. However, the precise contribution of the microvasculature and α‐synuclein as a causal factor for inner retinal thinning remains challenging, and probably several nonidentified factors contribute. Regardless of the cause, our study showed that GCIPL thickness, mainly in the parafoveal region, and pRNFL thickness in iPD patients decreased at a faster rate than in the controls, and patients with lower baseline retinal measures were at higher risk of suffering cognitive decline.
Our study has some limitations. First, the CIs of the estimated risk of our analyses are wide, probably as the result of the sample size. Second, clinically significant changes for UPDRS III have been reported in the literature, and a 5‐point cutoff value is valid in clinical practice for patients with Hoehn & Yahr scores I to III, as in our sample. 32 , 33 However, the clinically significant change for MoCA score in iPD has not been stablished. We used a 4‐point cutoff value based on the distribution of MoCA changes in LBD patients, but this value may need to be confirmed in future studies. Another potential limitation is that we did not consider the influence of nondopaminergic medications in cognitive and visual function. Also, loss to follow‐up in patients was assumed not to be random, which might have biased the estimates of risk ratios. Therefore, our data should be interpreted with caution. Despite these limitations, this study had many strengths. Due to the prospective study design, we were able to observe changes in GCIPL and pRNFL thickness of iPD patients at 3 years. Moreover, mixed models were used for controlling for within‐patient correlations, and missing data pattern was introduced in the models, which is more robust for longitudinal data analysis than previously used statistical analyses. Finally, predictions of motor and cognitive impairment from baseline OCT measures have not been previously contemplated in iPD, and robust Poisson models were used to provide unbiased estimates of risk ratios.
In conclusion, this work represents the first prospective longitudinal OCT study investigating the rate of retinal thinning over time in iPD patients and its relationship with motor and cognitive outcomes. As the main findings, we showed that after 3 years of follow‐up the progression of macular GCIPL and pRNFL atrophy was 3 to 4 times greater in iPD patients than in controls and that retinal thickness measured by OCT at a single timepoint could be used as a potential marker of subsequent worsening of general cognition in iPD. Future studies with larger sample sizes and more follow‐up timepoints will be needed to validate the suitability of macular GCIPL and pRNFL thickness measurement with OCT for monitoring neurodegeneration and as an imaging biomarker of cognitive decline in iPD.
Author Contributions
A.M.‐G., J.C.G.‐E., J.P., N.I.‐B., N.O., and I.G. contributed to the conception and design of the study. A.M.‐G., R.D.P., M.G., B.A., M.A., M.C.‐A., T.F.‐V., B.T., and O.L.‐J. contributed to the acquisition of data. A.M.‐G., U.A., M.B., and J.C. contributed to data analysis. AM‐G and IG contributed to drafting the text and preparing the figures.
Potential Conflicts of Interest
Nothing to report.
Acknowledgments
This study was cofunded by the Michael J. Fox Foundation (RRIA [Rapid Response Innovation Awards] 2014 Program, grant ID: 10189), the Carlos III Health Institute, and the European Union (ERDF/ESF, “A Way to Make Europe”/“Investing in Your Future”) through the projects PI14/00679 and PI16/00005; the Juan Rodes grant JR15/00008 (I.G.); and the Department of Health of the Basque Government through the projects 2016111009 and 2020333033.
We thank all the patients and participants involved in the study.
References
- 1. Lanskey JH, McColgan P, Schrag AE, et al. Can neuroimaging predict dementia in Parkinson's disease? Brain 2018;141:2545–2560. [DOI] [PMC free article] [PubMed] [Google Scholar]
- 2. Espay AJ, Kalia LV, Gan‐Or Z, et al. Disease modification and biomarker development in Parkinson disease: revision or reconstruction? Neurology 2020;94:481–494. [DOI] [PMC free article] [PubMed] [Google Scholar]
- 3. Zarranz JJ, Alegre J, Gomez‐Esteban JC, et al. The new mutation, E46K, of alpha‐synuclein causes Parkinson and Lewy body dementia. Ann Neurol 2004;55:164–173. [DOI] [PubMed] [Google Scholar]
- 4. Hamilton JM, Salmon DP, Galasko D, et al. Visuospatial deficits predict rate of cognitive decline in autopsy‐verified dementia with Lewy bodies. Neuropsychology 2008;22:729–737. [DOI] [PMC free article] [PubMed] [Google Scholar]
- 5. Somme JH, Gomez‐Esteban JC, Molano A, et al. Initial neuropsychological impairments in patients with the E46K mutation of the alpha‐synuclein gene (PARK 1). J Neurol Sci 2011;310:86–89. [DOI] [PubMed] [Google Scholar]
- 6. Bodis‐Wollner I, Marx MS, Mitra S, et al. Visual dysfunction in Parkinson's disease. Loss in spatiotemporal contrast sensitivity. Brain 1987;110:1675–1698. [DOI] [PubMed] [Google Scholar]
- 7. Boller F, Passafiume D, Keefe NC, et al. Visuospatial impairment in Parkinson's disease. Role of perceptual and motor factors. Arch Neurol 1984;41:485–490. [DOI] [PubMed] [Google Scholar]
- 8. Crucian GP, Okun MS. Visual‐spatial ability in Parkinson's disease. Front Biosci 2003;8:s992–s997. [DOI] [PubMed] [Google Scholar]
- 9. Diederich NJ, Goetz CG, Raman R, et al. Poor visual discrimination and visual hallucinations in Parkinson's disease. Clin Neuropharmacol 1998;21:289–295. [PubMed] [Google Scholar]
- 10. Diederich NJ, Raman R, Leurgans S, Goetz CG. Progressive worsening of spatial and chromatic processing deficits in Parkinson disease. Arch Neurol 2002;59:1249–1252. [DOI] [PubMed] [Google Scholar]
- 11. Hutton JT, Morris JL, Elias JW, et al. Spatial contrast sensitivity is reduced in bilateral Parkinson's disease. Neurology 1991;41:1200–1202. [DOI] [PubMed] [Google Scholar]
- 12. Langheinrich T, Tebartz van Elst L, Lagreze WA, et al. Visual contrast response functions in Parkinson's disease: evidence from electroretinograms, visually evoked potentials and psychophysics. Clin Neurophysiol 2000;111:66–74. [DOI] [PubMed] [Google Scholar]
- 13. Lin TP, Rigby H, Adler JS, et al. Abnormal visual contrast acuity in Parkinson's disease. J Parkinson Dis 2015;5:125–130. [DOI] [PubMed] [Google Scholar]
- 14. Mestre D, Blin O, Serratrice G, Pailhous J. Spatiotemporal contrast sensitivity differs in normal aging and Parkinson's disease. Neurology 1990;40:1710–1714. [DOI] [PubMed] [Google Scholar]
- 15. Ming W, Palidis DJ, Spering M, McKeown MJ. Visual contrast sensitivity in early‐stage Parkinson's disease. Investig Ophthalmol Vis Sci 2016;57:5696–5704. [DOI] [PubMed] [Google Scholar]
- 16. Regan D, Neima D. Visual fatigue and visual evoked potentials in multiple sclerosis, glaucoma, ocular hypertension and Parkinson's disease. J Neurol Neurosurg Psychiatry 1984;47:673–678. [DOI] [PMC free article] [PubMed] [Google Scholar]
- 17. Williams‐Gray CH, Foltynie T, Brayne CE, et al. Evolution of cognitive dysfunction in an incident Parkinson's disease cohort. Brain 2007;130:1787–1798. [DOI] [PubMed] [Google Scholar]
- 18. Leyland LA, Bremner FD, Mahmood R, et al. Visual tests predict dementia risk in Parkinson disease. Neurol Clin Pract 2020;10:29–39. [DOI] [PMC free article] [PubMed] [Google Scholar]
- 19. Anang JB, Gagnon JF, Bertrand JA, et al. Predictors of dementia in Parkinson disease: a prospective cohort study. Neurology 2014;83:1253–1260. [DOI] [PMC free article] [PubMed] [Google Scholar]
- 20. Murueta‐Goyena A, Del Pino R, Reyero P, et al. Parafoveal thinning of inner retina is associated with visual dysfunction in Lewy body diseases. Mov Disord 2019;34:1315–1324. [DOI] [PMC free article] [PubMed] [Google Scholar]
- 21. Veys L, Vandenabeele M, Ortuno‐Lizaran I, et al. Retinal alpha‐synuclein deposits in Parkinson's disease patients and animal models. Acta Neuropathol 2019;137:379–395. [DOI] [PubMed] [Google Scholar]
- 22. Chrysou A, Jansonius NM, van Laar T. Retinal layers in Parkinson's disease: a meta‐analysis of spectral‐domain optical coherence tomography studies. Parkinsonism Relat Disord 2019;64:40–49. [DOI] [PubMed] [Google Scholar]
- 23. Sung MS, Choi SM, Kim J, et al. Inner retinal thinning as a biomarker for cognitive impairment in de novo Parkinson's disease. Sci Rep 2019;9:11832. [DOI] [PMC free article] [PubMed] [Google Scholar]
- 24. Lee JY, Ahn J, Oh S, et al. Retina thickness as a marker of neurodegeneration in prodromal lewy body disease. Mov Disord 2020;35:349–354. [DOI] [PubMed] [Google Scholar]
- 25. Hasanov S, Demirkilinc Biler E, Acarer A, et al. Functional and morphological assessment of ocular structures and follow‐up of patients with early‐stage Parkinson's disease. Int Ophthalmol 2019;39:1255–1262. [DOI] [PubMed] [Google Scholar]
- 26. Satue M, Rodrigo MJ, Obis J, et al. Evaluation of progressive visual dysfunction and retinal degeneration in patients with Parkinson's disease. Investig Ophthalmol Vis Sci 2017;58:1151–1157. [DOI] [PubMed] [Google Scholar]
- 27. Ma LJ, Xu LL, Mao CJ, et al. Progressive changes in the retinal structure of patients with Parkinson's disease. J Parkinsons Dis 2018;8:85–92. [DOI] [PubMed] [Google Scholar]
- 28. Tewarie P, Balk L, Costello F, et al. The OSCAR‐IB consensus criteria for retinal OCT quality assessment. PLoS One 2012;7:e34823. [DOI] [PMC free article] [PubMed] [Google Scholar]
- 29. Nasreddine ZS, Phillips NA, Bédirian V, et al. The Montreal Cognitive Assessment, MoCA: a brief screening tool for mild cognitive impairment. J Am Geriatr Soc 2005;53:695–699. [DOI] [PubMed] [Google Scholar]
- 30. Ojeda N, Del Pino R, Ibarretxe‐Bilbao N, et al. Montreal Cognitive Assessment test: normalization and standardization for Spanish population. Rev Neurol 2016;63:488–496. [PubMed] [Google Scholar]
- 31. Bates D, Mächler M, Bolker B, Walker S. Fitting linear mixed‐effects models using lme4. J Stat Softw 2015;67:48. [Google Scholar]
- 32. Schrag A, Sampaio C, Counsell N, Poewe W. Minimal clinically important change on the Unified Parkinson's Disease Rating Scale. Mov Disord 2006;21:1200–1207. [DOI] [PubMed] [Google Scholar]
- 33. Shulman LM, Gruber‐Baldini AL, Anderson KE, et al. The clinically important difference on the Unified Parkinson's Disease Rating Scale. Arch Neurol 2010;67:64–70. [DOI] [PubMed] [Google Scholar]
- 34. Leung CKS, Ye C, Weinreb RN, et al. Impact of age‐related change of retinal nerve fiber layer and macular thicknesses on evaluation of glaucoma progression. Ophthalmology 2013;120:2485–2492. [DOI] [PubMed] [Google Scholar]
- 35. Lee WH, Lee MW, Lim HB, et al. Longitudinal changes in the thickness of the ganglion cell‐inner plexiform layer in patients with hypertension: a 4‐year prospective observational study. Acta Ophthalmol 2020;98:e479–e486. [DOI] [PubMed] [Google Scholar]
- 36. Weil RS, Winston JS, Leyland LA, et al. Neural correlates of early cognitive dysfunction in Parkinson's disease. Ann Clin Transl Neurol 2019;6:902–912. [DOI] [PMC free article] [PubMed] [Google Scholar]
- 37. Moro E, Bellot E, Meoni S, et al. Visual dysfunction of the superior colliculus in de novo parkinsonian patients. Ann Neurol 2020;87:533–546. [DOI] [PubMed] [Google Scholar]
- 38. Goldman JG, Stebbins GT, Dinh V, et al. Visuoperceptive region atrophy independent of cognitive status in patients with Parkinson's disease with hallucinations. Brain 2014;137:849–859. [DOI] [PMC free article] [PubMed] [Google Scholar]
- 39. Weil RS, Schrag AE, Warren JD, et al. Visual dysfunction in Parkinson's disease. Brain 2016;139:2827–2843. [DOI] [PMC free article] [PubMed] [Google Scholar]
- 40. Ruthirakuhan M, Luedke AC, Tam A, et al. Use of physical and intellectual activities and socialization in the management of cognitive decline of aging and in dementia: a review. J Aging Res 2012;2012:384875. [DOI] [PMC free article] [PubMed] [Google Scholar]
- 41. Tran EM, Stefanick ML, Henderson VW, et al. Association of visual impairment with risk of incident dementia in a Women's Health Initiative population. JAMA Ophthalmol 2020;138:624–633. [DOI] [PMC free article] [PubMed] [Google Scholar]
- 42. Nael V, Peres K, Dartigues JF, et al. Vision loss and 12‐year risk of dementia in older adults: the 3C cohort study. Eur J Epidemiol 2019;34:141–152. [DOI] [PubMed] [Google Scholar]
- 43. Ahn J, Lee JY, Kim TW, et al. Retinal thinning associates with nigral dopaminergic loss in de novo Parkinson disease. Neurology 2018;91:e1003–e1012. [DOI] [PubMed] [Google Scholar]
- 44. Ortuño‐Lizaran I, Beach TG, Serrano GE, et al. Phosphorylated α‐synuclein in the retina is a biomarker of Parkinson's disease pathology severity. Mov Disord 2018;33:1315–1324. [DOI] [PMC free article] [PubMed] [Google Scholar]
- 45. Shi C, Chen Y, Kwapong WR, et al. Characterization by fractal dimension analysis of the retinal capillary network in Parkinson disease. Retina 2020;40:1483–1491. [DOI] [PubMed] [Google Scholar]
- 46. Kwapong WR, Ye H, Peng C, et al. Retinal microvascular impairment in the early stages of Parkinson's disease. Investig Ophthalmol Vis Sci 2018;59:4115–4122. [DOI] [PubMed] [Google Scholar]