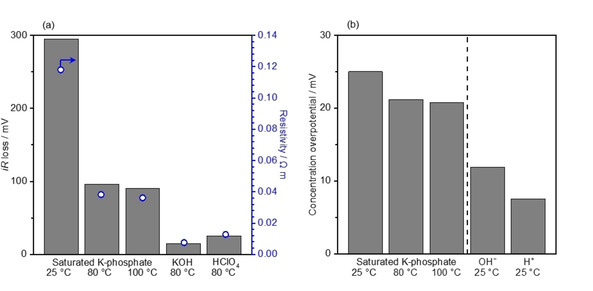
Figure 4.

Analysis of voltage losses due to the mass‐transport at 100 mA cm−2. (a) iR loss was obtained by multiplying the resistivity of the solution by the cell constants. The resistivity was accessed by impedance spectroscopy, which was conducted in the 2‐electrode system using two Pt wires while keeping the distance between Pt wires at 2.0 cm (cell constant, K cell=0.6 cm−1) in K‐phosphate (pH 7.0) of 2.6 mol kg−1 at 25 °C, 3.5 mol kg−1 at 80 °C and 4.1 mol kg−1 at 100 °C as well as 7.0 mol kg−1 HClO4 at 80 °C. The value of 7.1 mol kg−1 KOH was adopted from literature. [48] The cell constant at a distance of 0.5 mm between electrodes were extrapolated from the previously reported values, [61] which corresponded to 0.2 cm−1. The surface area of the electrode was 1.0 cm2. (b) Concentration overpotential, or Nernstian loss, was calculated in a condition of complete depletion of the reactant at the electrode surfaces. Conditions: current density =100 mA cm−2, the surface area of electrode=1.0 cm2, and diffusion layer thickness of=0.5 mm in K‐phosphate (pH 7.0) of 2.6 mol kg−1 at 25 °C, 3.5 mol kg−1 at 80 °C and 4.1 mol kg−1 at 100 °C, and in 1.0 mol kg−1 OH−1 and 1.0 mol kg−1 H+.
