

Abstract
Importance
A high prevalence of retinal abnormalities have been reported in congenital heart disease (CHD), but quantitative analysis of retinal vasculature is scarce. Optical coherence tomography angiography (OCTA) is a noninvasive method to quantitatively assess the retinal microvasculature.
Background
To investigate the retinal microvasculature changes in CHD patients by using OCTA.
Design
Cross‐sectional study.
Participants
A total of 158 participants including 57 cyanotic CHD (CCHD) patients, 60 acyanotic CHD (ACHD) patients and 41 control subjects were included.
Methods
All participants underwent a comprehensive ophthalmologic examination, including refraction measurement, intraocular pressure measurement and OCTA.
Main Outcome Measures
Vessel density (VD) was measured within the radial peripapillary capillary (RPC), superficial capillary plexus (SCP) and deep capillary plexus (DCP) of the macula.
Results
CCHD patients had significantly lower VD in the RPC, SCP and DCP (all P < .01) compared to control subjects, and significantly lower VD in the RPC and DCP (both P < .05) compared to ACHD patients. Besides, among the CHD group, VD in the RPC was positively correlated with oxygen saturation (whole image, ρ = 0.45; peripapillary, ρ = 0.48) and negatively correlated with haematocrit (whole image, ρ = 0.55; peripapillary, ρ = 0.55) (all P < .001).
Conclusions and Relevance
Retinal VD might be a surrogate to reflect the effect of chronic systemic hypoxemia in CHD patients. OCTA could be a convenient and noninvasive tool to evaluate the retinal structure and function in CHD patients.
Keywords: congenital heart disease, hypoxia, retinal vessel density, optical coherence tomography angiography
1. INTRODUCTION
Congenital heart disease (CHD) is the most common congenital defect, characterized by structural abnormalities of the heart or great vessels and affecting 0.82% of live newborns around the world. 1 Cyanotic CHD (CCHD) is one type of CHD and typically characterized by much severer hypoxia, higher mortality, and poorer quality of life. 2 , 3 The effect of chronic hypoxemia is associated with cardiovascular risks, 4 perioperative bleeding 5 and multisystem damages in the myocardial blood, 6 , 7 kidney function 8 and retinal microvasculature. 9
Retina is regarded as a window to the heart and can be non‐invasively visualized. 10 The morphologic manifestations of coronary arteries, such as dilatation and tortuosity, have also been observed with similar changes in the retinal vessels in CCHD patients. 11 , 12 , 13 A previous study also found the abnormal oxygen saturation in the retinal vessel could reflect the chronic systemic hypoxemia secondary to CCHD. 14 A possible link between the retina and the heart might exist. 10 , 15 , 16 We considered the assessment of retinal vessels might provide some insights into the effect of hypoxemia in CHD patients. The effects of chronic hypoxemia on retinal vascular morphology have been well documented previously, but the quantitative analysis of retinal vessel density (RVD) in CCHD is poorly explored. Optical coherence tomography angiography (OCTA) is a novel and noninvasive method used for the quantitative and qualitative assessment of retinal microcirculation status. 17 Therefore, we conducted this study to explore the RVD changes measured by OCTA in patients with CHD.
In this study, we aimed to evaluate the RVD changes in patients with CHD and to determine the association between retinal microvasculature and the severity of chronic hypoxia in CHD. We aimed to explore whether RVD could reflect the effect of chronic systemic hypoxemia and whether RVD could be a surrogate to reflect the microvasculature status in CHD patients.
2. METHODS
2.1. Study design and participants
In this cross‐sectional and comparative study, CHD patients were consecutively enrolled from June 2018 to September 2019 in the Department of Cardiovascular Surgery in Guangdong Provincial People's Hospital. CHD is defined as a range of cardiac abnormalities, which is presented before birth and attributable to abnormal foetal cardiac development without inherited disorders. 18 , 19 Patients with a definite diagnosis of CHD under echocardiography or cardiac catheterization were consecutively included before the cardiac surgery. Oxygen saturation (SaO2) was measured by pulse oximetry in the finger or toe after a minimum of 5 minutes rests in sitting position on admission. According to the value of SaO2, the CHD patients were classified into acyanotic group (ACHD, SaO2 > 90%) and cyanotic group (CCHD, SaO2 ≤ 90%). 18
A control group without ocular disease of any sort were also included. All participants were arranged to undergo a comprehensive ophthalmologic examination, including refraction measurement, best‐corrected visual acuity (BCVA) test, intraocular pressure (IOP) measurement using a non‐contact tonometer and OCTA.
Exclusion criteria included the following: (a) IOP > 21 mmHg; (b) a history of glaucoma, uveitis, coexisting retinal disease, ocular trauma or other fundus diseases; (c) a history of intraocular surgery; (d) media opacities preventing high‐quality imaging; (e) a history of any systemic congenital diseases, other than heart diseases.
This study protocol was explained in detail to all participants and written informed consent was obtained. This research adhered to the Declaration of Helsinki and was approved by the Research Ethics Committee of Guangdong Provincial People's Hospital.
2.2. Optical coherence tomographic angiography
The retinal images were captured with patients' pupil dilated in a dark room by using an OCTA instrument (Version 2017.1.0.151; RTVue‐XR Avanti; Optovue, Fremont, California). This instrument uses a light source centred on 840 nm and a bandwidth of 50 nm with an A‐scan rate of 70 000 scans per second. The system provides an axial resolution of 5 μm in tissue and the diameter of the beam spot at the retinal plane around 22 μm.
The high‐definition (HD) modes of optic disc (4.5 × 4.5 mm2) and macula (6 × 6 mm2) within the OCTA scans were employed. The parameter measured in the optic disc contained the VD of the radial peripapillary capillary (RPC). The parameter in the macula majorly contained the VD of the superficial capillary plexus (SCP), deep capillary plexus (DCP). Split‐spectrum amplitude decorrelation angiography (SSADA) software algorithm 20 was used for the evaluation of VD which was defined by the percentage area occupied by vessels. Furthermore, the system was equipped with three‐dimensional Projection Artefact Removal (3D PAR), which could reduce projection artefacts in the deeper layers while maintaining their authentic layout.
RPC is defined as the layer between the outer limit of the retinal nerve fibre layer (RNFL) and the internal limiting membrane (ILM). The software automatically fits a 2 mm diameter circle centred on the optic disc and the peripapillary region is defined as an area extending between the 2‐ and 4‐mm‐diameter elliptical contour lines around the optic disc boundary. Eight sectors were used to describe the peripapillary area, including nasal superior (NS), nasal inferior (NI), inferior nasal (IN), inferior temporal (IT), temporal inferior (TI), temporal superior (TS), superior temporal (ST) and superior nasal (SN). We also analysed the superior‐hemi and inferior‐hemi values in the study. Capillary density was measured with built‐in software that automatically removes larger vessels with diameter ≥33 μm.
In the macular region, SCP and DCP were automatically generated by the software. SCP is defined as the ILM to 10 μm above the inner plexiform layer (IPL). DCP is defined as 10 μm above the IPL to 10 μm below the outer plexiform layer (OPL). The VD of four areas (whole image, fovea, parafovea, perifovea) in the SCP and DCP were available for analyses. The foveal area of the macula refers to the inner circle with a diameter of 1 mm, the parafoveal area refers to the annular area between the concentric circles with a diameter of 1 and 3 mm, and the perifoveal area refers to the annular area between the concentric circles with a diameter of 3 and 6 mm.
Only images of good quality with a signal strength index (SSI) ≥ 50 were used for further quantitative analysis. If the initial image quality was poor, we repeated the scans until the scan quality of images could meet the requirement.
2.3. Statistical analysis
The demographic and clinical characteristics were compared among the three groups. Continuous variables were presented as mean ± SD or median (interquartile range, IQR). Data distribution was tested using the Shapiro‐Wilk test. One‐way analysis of variance (ANOVA) was used for continuous variables when the assumption of normality was met. Otherwise, Kruskal‐Wallis H test was used. Categorical variables were presented as numbers and percentages and compared with the χ2 test. One‐way ANOVA was used to compare the differences of RVD among control group, ACHD patients, and CCHD patients. Then pairwise comparisons among the three groups were done using the Bonferroni test. Spearman's correlation analyses were performed to investigate the relationships between RVD and related factors. Multivariable regression analysis was used to determine the driving factors associated with RVD.
Refraction values were converted to spherical equivalent (SE), calculated as spherical dioptric power plus one‐half of the cylindrical dioptric power. For each participant, only one eye with higher SQ was used for the analysis.
All data were analysed using SPSS software (IBM SPSS, Version 25.0, IBM Corporation, Armonk, New York). All P values were presented based on two‐tailed and P < .05 was considered statistically significant.
3. RESULTS
3.1. Study population
A total of 117 CHD patients (60 with ACHD and 57 with CCHD) and 41 control subjects were consecutively included in our study. The demographic and clinical characteristics were summarized in Table 1. The distribution of primary diagnoses of CHD was shown in Table 2. There were no significant differences among control, ACHD, and CCHD groups in age, sex, body mass index, blood pressure, SE, BCVA and IOP. Significant differences were found in the comparison of SaO2, haemoglobin (Hb) and haematocrit (HCT) among the three groups (all P < 0.001).
TABLE 1.
Demographic and clinical characteristics of three groups
| Control (n = 41) | ACHD (n = 60) | CCHD (n = 57) | P value | |
|---|---|---|---|---|
| Age (years) | 24 ± 6 | 25 ± 11 | 22 ± 11 | .083* |
| Male (%) | 13 (31.7) | 24 (40.0) | 30 (52.6) | .105** |
| Body mass index (kg/m2) | 19.87 ± 1.38 | 19.40 ± 3.62 | 18.04 ± 6.96 | .146* |
| Systolic BP (mmHg) | 109 ± 10 | 114 ± 13 | 111 ± 9 | .052* |
| Diastolic BP (mmHg) | 71 ± 9 | 72 ± 10 | 69 ± 10 | .340* |
| SE (diopters) | −1.92 ± 2.02 | −2.09 ± 2.49 | −2.34 ± 2.75 | .737* |
| BCVA, LogMAR | 0.01 ± 0.04 | 0.03 ± 0.14 | 0.04 ± 0.13 | .332* |
| IOP (mmHg) | 14.27 ± 2.74 | 14.83 ± 3.29 | 14.91 ± 2.72 | .539* |
| SaO2 (%) | NA | 98 (97‐100) | 83 (75‐86) | <.001*** |
| Hb (g/L) | 137 (127‐141) | 135 (125‐150) | 180 (164‐205) | <.001*** |
| HCT (L/L) | 0.41 (0.39‐0.42) | 0.40 (0.38‐0.43) | 0.53 (0.49‐0.61) | <.001*** |
Note: Quantitative variables are expressed as mean ± SD or median (interquartile range), and categorical variables are expressed as percentages of total.
Abbreviations: ACHD, acyanotic congenital heart disease; BCVA, best‐corrected visual acuity; BP, blood pressure; CCHD, cyanotic congenital heart disease; Hb, haemoglobin; HCT, haematocrit; IOP, intraocular pressure; LogMAR: logarithm of the minimum angle of resolution; NA, not available; SaO2, oxygen saturation; SE, spherical equivalent.
ANOVA, **χ2 test, *** Kruskal‐Wallis H test; P < .05 is considered statistically significant.
TABLE 2.
Distribution of primary diagnoses of CHD patients
| ACHD (n = 60) | CCHD (n = 57) | |
|---|---|---|
| Tetralogy of Fallot | 7 (11.7) | 12 (21.1) |
| Ebstein anomaly | 21 (35.0) | 1 (1.8) |
| Single ventricle | 0 | 15 (26.3) |
| Pulmonary atresia | 1 (1.7) | 9 (15.8) |
| Transposition of the great arteries | 0 | 7 (12.3) |
| Heart septal defects | 12 (20.0) | 6 (10.5) |
| Double‐outlet right ventricle | 1 (1.7) | 4 (7.0) |
| Anomalous pulmonary venous connection | 6 (11.3) | 1 (1.8) |
| Other | 12 (20.0) | 2 (3.5) |
Note: Values are expressed as percentages of total.
Abbreviations: ACHD, acyanotic congenital heart disease; CCHD, cyanotic congenital heart disease.
3.2. Intergroup differences of RVD among the three groups
In patients with CCHD, the impairment of retinal vasculature was more evident as a decrease in VD, especially in the RPC and DCP (Figure 1). Comparisons of the VD of different retinal layers were presented in Table 3. There were no significant differences in SSI of optic disk and macula among the three groups (both P > .05).
FIGURE 1.
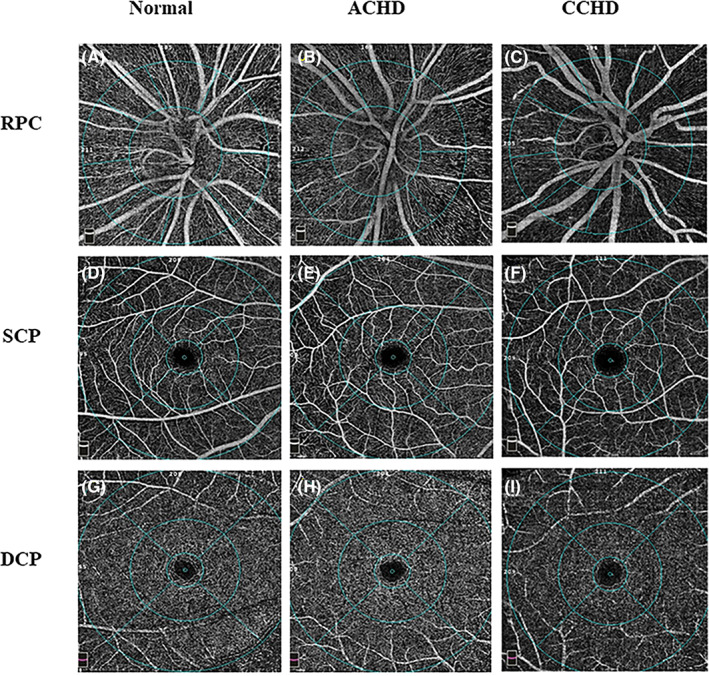
OCTA images of vessel density in three groups. RPC angiograms of 4.5 × 4.5 mm2 in, A, a normal eye, B, ACHD eye, C, CCHD eye. SCP angiogram of 6 × 6 mm2 in, D, a normal eye, E, ACHD eye, F, CCHD eye. DCP angiogram of 6 × 6 mm2 in,G, a normal eye, H, ACHD eye, I, CCHD eye. ACHD, acyanotic congenital heart disease; CCHD, cyanotic congenital heart disease; DCP, deep capillary plexus; OCTA, optical coherence tomographic angiography; RPC, radial peripapillary capillary; SCP, superficial capillary plexus
TABLE 3.
Retinal vessel density among the three groups
| Control (n = 41) | ACHD (n = 60) | CCHD (n = 57) | P value a | P value b | P value c | P value d | |
|---|---|---|---|---|---|---|---|
| SSI (optic disk scan) | 76.93 ± 7.04 | 76.80 ± 6.98 | 76.56 ± 7.49 | .966 | 1.000 | 1.000 | 1.000 |
| RPC density (%) | |||||||
| Mean | 56.22 ± 2.16 | 55.47 ± 2.63 | 52.90 ± 3.24 | <.001* | .552 | <.001* | <.001* |
| Peripapillary | 58.19 ± 2.43 | 56.90 ± 3.01 | 53.45 ± 3.99 | <.001* | .167 | <.001* | <.001* |
| Superior‐hemi | 58.78 ± 2.49 | 57.21 ± 3.08 | 53.93 ± 4.04 | <.001* | .066 | <.001* | <.001* |
| Inferior‐hemi | 57.53 ± 2.66 | 56.57 ± 3.14 | 52.94 ± 4.20 | <.001* | .513 | <.001* | <.001* |
| RPC capillary density (%) | |||||||
| Mean | 49.42 ± 1.91 | 48.41 ± 2.53 | 44.25 ± 4.15 | <.001* | .343 | <.001* | <.001* |
| Peripapillary | 51.39 ± 2.48 | 49.71 ± 3.07 | 44.29 ± 5.23 | <.001* | .102 | <.001* | <.001* |
| Superior‐hemi | 51.73 ± 2.71 | 49.60 ± 3.26 | 44.39 ± 5.30 | <.001* | .030* | <.001* | <.001* |
| Inferior‐hemi | 51.01 ± 2.79 | 49.81 ± 3.27 | 44.17 ± 5.50 | <.001* | .461 | <.001* | <.001* |
| SSI (macula scan) | 74.60 ± 6.48 | 73.64 ± 5.56 | 72.34 ± 4.68 | .133 | 1.000 | .147 | .620 |
| SCP density (%) | |||||||
| Mean | 51.15 ± 3.25 | 50.57 ± 2.14 | 49.45 ± 3.00 | .009* | .911 | .010* | .095 |
| Fovea | 20.70 ± 6.57 | 20.47 ± 6.16 | 19.39 ± 7.41 | .565 | 1.000 | 1.000 | 1.000 |
| Parafovea | 53.96 ± 4.52 | 53.39 ± 2.54 | 52.70 ± 3.06 | .176 | 1.000 | .200 | .781 |
| Perifovea | 52.07 ± 3.21 | 51.18 ± 2.34 | 50.10 ± 3.27 | .005* | .406 | .004* | .145 |
| DCP density (%) | |||||||
| Mean | 54.47 ± 5.31 | 52.57 ± 5.48 | 50.02 ± 5.61 | <.001* | .266 | <.001* | .039* |
| Fovea | 37.16 ± 7.31 | 35.98 ± 7.66 | 35.40 ± 7.97 | .530 | 1.000 | .790 | 1.000 |
| Parafovea | 58.35 ± 3.68 | 56.49 ± 5.23 | 53.43 ± 5.24 | <.001* | .183 | <.001* | .003* |
| Perifovea | 56.08 ± 5.72 | 54.10 ± 5.71 | 51.29 ± 6.14 | <.001* | .297 | <.001* | .031* |
Note: Values are presented as mean ± SD.
Abbreviations: ACHD, acyanotic congenital heart disease; CCHD, cyanotic congenital heart disease; DCP, deep capillary plexus; RPC, radial peripapillary capillary; SCP, superficial capillary plexus; SSI, signal strength index.
P value for the comparison among CCHD group, ACHD group and control group using one‐way analysis of variance.
P value for the comparison between the ACHD group and control group using post hoc Bonferroni.
P value for the comparison between the CCHD group and control group using post hoc Bonferroni.
P value for the comparison between the ACHD group and CCHD group using post hoc Bonferroni.
Significant statistical difference, P < .05.
3.2.1. Radial peripapillary capillary
Among the three groups, patients with CCHD had the significantly lowest VD of the whole image and the peripapillary area in the RPC (all P < .001). For the sectors in the RPC, the CCHD patients had significantly lowest VD in all sectors compared to other groups (all P < .05). However, the density of these sectors in the RPC did not differ significantly between ACHD patients and control subjects, except for the ST sector (P = .013).
3.2.2. Superficial capillary plexus
The mean VD of the SCP was compared among the three groups. Patients with CCHD had a significantly lower mean VD of the whole image (P = .010) and the perifovea area (P = .004) in the SCP, compared with the control subjects. But no significant differences were observed among the ACHD group and the other two groups in the SCP.
3.2.3. Deep capillary plexus
Analysis of VD in the DCP revealed that the mean VD was the lowest in the patients with CCHD when compared to the ACHD group (in the parafovea P = .003, and perifovea P = .031), and to the control group (in the parafovea and perifovea, both P < .001). There was also no significant difference between the ACHD group and the control group in the DCP.
3.3. Correlations analysis between OCTA parameters and clinical data
There was a significant positive correlation between SaO2 and VD in the RPC (in the whole image, ρ = 0.45; in the peripapillary, ρ = 0.48; both P < .001). The negative correlations were shown between HCT and the VD in the RPC (in the whole image, ρ = 0.55; in the peripapillary, ρ = 0.55; both P < .001) (Figure 2). Multiple regression analysis showed that HCT was a driving factor for VD (RPC, SCP and DCP) independent of oximetry oxygen saturation (all P < .05) (Table 4).
FIGURE 2.
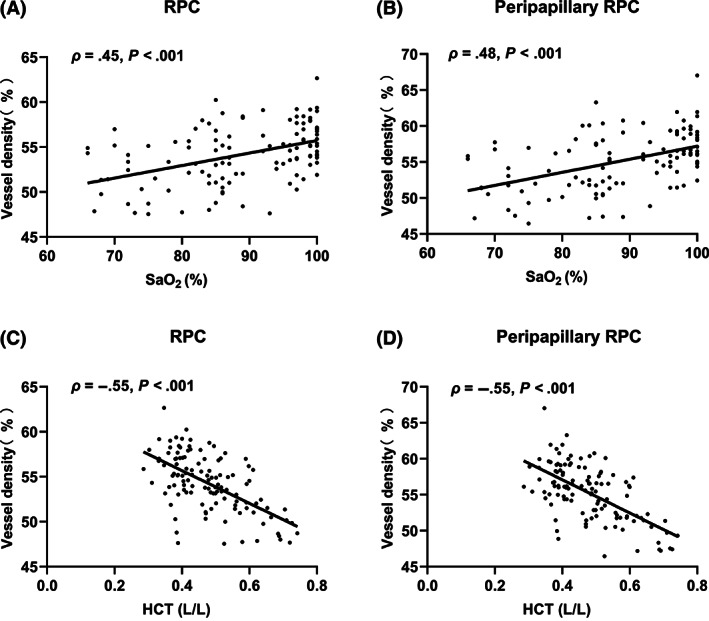
Correlation analyses between the VD of the RPC and SaO2 and HCT. A, The density of RPC and, B, peripapillary RPC were positively correlated with SaO2. C, The density of RPC and, D, peripapillary RPC were negatively correlated with HCT. HCT, haematocrit; RPC, radial peripapillary capillary; SaO2, oxygen saturation; VD, vessel density
TABLE 4.
Multiple linear regression analysis for retinal vessel density among three groups
| RPC | SCP | DCP | |||||||
|---|---|---|---|---|---|---|---|---|---|
| β | 95% CI | P value | β | 95% CI | P value | β | 95% CI | P value | |
| SaO2 | 0.03 | −0.04 to 0.10 | .406 | 0.02 | −0.06 to 0.10 | .592 | 0.06 | −0.10 to 0.22 | .437 |
| HCT | −16.34 | −21.75 to −10.93 | <.001* | −10.94 | −16.75 to −5.13 | <.001* | −14.37 | −26.13 to −2.61 | .017* |
Abbreviations: CI, confidence interval; DCP, deep capillary plexus; HCT, haematocrit; RPC, radial peripapillary capillary; SaO2, oxygen saturation; SCP, superficial capillary plexus.
Significant statistical difference, P < .05.
4. DISCUSSION
In this study, we evaluated the RVD changes in patients with CHD by using OCTA. Our results indicated that CCHD patients had the lowest VD in the macula and optic disc compared to ACHD patients and control subjects. However, in CCHD patients, the VD reduction in the macula was only revealed in the DCP when compared to ACHD patients. Besides, the RVD was positively correlated with SaO2 and negatively correlated with HCT among CHD patients.
The RVD most significantly decreased in CCHD patients compared to ACHD patients and control subjects. This alteration might suggest the response to chronic hypoxia in CCHD patients. On the one hand, the chronic severe hypoxemia could stimulate erythropoietin production causing a secondary erythrocytosis and hyperviscosity. 21 , 22 On the other hand, high blood viscosity associated with excessively elevated haematocrit would further reduce oxygen supply and tissue perfusion. 23 The multivariable models in the present study indicated that blood viscosity was the driving factor for RVD, independent of oximetry oxygen saturation. Besides, endothelial dysfunction caused by hypoxia has been found in the systemic arteries and retinal vessels in CCHD patients. 24 This might be the result of reduced expression of nitric oxide synthase and increased nitric oxide scavenging. 4 , 25 , 26 The impaired endothelial function could significantly reduce endothelium‐dependent vasodilation and lead to vasoconstriction. 27 Additionally, a previous study also supported the increased arterial stiffness might result in the hypoperfusion of retina in CCHD patients. 3
The different capillary layers of the retina might respond differently to the pathologic changes, such as hypoxia and ischemia. The early stage of diabetic retinopathy with the hypoxia in retina was featured by the more significant reduced VD in the DCP. 28 , 29 , 30 In our research, among the CHD patients, we also found CCHD patients had more significantly reduced VD in the DCP. Anatomically, The SCP is composed of arterioles that are surrounded by smooth muscle cells. However, the DCP consists of vessels smaller and thinner and surrounded by pericytes. 31 , 32 , 33 Several studies have proved that pericytes were more sensitive to hypoxia. 32 , 34 Furthermore, the DCP is far away from the arterioles which are the source of oxygen. 35 Hence, the DCP would mostly be affected in case of hypoxia. Functionally, DCP located in a watershed zone of oxygen supply. 36 The DCP supplies oxygen to the inner retina and the outer retina, while the SCP only needs to maintain the oxygen stability of the inner retina. 37 Therefore, the DCP might be more vulnerable to hypoxia.
In the present study, retinal microvasculature impairment was much severer in CCHD patients than ACHD patients, indicating that the retinal microvasculature was associated with the severity of chronic hypoxia in CHD. It had been stated previously that higher prevalence of structural and functional ocular abnormalities in the CCHD group than that in the ACHD group. 38 CCHD is characterized by unsaturated blood distributed into the systemic circulation and thus presents with much severer hypoxia than ACHD. 39 Besides, in our study, the mean SaO2 of ACHD patients was within normal range and no significant RVD changes were found between ACHD patients and control subjects, which supported the relationship of the lower RVD and severer hypoxia. These findings might have a potential value to estimate the severity of hypoxia in CHD patients and help us to better understand the ocular effects of CCHD.
Our results also indicated that the change of RVD was positively correlated with SaO2 and negatively correlated with HCT among CHD patients. On the one hand, hypoxia and secondary erythrocytosis could lead to retinal microvasculature impairments and vascular dysfunction. 24 , 26 , 40 On the other hand, studies have proved that retinal vasculature dilation and tortuosity could be significantly relieved after cardiac surgical repair improve hypoxia. 41 , 42 To some extent, it might provide a clue that the retinal microcirculation could reflect systemic hypoxia statue. 14 , 43 Furthermore, retinal microvasculature has been proposed as an easily measured surrogate for systemic circulation and could be a possible marker of vascular damage in CHD patients.
The retina is highly metabolically active tissue and one of the tissues with the highest oxygen consumption in the body. 44 , 45 Therefore, the retina is highly sensitive to systemic hypoxemia. It has already been found that RVD was decreased in obstructive sleep apnoea syndrome (OSAS) as a result of chronic systemic hypoxemia. 46 Similarly, in our study, we also found significantly reduced RVD in CCHD patients. Notably, the retina might be a noninvasive window to evaluate microcirculation status under the condition of chronic hypoxia.
The main strength of our study is using a convenient and noninvasive technology, OCTA, to observe retinal microvascular changes in CHD patients. Nonetheless, there are still several limitations to the present study. Firstly, the number of subjects is limited and this cross‐sectional study is unable to evaluate the retinal vasculature impairment with disease progression, further explorations are needed. Secondly, the field of view might be limited in the current technology of OCTA. 47 Although the 6 × 6 mm2 HD mode was chosen, we still could not completely understand the vascular changes in the peripheral retina. Thirdly, some severe CHD patients failed to survive at a young age, so the selection bias inevitably exists.
4.1. Conclusion
In conclusion, this study has found that CCHD patients had the lowest RVD when compared to ACHD patients and control subjects. RVD might have a potential value to estimate the severity of hypoxia in CHD patients and help us to better understand the microcirculation effect of CCHD. Retinal vasculature could provide a deeper insight into the effect of chronic systemic hypoxemia on retinal structure and function. The results are promising, and further study is warranted.
FINANCIAL DISCLOSURES
This work was supported by the Project of Investigation on Health Status of Employees in Financial Industry in Guangzhou (Z012014075) (Xiaohong Yang); Science and Technology Program of Guangzhou, China (202002020049) (Xiaohong Yang); The National Natural Science Foundation of China (81870663) (Honghua Yu); The Talent Introduction Fund of Guangdong Provincial People's Hospital (KJ012019087, Y012018145) (Honghua Yu); Medical Scientific Research Foundation of Guangdong Province of China (C2019044) (Manqing Huang).
CONFLICT OF INTEREST
None declared.
Li C, Zhong P, Yuan H, et al. Retinal microvasculature impairment in patients with congenital heart disease investigated by optical coherence tomography angiography. Clin Experiment Ophthalmol. 2020;48:1219–1228. 10.1111/ceo.13846
Cong Li, Pingting Zhong and Haiyun Yuan contributed equally to this work.
Funding information Medical Scientific Research Foundation of Guangdong Province of China, Grant/Award Number: C2019044; National Natural Science Foundation of China, Grant/Award Number: 81870663; Project of Investigation on Health Status of Employees in Financial Industry in Guangzhou, Grant/Award Number: Z012014075; Science and Technology Program of Guangzhou, China, Grant/Award Number: 202002020049; Talent Introduction Fund of Guangdong Provincial People's Hospital, Grant/Award Numbers: KJ012019087, Y012018145
Contributor Information
Honghua Yu, Email: yuhonghua@gdph.org.cn.
Xiaohong Yang, Email: syyangxh@scut.edu.cn.
REFERENCES
- 1. Liu Y, Chen S, Zuhlke L, et al. Global birth prevalence of congenital heart defects 1970‐2017: updated systematic review and meta‐analysis of 260 studies. Int J Epidemiol. 2019;48:455‐463. [DOI] [PMC free article] [PubMed] [Google Scholar]
- 2. Ross FJ, Arakaki LSL, Ciesielski WA, et al. Assessment of muscle oxygenation in children with congenital heart disease. Paediatr Anaesth. 2019;29:850‐857. [DOI] [PubMed] [Google Scholar]
- 3. Trojnarska O, Szczepaniak‐Chicheł L, Gabriel M, et al. Arterial stiffness and arterial function in adult cyanotic patients with congenital heart disease. J Cardiol. 2017;70:62‐67. [DOI] [PubMed] [Google Scholar]
- 4. Cordina RL, Celermajer DS. Chronic cyanosis and vascular function: implications for patients with cyanotic congenital heart disease. Cardiol Young. 2010;20:242‐253. [DOI] [PubMed] [Google Scholar]
- 5. Willems A, Patte P, Groote FD, Linden PV. Cyanotic heart disease is an independent predicting factor for fresh frozen plasma and platelet transfusion after cardiac surgery. Transfus Apher Sci. 2019;58:304‐309. [DOI] [PubMed] [Google Scholar]
- 6. Perloff JK. Cyanotic congenital heart disease the coronary arterial circulation. Curr Cardiol Rev. 2012;8:1‐5. [DOI] [PMC free article] [PubMed] [Google Scholar]
- 7. Dedkov EI, Perloff JK, Tomanek RJ, Fishbein MC, Gutterman DD. The coronary microcirculation in cyanotic congenital heart disease. Circulation. 2006;114:196‐200. [DOI] [PubMed] [Google Scholar]
- 8. Hongsawong N, Khamdee P, Silvilairat S, Chartapisak W. Prevalence and associated factors of renal dysfunction and proteinuria in cyanotic congenital heart disease. Pediatr Nephrol. 2018;33:493‐501. [DOI] [PubMed] [Google Scholar]
- 9. Nasir‐Ahmad S, Cordina R, Liew G, McCluskey P, Celermajer D. The eye in CHD. Cardiol Young. 2018;28:981‐985. [DOI] [PubMed] [Google Scholar]
- 10. Flammer J, Konieczka K, Bruno RM, Virdis A, Flammer AJ, Taddei S. The eye and the heart. Eur Heart J. 2013;34:1270‐1278. [DOI] [PMC free article] [PubMed] [Google Scholar]
- 11. Chugh R, Perloff JK, Fishbein M, Child JS. Extramural coronary arteries in adults with cyanotic congenital heart disease. Am J Cardiol. 2004;94:1355‐1357. [DOI] [PubMed] [Google Scholar]
- 12. Loomba RS, Leavitt JA, Cetta F. Headache and papilledema in an adult with cyanotic congenital heart disease: the importance of fundoscopic evaluation rather than phlebotomy. Congenit Heart Dis. 2012;7:e14‐e17. [DOI] [PubMed] [Google Scholar]
- 13. Mansour A, Bitar F, Traboulsi E, et al. Ocular pathology in congenital heart disease. Eye. 2005;19:29‐34. [DOI] [PubMed] [Google Scholar]
- 14. Traustason S, Jensen AS, Arvidsson HS, Munch IC, Søndergaard L, Larsen M. Retinal oxygen saturation in patients with systemic hypoxemia. Invest Ophthalmol Vis Sci. 2011;52:5064‐5067. [DOI] [PubMed] [Google Scholar]
- 15. Veluchamy A, Ballerini L, Vitart V, et al. Novel genetic locus influencing retinal venular tortuosity is also associated with risk of coronary artery disease. Arterioscler Thromb Vasc Biol. 2019;39:2542‐2552. [DOI] [PMC free article] [PubMed] [Google Scholar]
- 16. Kromer R, Tigges E, Rashed N, Pein I, Klemm M, Blankenberg S. Association between optical coherence tomography based retinal microvasculature characteristics and myocardial infarction in young men. Sci Rep. 2018;8:5615. [DOI] [PMC free article] [PubMed] [Google Scholar]
- 17. Spaide RF, Klancnik JM Jr, Cooney MJ. Retinal vascular layers imaged by fluorescein angiography and optical coherence tomography angiography. JAMA Ophthalmol. 2015;133:45‐50. [DOI] [PubMed] [Google Scholar]
- 18. Stout KK, Daniels CJ, Aboulhosn JA, et al. 2018 AHA/ACC guideline for the management of adults with congenital heart disease: executive summary: a report of the American College of Cardiology/American Heart Association task force on clinical practice guidelines. Circulation. 2019;139:e637‐e697. [DOI] [PubMed] [Google Scholar]
- 19. Nguyen VP, Dolgner SJ, Dardas TF, Verrier ED, McMullan DM, Krieger EV. Improved outcomes of heart transplantation in adults with congenital heart disease receiving regionalized care. J Am Coll Cardiol. 2019;74:2908‐2918. [DOI] [PubMed] [Google Scholar]
- 20. Jia Y, Tan O, Tokayer J, et al. Split‐spectrum amplitude‐decorrelation angiography with optical coherence tomography. Opt Express. 2012;20:4710‐4725. [DOI] [PMC free article] [PubMed] [Google Scholar]
- 21. Tsui I, Shamsa K, Perloff JK, Lee E, Wirthlin RS, Schwartz SD. Retinal vascular patterns in adults with cyanotic congenital heart disease. Semin Ophthalmol. 2009;24:262‐265. [DOI] [PubMed] [Google Scholar]
- 22. Zabala LM, Guzzetta NA. Cyanotic congenital heart disease (CCHD): focus on hypoxemia, secondary erythrocytosis, and coagulation alterations. Paediatr Anaesth. 2015;25:981‐989. [DOI] [PubMed] [Google Scholar]
- 23. DeFilippis AP, Law K, Curtin S, Eckman JR. Blood is thicker than water: the management of hyperviscosity in adults with cyanotic heart disease. Cardiol Rev. 2007;15:31‐34. [DOI] [PubMed] [Google Scholar]
- 24. Cordina RL, Nakhla S, O'Meagher S, Leaney J, Graham S, Celermajer DS. Widespread endotheliopathy in adults with cyanotic congenital heart disease. Cardiol Young. 2015;25:511‐519. [DOI] [PubMed] [Google Scholar]
- 25. Toporsian M, Govindaraju K, Nagi M, Eidelman D, Thibault G, Ward ME. Downregulation of endothelial nitric oxide synthase in rat aorta after prolonged hypoxia in vivo. Circ Res. 2000;86:671‐675. [DOI] [PubMed] [Google Scholar]
- 26. Ferreiro CR, Chagas ACP, Carvalho MHC, et al. Influence of hypoxia on nitric oxide synthase activity and gene expression in children with congenital heart disease: a novel pathophysiological adaptive mechanism. Circulation. 2001;103:2272‐2276. [DOI] [PubMed] [Google Scholar]
- 27. Oechslin E, Kiowski W, Schindler R, Bernheim A, Julius B, Rocca HPB‐L. Systemic endothelial dysfunction in adults with cyanotic congenital heart disease. Circulation. 2005;112:1106‐1112. [DOI] [PubMed] [Google Scholar]
- 28. Sambhav K, Abu‐Amero KK, Chalam KV. Deep capillary macular perfusion indices obtained with OCT angiography correlate with degree of nonproliferative diabetic retinopathy. Eur J Ophthalmol. 2017;27:716‐729. [DOI] [PubMed] [Google Scholar]
- 29. Dimitrova G, Chihara E. Implication of deep‐vascular‐layer alteration detected by optical coherence tomography angiography for the pathogenesis of diabetic retinopathy. Ophthalmologica. 2019;241:179‐182. [DOI] [PubMed] [Google Scholar]
- 30. Cheng H, Nair G, Walker TA, et al. Structural and functional MRI reveals multiple retinal layers. Proc Natl Acad Sci USA. 2006;103:17525‐17530. [DOI] [PMC free article] [PubMed] [Google Scholar]
- 31. Trost A, Bruckner D, Rivera FJ, Reitsamer HA. Pericytes in the retina. Adv Exp Med Biol. 2019;1122:1–26. [DOI] [PubMed] [Google Scholar]
- 32. Schallek J, Geng Y, Nguyen H, Williams DR. Morphology and topography of retinal pericytes in the living mouse retina using in vivo adaptive optics imaging and ex vivo characterization. Invest Ophthalmol Vis Sci. 2013;54:8237‐8250. [DOI] [PMC free article] [PubMed] [Google Scholar]
- 33. Wang L, Murphy O, Caldito NG, Calabresi PA, Saidha S. Emerging applications of optical coherence tomography angiography (OCTA) in neurological research. Eye Vis. 2018;5:11. [DOI] [PMC free article] [PubMed] [Google Scholar]
- 34. Hall CN, Reynell C, Gesslein B, et al. Capillary pericytes regulate cerebral blood flow in health and disease. Nature. 2014;508:55‐60. [DOI] [PMC free article] [PubMed] [Google Scholar]
- 35. Fouquet S, Vacca O, Sennlaub F, Paques M. The 3D retinal capillary circulation in pigs reveals a predominant serial organization. Invest Ophthalmol Vis Sci. 2017;58:5754‐5763. [DOI] [PubMed] [Google Scholar]
- 36. Binotti WW, Romano AC. Projection‐resolved optical coherence tomography angiography parameters to determine severity in diabetic retinopathy. Invest Ophthalmol Vis Sci. 2019;60:1321‐1327. [DOI] [PubMed] [Google Scholar]
- 37. Bentmann A, Schmidt M, Reuss S, Wolfrum U, Hankeln T, Burmester T. Divergent distribution in vascular and avascular mammalian retinae links neuroglobin to cellular respiration. J Biol Chem. 2005;280:20660‐20665. [DOI] [PubMed] [Google Scholar]
- 38. Vilela MAP, Sbruzzi G, Pellanda LC. Prevalence of ophthalmological abnormalities in children and adolescents with CHD: systematic review and meta‐analysis of observational studies. Cardiol Young. 2016;26:477‐484. [DOI] [PubMed] [Google Scholar]
- 39. Rohit M, Shrivastava S. Acyanotic and cyanotic congenital heart diseases. Indian J Pediatr. 2018;85:454‐460. [DOI] [PubMed] [Google Scholar]
- 40. Marino P, Lopes GO, Borges JP, Cola MCT, Kopiler DA, Tibirica E. Evaluation of systemic microvascular reactivity in adults with congenital heart disease. Congenit Heart Dis. 2018;13:978‐987. [DOI] [PubMed] [Google Scholar]
- 41. Crowe RJ, Kohner EM, Owen SJ, Robinson DM. The retinal vessels in congenital cyanotic heart disease. Med Biol Illus. 1969;19:95‐99. [PubMed] [Google Scholar]
- 42. Kohner EM, Allen EM, Saunders KB, Emery VM, Pallis C. Electroencephalogram and retinal vessels in congenital cyanotic heart disease before and after surgery. Br Med J. 1967;4:207‐210. [DOI] [PMC free article] [PubMed] [Google Scholar]
- 43. Cheng RW, Yusof F, Tsui E, et al. Relationship between retinal blood flow and arterial oxygen. J Physiol. 2016;594:625‐640. [DOI] [PMC free article] [PubMed] [Google Scholar]
- 44. Sousa DC, Leal I, Moreira S, Dionısio P, Pinto LA, Marques‐Neves C. Hypoxia challenge test and retinal circulation changes – a study using ocular coherence tomography angiography. Acta Ophthalmol Scand. 2018;96:e315‐e319. [DOI] [PubMed] [Google Scholar]
- 45. Caprara C, Thiersch M, Lange C, Joly S, Samardzija M, Grimm C. HIF1A is essential for the development of the intermediate plexus of the retinal vasculature. Invest Ophthalmol Vis Sci. 2011;52:2109‐2117. [DOI] [PubMed] [Google Scholar]
- 46. Yu J, Xiao K, Huang J, Sun X, Jiang C. Reduced retinal vessel density in obstructive sleep apnea syndrome patients: an optical coherence tomography angiography study. Invest Ophthalmol Vis Sci. 2017;58:3506‐3512. [DOI] [PubMed] [Google Scholar]
- 47. Chen CL, Wang RK. Optical coherence tomography based angiography [invited]. Biomed Opt Express. 2017;8:1056‐1082. [DOI] [PMC free article] [PubMed] [Google Scholar]