

Abstract
Background
Nerves are key factors in prostate cancer (PCa) progression. Here, we propose that neuropeptide Y (NPY) nerves are key regulators of cancer–nerve interaction.
Methods
We used in vitro models for NPY inhibition studies and subsequent metabolomics, apoptotic and migration assays, and nuclear transcription factor‐κB (NF‐κB) translocation studies. Human naïve and radiated PCa tissues were used for NPY nerve density biomarker studies. Tissues derived from a Botox denervation clinical trial were used to corroborate metabolomic changes in humans.
Results
Cancer cells increase NPY positive nerves in vitro and in preneoplastic human tissues. NPY‐specific inhibition resulted in increased cancer apoptosis, decreased motility, and energetic metabolic pathway changes. A comparison of metabolomic response in NPY‐inhibited cells with the transcriptome response in human PCa patients treated with Botox showed shared 13 pathways, including the tricarboxylic acid cycle. We identified that NF‐κB is a potential NPY downstream mediator. Using in vitro models and tissues derived from a previous human chemical denervation study, we show that Botox specifically, but not exclusively, inhibits NPY in cancer. Quantification of NPY nerves is independently predictive of PCa‐specific death. Finally, NPY nerves might be involved in radiation therapy (RT) resistance, as radiation‐induced apoptosis is reduced when PCa cells are cocultured with dorsal root ganglia/nerves and NPY positive nerves are increased in prostates of patients that failed RT.
Conclusion
These data suggest that targeting the NPY neural microenvironment may represent a therapeutic approach for the treatment of PCa and resistance through the regulation of multiple oncogenic mechanisms.
Keywords: cancer, metabolism, nerves, neurogenesis, neuropeptide Y, prostate, radiation resistance
1. INTRODUCTION
Nerve‐cancer biology is becoming of greater importance and acceptance. Nerves have a fundamental role in cancer progression. 1 , 2 , 3 Our group has shown that tumor growth in the prostate requires intact innervation, as denervation of host rodent prostates suppresses tumor growth. In a chemical denervation human clinical trial, we induced prostate cancer (PCa) cell apoptosis using Botox. 1 Similarly, patients with spinal cord injury have a lower incidence of PCa. 4 , 5 Thus, nerves are critical determinants of PCa pathogenesis, aggressiveness, and patient outcomes.
Nerves and cancer interact at many stages. PCa induces axonogenesis, or growth of axons, through semaphorin 4F. 6 , 7 , 8 The resulting increase in nerve density correlates with reduced survival. 7 Neurogenesis, or neo neurons, are increased in tumors and are derived from the central nervous system. 9 , 10 Finally, the last interaction of nerves and cancer, perineural invasion (PNI) provides a survival advantage for cancer cells. 11 , 12 , 13 , 14 These phenomena are present in many other cancer types. 15 , 16 , 17 , 18
Many neuropeptides have been implicated in cancer regulation. The adrenergic axis is important in PCa. 19 The acetylcholine axis mediates the regulation of stomach cancer. 3 , 20 In this study, we present another neuropeptide, neuropeptide Y (NPY), as a critical regulator of the interactions between nerves and PCa.
NPY is expressed in the central nervous system and the prostate. 21 It influences food intake and energy metabolism, stress, and immune response. It is involved in tumor progression, cell proliferation, matrix invasion, metastasis, and angiogenesis. 22 , 23 , 24 , 25 NPY has been involved in the regulation of neuroblastomas 26 , 27 and Ewing's sarcoma. 28 In this study, we identify that NPY is a key regulator of PCa apoptosis, motility, energetic metabolism, and radiation therapy (RT) resistance. NPY nerve density correlates with aggressive disease. We believe that our findings are seminal and describe a distinct neuropeptide as a critical regulator of nerve–PCa interactions affecting pathogenesis and therapy resistance. It is likely to be relevant to other neoplasms.
2. MATERIAL AND METHODS
2.1. Nerve subtype analysis in human tissues
Two tissue microarrays (TMAs) were used for this study. The first set of nonneoplastic prostate tissues derived from autopsy prostates (114 patients) from different age groups (10–20, 21–30, 31–40, 41–50, and 51–60 years). The prostates were embedded entirely such that cancer could be excluded in these patients. The second array was created from 50 patients and contained nonneoplastic tissues, high‐grade prostatic intraepithelial neoplasia (HGPIN), and cancer. Immunohistochemical stains with antibodies against the following targets were performed using standard procedure: norepinephrine (AB120 #0606033420); Chemicon; rabbit; 1:2000, NPY (NB‐600‐1094); Biomol; rabbit; 1:2000, vasointestinal peptide (VIP; Z05815); Biomol; rabbit; 1:1000, leu‐enkephalin (GTX26542); Abcam; rabbit; 1:4000, and nitric oxide synthase (482750); Calbiochem; rabbit; 1:4000. The methodology described in the previous section was used to analyze the nerve subtype fiber.
2.2. NPY‐specific axonogenesis
A mouse strain that expresses green fluorescent protein (GFP) only in NPY expressing nerves (NPY–GFP mice) was purchased from the Jackson Laboratory (B6.FVB‐Tg [Npy‐hrGFP]1Lowl/J, Stock No. 004779). Human PCa Du145 cells (5 × 10⁴) were cultured alone or with the NPY–GFP mice dorsal root ganglia (DRG) in 100 μl Growth Factor Reduced (GFR) Matrigel Basement Membrane Matrix (Corning; cat# 354230), in six‐well plates (DRG alone, DRG + Du145, 10 wells, and 9 wells, respectively). Cells were maintained in Roswell Park Memorial Institute (RPMI)‐1640 medium supplemented in 5% Nu‐Serum, and 0.5% antibiotic/antimycotic, 2 ml/well, and incubated at 37°C in a humidified atmosphere of 5% CO2 in the air. Culture media was changed every 2 days.
The green fluorescence DRG/neurites were photographed at ×4 magnification with OLYMPUS XM10 camera attached to the OLYMPUS IX71 microscope, on Day 2, 5, and 7. The outgrowth of NPY–GFP‐expressing neurites was quantitated by manually measuring the neurites area threshold using the ImageJ system.
2.3. Effect of NPY receptor 1 antagonist on proliferation and apoptosis
Human PCa cells Du145 (5 × 10⁴ cells/well) and LNCaP (8 × 10⁴ cells/well) were cultured with or without mouse DRG in 100 µl GFR Matrigel Matrix (Corning; cat# 354230), in a six‐well plate. Cells were maintained in 2 ml/well of RPMI‐1640 medium supplemented in 5% Nu‐Serum (Corning; cat# CB‐55000), and 0.5% antibiotic/antimycotic (Life Technologies; cat# 15240062), and incubated 37°C in a humidified atmosphere of 5% CO2 in the air. NPY receptor 1 (NPY1R) antagonist (BIBP3226; Sigma‐Aldrich; cat# B174) was added to the Matrigel and culture medium at the concentrations as indicated. Culture media was changed every 2 days. At Day 9, cells with DRG and Matrigel were fixed with 10% formalin and then paraffin embedded. Sections were subjected to apoptosis assay (terminal deoxynucleotidyl transferase dUTP nick‐end labeling [TUNEL] assay) and proliferation assay (immunohistochemistry [IHC], Ki67 Staining).
2.4. In vitro scratch (motility) assay
Du145 and PC‐3 cells were seeded in 60‐mm plates, 8 × 10⁵ cells per plate for Du145 cells and 1 × 10⁶ cells per plate for PC‐3 cells, four plates for each cell line. The next day, two plates were transfected with NPY1R small interfering RNA (siRNA) or the Silencer negative control siRNA at the final concentration of 10 nM, Lipofectamine RNAiMAX reagent was used for the siRNA transfection. Twenty‐four hours later, NPY was added to the two siRNA‐transfected plates and one non‐siRNA‐transfected plate at the concentration of 10 nM, another non‐siRNA‐transfected plate was added equal volume of phosphate‐buffered saline (PBS) as control. The next day, cell density was reached 100%, a "scratch" was created by using a pipette tip. To remove the debris and smooth the edge of the scratch, cells were washed once with PBS and replaced with fresh growth medium, with or without 10 nM NPY. To obtain the same field during the image acquisition, markings were made as reference points close to scratch. Photos were taken at 0, 24, 48, 72, and 96 h (Du145) or 0, 24, 48, and 72 h (PC‐3) under the microscope.
2.5. Effect of NPY on metabolism
To examine the effects of NPY on metabolism, we set up two experimental conditions. In Experiment 1, we added the same NPY1R antagonist (BIBP3226) to Du145 and LNCaP cells, with PBS serving as a control. The number of passages between collection was P2‐P12, and all the cells used for experiments were in the passage less than P20. We purchase new cell line batches from ATCC regularly.
In Experiment 2, cells were transfected with NPY1R siRNA (Ambion; part #4392420) or the Silencer negative control siRNA (Ambion; part #AM4613). Du145 (5 × 10⁵ cells/well) and LNCaP (7.5 × 10⁵ cells/well) were seeded in six‐well plates. Twenty‐four hours (Du145) or 48 h (LNCaP) later, cells were transfected with NPY1R siRNA or the Silencer negative control siRNA at the final concentration of 10 nM. Lipofectamine RNAiMAX reagent was used for the siRNA transfection (Invitrogen; cat #13778‐075). A small portion of cells was aliquoted to check the siRNA efficiency. RNA was extracted by Anrum Total RNA Mini Kit (BioRad; cat# 732‐6820), complementary DNA (cDNA) was synthesized by iScipt cDNA Synthesis Kit (BioRad; cat# 170‐8890), and quantitative polymerase chain reaction (Q‐PCR) was performed to determine the NPY1R messenger RNA expression levels. For Q‐PCR, NPY1R and HPRT1 primers (cat# 10025636), and iTaq™ Universal SYBR® Green Supermix (cat# 1725121) was obtained from BioRad, HPRT1 was served as the reference gene. Q‐PCR was performed by using the BioRad's CFX 96 Real‐Time System instrument, and following the manufactory's instructions. Data were analyzed by BioRad's CFX Manager 3.1 software. The relative expression of NPY1R was 0.25 in Du145 and 0.38 in LNCaP.
After transfection for 24 h, cells were seeded for the metabolomics experiment.
Human PCa Du145 and LNCaP cells, or siRNA‐transfected Du145 and LNCaP cells (3 × 10⁵ cells) were cocultured with mouse DRG in 100 µl GFR Matrigel Matrix, in a six‐well plate. To obtain enough cells for the metabolomics study, we put two sets of cells/DRG/Matrigel in one well and collected 4–6 wells cells as one sample, five replicates per group. Cells were maintained in RPMI‐1640 medium supplemented in 5% Nu‐Serum, and 0.5% antibiotic/antimycotic, 4 ml/well, and incubated at 37°C in a humidified atmosphere of 5% CO2 in the air. In Du145 and LNCaP untransfected cells, NPY1R antagonist was added to the Matrigel and culture medium at the concentrations of 5 µM, PBS was served as the control. Culture media was changed 48 h later.
At Day 3, culture media and DRG were removed, and Dispase was used to digest Matrigel. DNA concentration to normalize cell numbers for each sample (reference paper: Measurement of DNA concentration as a normalization strategy for metabolomic data from adherent cell lines. Anal Chem, 2013, 85, 9536−9542). After two washes with cold PBS, cells were suspended in 11.5 ml PBS, 1.5 ml of cells were used to extract genomic DNA (Qiagen; cat# 69504), and each sample was adjusted according to the DNA concentration for normalization. Cells were pelleted and stored at −80°C for the metabolomic experiments.
2.6. Sample preparation for mass spectrometry‐based examination of the metabolome in tissues
For extraction of the metabolome, cell lysate was homogenized in 1:4 ice‐cold water:methanol mixture containing an equimolar mixture of six standard compounds ([15N] anthranilic acid jasmonic acid, gibberellic acid, [D4] estrone, [15N]‐tryptophan, and [D4] thymine). This was followed by the sequential addition of ice‐cold chloroform and water in a 3:1 ratio and separation of the organic (methanol and chloroform) and aqueous solvents (water:methanol:chloroform:water, ratio 1:4:3:1). The aqueous extract was deproteinized using a 3 kDa molecular filter (Amicon Ultracel‐3K membrane; Millipore Corporation) and the filtrate containing metabolites was dried under vacuum (Genevac EZ‐2plus). Before mass spectrometry, the dried extract was resuspended in an identical volume of injection solvent composed of water:methanol (50:50) and subjected to liquid chromatography (LC) mass spectrometry (MS). Nine pathologically evaluated mouse prostate tissues (saline control n = 4 and Botox‐treated n = 5) were examined for their metabolomic profiles, as well as cell pellets (NPY inhibition studies).
2.7. Liquid chromatography/mass spectrometry
Ten microliters of suspended samples were injected and analyzed using a 6490 triple quadrupole mass spectrometer (Agilent Technologies) coupled to an high‐performance liquid chromatography (HPLC) system (Agilent Technologies) via multiple reaction monitoring of a total of 239 endogenous water‐soluble metabolites for steady‐state analyses of samples. The 239 compounds monitored were chosen due to their involvement in central pathways important in a number of malignancies. Source parameters were as follows: The gas temperature was 250°C; gas flow was 14 L/min; nebulizer was 20 psi; sheath gas temperature was 350°C; sheath gas flow was 12 L/min; capillary was 3000 V positive and 3000 V negative; and nozzle voltage was 1500 V positive and 1500 V negative. Approximately 8–11 data points were acquired per detected metabolite. Samples were delivered to the MS via normal phase chromatography using either a 4.6 mm i.d. × 10 cm Amide XBridge HILIC column (Waters) or a Luna 3 µm NH2 100 A (Phenomenex) at 300 µl/min. Gradients were run starting from 85% buffer B (HPLC grade acetonitrile or 0.1% formic acid in acetonitrile) to 35% B from 0 to 3.5 min; 35% B to 2% B from 3.5 to 11.5 min; 2% B was held from 11.5 to 16.5 min; 2% B to 85% B from 16.5 to 17.5 min; and 85% B was held for 7 min to re‐equilibrate the column. The Peak area for each metabolite was integrated using MassHunter Workstation Software Quantitative Analysis Version B.06.00 software (Agilent Technologies).
2.8. Mass‐spectrometry data analysis
All the downstream processing and data analyses were performed using the R statistical analysis system (R Foundation for Statistical Computing). A total of 222 metabolites were measured using four methods. Metabolites were normalized utilizing internal standards for each method, specifically l‐glutamic acid‐d5, thymine‐d4, and l‐anthranilic acid. Data were median centered and interquartile range scaled following log2 transformation. Two‐sided t tests were performed to identify differential metabolites between LNCaP cells treated with siNS and with siNPY1R, as well as between LNCaP cells treated with dimethyl sulfoxide and with BIBP‐3226. The results were adjusted for false discovery rate (q < 0.2) using the Benjamini–Hochberg method along with estimated fold change using the R statistical analysis system.
2.9. Integrative analysis of metabolomics and transcriptomic profiles of PCa
We conducted an integrative analysis of metabolomics and transcriptomic profiles of denervation via commonly enriched pathways and processes, using the collections compiled by Gene Ontology (GO) and by the Molecular Signature Database (MSigDB; http://www.broadinstitute.org/gsea/msigdb), as described above. First, metabolites present at differential levels in the experimental groups were converted to enzyme/gene IDs according to the Kyoto Encyclopedia of Genes and Genomes (KEGG; http://www.genome.jp/kegg/). Pathway analysis was carried out using overrepresentation of pathways employing the hypergeometric distribution and using as null set the complete set of metabolites and corresponding genes (p < .05, and using a threshold of at least five genes overlapping with an enriched pathway).
2.10. NPY enzyme‐linked immunosorbent assay
Human PCa cells Du145 and LNCaP (1 × 10⁵ cells) were cocultured with three mouse DRG in 200 µl GFR Matrigel Matrix, in a 12‐well plate. Cells were maintained in RPMI‐1640 medium supplemented in 5% Nu‐Serum, and 0.5% antibiotic/antimycotic, 1 ml/well (Days 0–5) or 1.5 ml/well (Days 6–10), and incubated at 37°C in a humidified atmosphere of 5% CO2 in air. Botox (Allergan; cat# 92326) was added to the Matrigel and culture medium at the concentrations of 5 units/ml, saline was served as the control. Culture media was changed every 48 h.
At Day 10, DRGs were removed, supernatants and cells were collected. Dispase was used to digest Matrigel, and protein was extracted from cells. Undiluted supernatant and 2 µg/well protein were used for enzyme‐linked immunosorbent assay (ELISA). ELISA (RayBiotech; cat# EIA‐NPY) was performed according to the manufacture's instruction.
2.11. Double IHC for NPY and NPY1R
TMA slides were dual immunohistochemically stained by using the NPY (Novus Biologicals; cat# NB600‐1094) and NPY1R (Acris Antibodies; cat# SP4600P) antibodies. Before the dual staining, the NPY antibody was tested in test TMA containing different human prostate tissue samples, NPY1R antibody was tested in LnCap PCa cells transfected with scramble or NPY1R siRNA. Briefly, sections were deparaffinized in xylene, rehydrated through decreasing concentrations of alcohol ending in PBS, subjected to heat‐induce antigen retrieval in 10 mmol/L citrate buffer (pH 6.0) for 5 min at 125°C in a Pascal instrument (Dako; Cat# S280030), and allowed to cool off at room temperature. Endogenous peroxidase activity was quenched in 3% hydrogen peroxide solution in distilled water for 10 min at room temperature. To inhibit nonspecific staining, sections were incubated with a protein blocking solution (Dako; cat# X0909) for 10 min at room temperature, then incubated with rabbit polyclonal antibody against NPY (1:4000; 1 h at room temperature). Sections were washed and the bound antibody was detected by using a Biocare Medical MACH 4 Universal horseradish peroxidase (HRP)‐polymer (cat# M4U534 H) with diaminobenzidine (DAB) as a chromogen. To ensure that the second staining will not cross‐react with the first staining, sections were incubated with a denaturing solution for 3 min.
2.12. Imaging and assessment
A combination of deconvolution imaging (such as NUANCE®) and image segmentation technology (such as INFORM®) was utilized. All stained slides were digitized with the use of a multispectral imaging system which enabled capturing a series of images from a single field at the spectrum of specific wavelengths (420–720 nm). Multiple series of images taken at a different wavelength at one shut is called “image cube.” Image cubes were created for every case and saved in both multispectral .im3 and JPEG formats. All images were taken at ×100 magnification, to capture more than 95% of 0.6 mm tissue cores. The measurement of image spectral wavelengths enables more accurate separation of the tissue, and cellular components. Image segmentation software was used for tissue and cellular analysis of the tumoral stroma in the prostatic adenocarcinoma. Pictures from each case were reviewed individually and only tumor and tumoral stroma areas were selected for further analysis to avoid the interference of benign prostatic stroma in the analysis.
Tissues were algorithm segmented into compartments (cancer epithelium and cancer stroma); each compartment segmented into individual cells and each cell segmented into nuclei and cytoplasm. NPY and NPY1R signals were separated and analyzed in each compartment of the tumor separately. NPY1R was analyzed in the cytoplasm of the cancer cells and NPY analyzed as objects rather than cells in the stromal compartment of cancer.
2.13. Cohorts
We used two large cohorts:
-
(1)
Baylor College of Medicine: This cohort includes 1291 of the above patients who underwent surgery by a single surgeon (P. S.) between 1983 and 1998. Surgeries were performed without neoadjuvant chemoradiation therapy. A total of 642 patients with full clinicopathologic characterization and over 20 years of follow‐up were selected to construct a TMA. Inclusion criteria for this retrospective radical prostatectomy tissue array cohort were as follows: (1) no preoperative neoadjuvant therapy, (2) surgery performed by single surgeon (P. S.) between 1983 and 1998, (3) radical prostatectomy specimen available in the tissue bank, and (4) sufficient presence of cancerous tissue in the surgical specimen for cores of microarray. Patients’ age ranged from 37 to 80 years with a median of 63 and mean of 62 years. The average length of patient follow‐up after surgery was 42.08 ± 33.2 months (median = 45.2, maximum = 167.74). Prostatic‐specific antigen (PSA) levels before the surgery were available for 603 cases and ranged from 0.3 to 100 ng/ml, and median of 7.2 ng/ml, and SD of 10.99 ng/ml. Thirty percent of patients had a PSA level of higher than 10.5 ng/ml before surgery.
-
(2)
Johns Hopkins Pound: A TMA made of specimens from 237 cases (six arrays, TMAs 101, 116, 117, 119, 120, and 128) from the 304 cases recently identified to have a biochemical recurrence, local recurrence, or metastatic disease from patients treated by a single surgeon. These patients were obtained by retrieval of all available tissues from those cases analyzed recently by Pound et al. in 1999, on the study examining the natural history of PCa treated by radical prostatectomy.
2.13.1. NF‐κB translocation
Human PCa cells Du145 (5 × 10⁴ cells/well) and LnCap (8 × 10⁴ cells/well) were cultured with or without mouse DRG in 100 µl GFR Matrigel Matrix (Corning; cat# 354230), in a six‐well plate. Cells were maintained in 2 ml/well of RPMI‐1640 medium supplemented in 5% Nu‐Serum (Corning; cat# CB‐55000), and 0.5% antibiotic/antimycotic (Life Technologies; cat# 15240062), and incubated 37°C in a humidified atmosphere of 5% CO2 in the air. NPY1R antagonist (BIBP3226; Sigma‐Aldrich; cat# B174) was added to the Matrigel and culture medium at the concentrations as indicated (0 and 10 μM). Culture media was changed every 2 days. At Day 9, cells with DRG and Matrigel were fixed with 10% formalin and then paraffin embedded. Sections were subjected for pNF‐kB p65 (phospho S276; Abcam; cat# ab106129) IHC. This study was carried out in triplicate.
Briefly, sections were deparaffinized in xylene, rehydrated through decreasing concentrations of alcohol ending in PBS, subjected to heat‐induced antigen retrieval in Tris‐EDTA (pH 9.0, Dako; cat# S2367) for 4 min, 125°C in a Pascal instrument (Dako; cat# S280030), and allowed to cool off at room temperature. Endogenous peroxidase activity was quenched in 3% hydrogen peroxide solution in distilled water for 10 min at room temperature. To inhibit nonspecific staining, sections were incubated with a protein blocking solution (Dako; cat# X0909) for 10 min at room temperature, then incubated with rabbit polyclonal antibody against phospho‐NF‐kB (pNF‐kB) p65 (1:300; 2 h at room temperature). Sections were washed and the bound antibody was detected by using a Biocare Medical MACH 4 Universal HRP‐polymer (cat# M4U534 H) with DAB as the chromogen.
2.14. Radiation‐induced apoptosis
Du145 cells (1 × 10⁵) were cultured alone or with mouse DRG from Mapttm1(EGFP)Klt mice (Jackson Laboratory Stock No. 004779) in 100 μl Full Growth Factor Matrigel Matrix (BD Bioscience; cat# 356237), in six‐well plates, each 24 wells (four groups, Du145, Du145 + N, 4F, 4F + N). Cells were maintained in RPMI‐1640 medium supplemented in 5% Nu‐Serum, and 0.5% antibiotic/antimycotic, 2 ml/well, and incubated at 37°C in a humidified atmosphere of 5% CO2 in the air. Culture media was changed every 2 days.
Six days later, six wells of two groups (Du145, Du145 + DRG) received 6 Gy γ‐radiation (GC40 Fricke Dosimeter, 0.98 Gy/min). Now there are four groups (Du145, Du145 + DRG, Du145 + 6 Gy, and Du145 + DRG + 6 Gy, each 12 wells). Another 10 days later, six wells of each group cells were recovered from Matrigel by Dispase (BD Biosciences; cat# 354235) and fixed and paraffin embedded for TUNEL assay. The other six wells of each group cells were collected from Matrigel by Dispase for total RNA extraction (two wells/each, DRG was removed). Total RNA was extracted by the High Pure RNA Isolation Kit (Roche; cat# 11828665001) for cDNA microarray. TUNEL assay was carried out by using APOP Tag Peroxidase In‐Situ Apoptosis Detection Kit (Millipore; cat# S7100), according to manufacturer's protocol. For each slide (well), five fields were photographed at ×40 at locations of high apoptotic cell density; total cells and apoptotic cells were counted, and the percentage of apoptotic cells was calculated.
2.15. NPY nerve density in patients that were treated and failed radiation
To confirm if nerves were increased in patients treated with RT and failed, we studied the NPY nerve density in TMA cohort patients that underwent salvage radical prostatectomy after failed RT. Data analysis was performed using the same algorithms previously described in the NPY biomarker study.
2.16. Statistical analysis and model development
We considered multiple measures of NPY or NPY1R calculated by the NuanceTM system, including expression in cancer cells or stromal compartment. We first evaluated the data descriptively and graphically, and attempt to eliminate from further consideration candidates that are highly redundant with each other or with other standard factors. We identified several variables that were statistically significant in univariable analysis and these variable candidates were assessed while we built the multivariable models. We conducted Cox proportional hazard regression or logistic regression modeling of death or related different endpoints and develop multivariable survival models with these marker candidates to determine the association between NPY/NPY1R and outcome, over and above traditional factors. A test of proportional hazards assumption was also performed and indicated that there was no statistically significant evidence of violations. Using functional form analysis and residuals, transformations, and/or grouping of variables were considered to improve the model. Optimal cutoff values for markers were obtained by the minimum p‐value approach. To examine the association with the binary outcome of biochemical recurrence while controlling other factors, we conducted logistic regression analyses. Important standard clinical‐pathological risk factors such as preoperative PSA, Gleason grade, extracapsular extension, seminal vesicle invasion, surgical margins, and lymph node status were considered while the development of final models with and without the chosen biomarker. The overall significance of this model as well as the significance of each marker and/or product of markers (allowing for possible interactions or nonlinearity) were evaluated.
3. RESULTS
3.1. NPY positive nerves changes with age and are increased in the neoplastic process
Peptide‐containing nerves appear in the genital system after birth, stay quiescent during childhood, but reach full development before puberty. 29 To study age‐related changes, we used a TMA of the prostate epithelium of patients without cancer (n = 114). We observed a significant age‐related decrease in NPY positive nerves (p = .017). Levels were highest in patients from the 10–20 year age group (p = .014; Figure 1A). Therefore, our finding suggests that NPY positive nerves are important for prostate homeostasis before the androgen axis is established. No significant differences were identified with leu‐enkephalin or noradrenalin positive nerves.
Figure 1.
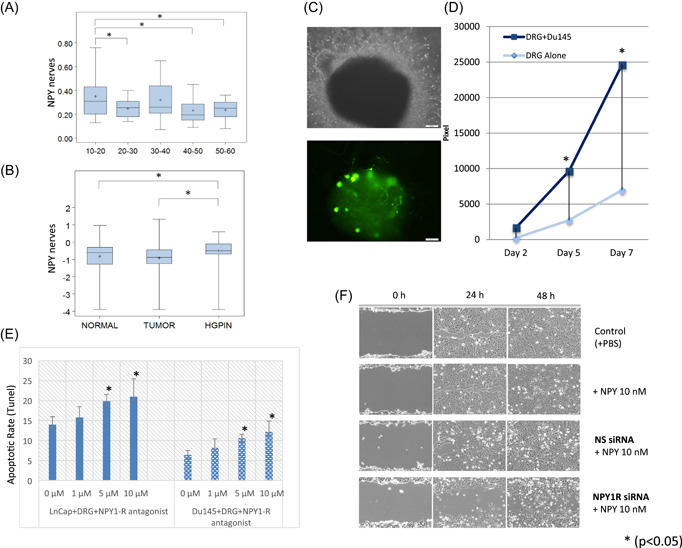
Analysis of nerve subtypes in human PCa tissues. (A) Neuropeptide Y (NPY) nerves density decrease with increasing age (boxplots). (B) NPY nerves are increased in HGPIN versus normal tissue and HGPIN versus cancer (boxplots). (C) The top image is a phase contrast of dorsal root ganglia (DRG) from B6.FVB‐Tg(Npy‐hrGFP)1Lowl/J) in our PNI in vitro model. The bottom image shows the GFP positive NPY neurons and neurites in the same field of view. (D) NPY neurite outgrowth is significantly higher when grown with PCa cells than controls in a time‐dependent fashion. (E) Apoptosis following NPY inhibition with the NPY1R antagonist BIBP‐3226 in both LNCap and DU145 cell PNI cocultures. (F) Wound closure as assessed by the scratch assay following NPY inhibition with NPY1R siRNA. GFP, green fluorescent protein; HGPIN, high‐grade prostatic intraepithelial neoplasia; NPY1R, NPY receptor 1; PBS, phosphate‐buffered saline; PCa, prostate cancer; PNI, perineural invasion; siRNA, small interfering RNA [Color figure can be viewed at wileyonlinelibrary.com]
A second array was used to study nerve subtype associated with cancer. An array with nonneoplastic prostate epithelium, HGPIN, and PCa was then analyzed. More NPY fibers were present in preneoplastic lesions (HGPIN) than in normal tissue (p = .02273; Figure 1B). VIP nerves were increased in HGPIN (p = .00103) and PCa (p = .04680). No significant differences in inducible nitric oxide synthetase or leu‐enkephalin were identified in nerve fibers. Noradrenalin was higher in HGPIN than in PCa (p = .01097). Acetylcholine was ubiquitously expressed in the reactive stroma surrounding cancer rather than being localized exclusively in nerves, and, therefore, could not be quantified.
3.2. PCa induces NPY‐specific axonogenesis
To measure NPY neurite outgrowth in vitro more specifically, we used DRG from B6.FVB‐Tg(Npy‐hrGFP)1Lowl/J) in our PNI in vitro model. These mice express humanized renilla green fluorescent protein (hrGFP) under control of the mouse NPY promoter, hence only neurites expressing NPY are GFP positive. The DRG were cocultured with and without PCa cells. We used standard confocal microscopy and image analysis of NPY–GFP positive neurites (Figure 1C). These studies confirm that cancer cells significantly increase NPY neurite outgrowth, in a time‐dependent fashion (p = .04; Figure 1D).
3.3. Paracrine NPY affects apoptosis and migration of PCa
Initial studies to understand the biology of interactions between NPY nerves and PCa show that NPY inhibition with the NPY1R antagonist BIBP‐3226 in vitro results in a statistically significant concentration dependent increase of both LNCaP and DU145 cell apoptosis ratio (TUNEL assay on paraffin‐embedded tissues; Figure 1E), without significantly altering proliferation. These studies suggest that NPY plays a critical role in cell survival.
NPY1R inhibition also resulted in a decrease in the migration of DU145 and PC3 cells. NPY inhibition with NPY1R siRNA resulted in a delay in wound closure in the scratch assay, suggesting that NPY is also involved in cancer cell migration (Figure 1F).
3.4. Paracrine NPY affects the energetic metabolism of PCa
To examine NPY effects on metabolism, LC/MS analysis was carried out for LNCaP cells transfected with siNPY1R compared to siNS and for LNCaP cells treated with control or the NPY1R antagonist BIBP‐3226. Metabolomics profiles showed robust differences in response to NPY‐specific inhibition (q < 0.2).
We also compared the metabolomic‐level response in NPY‐inhibited LNCaP cells with the transcriptome‐level response in human PCa patients treated with saline solution or with Botox by using collections of pathways and processes compiled in the MSigDB and GO databases. The distribution of the number of significant pathways (p < .05) is shown in Figure 2A. Overall, 13 pathways are shared between the metabolite‐level and the transcriptome‐level profiles, including the tricarboxylic acid (TCA) cycle, which is a key energy‐related pathway, and multiple metabolic processes including lipid metabolic process and cellular lipid metabolic process, and metabolic pathways involved in amino acids and derivatives, amine metabolic processes (Figure 2C; Figure S1). Seventy pathways were commonly enriched between the two metabolite levels. Some of the key metabolites from the TCA cycle pathway affected by siNPY1R are citrate, succinate, malic acid, and glutamine (Figure 2B) responses in LNCaP cells, but not in the transcriptome response to Botox. Of these, 53 were metabolism and catabolism pathways, including purine, pyrimidine, amino sugar, pyruvate, and fructose. The remaining 17 were pathways and processes related to electron transport, cellular respiration, the citric acid TCA cycle, glycolysis and gluconeogenesis, and amino acid synthesis (Figure 2A).
Figure 2.
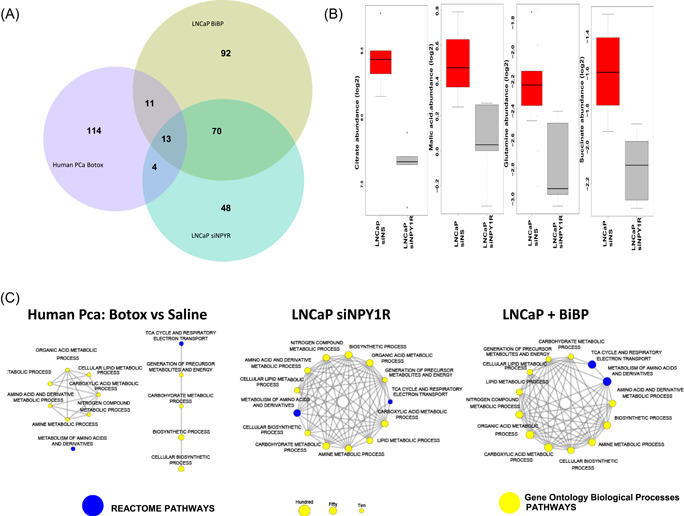
(A) Metabolomic profiles of PCa cells both in vitro and in vivo. Overrepresentation analysis of pathways revealed 13 common pathways between the metabolomic profiles of LNCaP PCa cells treated with either Botox or siNPY1R and the transcriptomic profiles of patients with PCa treated with Botox versus saline solution (p < .05, at least five genes per enriched pathway). (B) Treatment of human NCaP PCa cells with siNPY1R leads to a robust reduction of TCA cycle metabolites such as citrate, malic acid, glutamine, and succinate, compared to transfection with siNS (q < 0.2). (C) Common enriched pathways in human PCa cancer cells treated with Botox and in in vitro NPY1R knock out and chemical inhibition with BIBP‐3226. NPY, neuropeptide Y; NPY1R, NPY receptor 1; PCa, prostate cancer; TCA, tricarboxylic acid [Color figure can be viewed at wileyonlinelibrary.com]
3.5. Botox specifically inhibits NPY
Botox effects on acetylcholine are well demonstrated. However, previous publications have shown that Botox also inhibits NPY, as it cohabitates with acetylcholine. 30 To corroborate that Botox specifically, but not exclusively, inhibits NPY in cancer, we measured the levels of NPY after Botox treatment in the PNI in vitro model, in which PCa cell lines are cocultured with DRG cells. NPY was significantly reduced in the supernatant and the lysate of both DU145 and LNCaP cell PNI co‐cultures, demonstrating that Botox inhibits NPY release in this model (Figure 3A).
Figure 3.
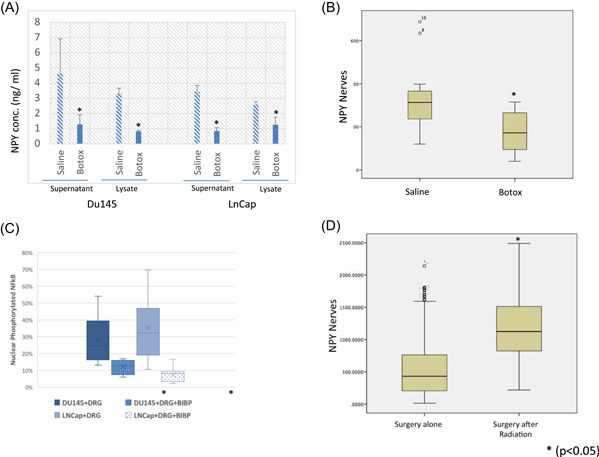
(A) NPY levels both in the supernatant and the lysate of both DU145 and LNCaP cell PNI cocultures following Botox treatment. (B) NPY nerves are decreased significantly in the human prostate Botox treated side versus saline control. (C) Levels of phosphorylated nuclear NF‐κB decrease with the use of an NPY1R antagonist. (D) NPY positive nerve density was significantly increased in patients that were treated and failed radiation therapy versus controls. DRG, dorsal root ganglia; NF‐κB, nuclear factor‐κB; NPY, neuropeptide Y; NPY1R, NPY receptor 1; PNI, perineural invasion [Color figure can be viewed at wileyonlinelibrary.com]
We also examined the NPY nerve density in tissues derived from a previously published human neoadjuvant Botox denervation clinical trial to determine NPY‐specific effect. In this study, Botox was injected as a denervation agent into one side of a bilateral tumor, while the other side received saline as a control. We identified a significant decrease NPY positive nerve density in the areas of the prostate treated by Botox as compared to the saline control side (p = .000; Figure 3B), corroborating the in vitro data in human studies.
3.6. NF‐κB is a potential NPY downstream mediator
NF‐κB is a mediator of homeostasis and metabolic adaptation. 31 Treatment with the NPY1R chemical inhibitor BIBP‐3226 resulted in a decrease in the number of cells with nuclear translocation of the pNF‐κB in both cell lines studied, resulting in inhibition of such pathway. In LNCaP cells, we found a decrease from 28% to 12% with BIBP‐3226 treatment (p = .000). More marked results were seen with Du145 cells (37% vs. 7%; p = .004; Figure 3C). Levels of phosphorylated nuclear NF‐κB decrease with the use of an NPY1R antagonist. These data suggest that NF‐κB is a potential mediator of the NPY regulation of PCa energetic metabolism.
3.7. Radiation‐induced apoptosis is reduced when PCa cells are cocultured with DRG/nerve cocultures
Baseline Du145 cells had 3.1% of cells in apoptosis. Irradiation of Du145 cells increased the apoptotic ratio over threefold to 10.492%. The presence of DRG in the irradiated model decreased the apoptotic ratio back down to 6.47% (p = .0005). This data suggest that the presence of DRG/nerve provides protection to PCa cells against radiation.
3.8. NPY positive nerves are increased in the prostates of patients that received RT and failed
NPY positive nerve density was significantly increased in patients that were treated and failed RT versus controls treated only with radical prostatectomy (n = 121, NPY area = 536 vs. n = 414, NPY area = 1191; p = .002; Figure 3D).
3.9. NPY is a biomarker for aggressive PCa
Human studies done on a cohort of PCa patients with long‐term follow‐up indicate that NPY is a significant driver of PCa aggressiveness. Immunohistochemical staining was performed to localize and quantify NPY nerve density, as well as NPY and NPY1R expression in the cancer cells. Elevated levels of NPY1R in the cancer cells were predictive of PCa‐specific death (hazard ratio [HR] = 4.098 [1.187, 14.147], p = .0257; Figure 4A). Elevated levels of NPY in the PCa cells were independently predictive of biochemical recurrence (HR = 0.603 (0.366, 0.994), p = .0475; Figure 4B). The most predictive information was found for NPY nerve density, where the number of nerves was independently predictive of both biochemical recurrence (HR = 1.838 [1.045, 3.232], p = .0347; Figure 4C) and PCa‐specific death (HR = 5.331 [1.414, 20.107], p = .0135; Figure 4D; Figure S2). A patient with high NPY nerve count has approximately a five times greater risk of dying of PCa. The performance in various models is summarized in Figure S2. As validation, in the Pound cohort, nerve density was independently predictive of PCa‐specific death (HR = 1.734 [1.166, 2.2577], p = .00065), when considering the usual clinic‐pathologic variables (Figure 4E; Figure S2). The main focus of these studies is to find the “association” between our NPY marker and time to event (or probability of event) based on a particular cohort. Future clinical validation will require cross‐validation to evaluate the prediction accuracy.
Figure 4.
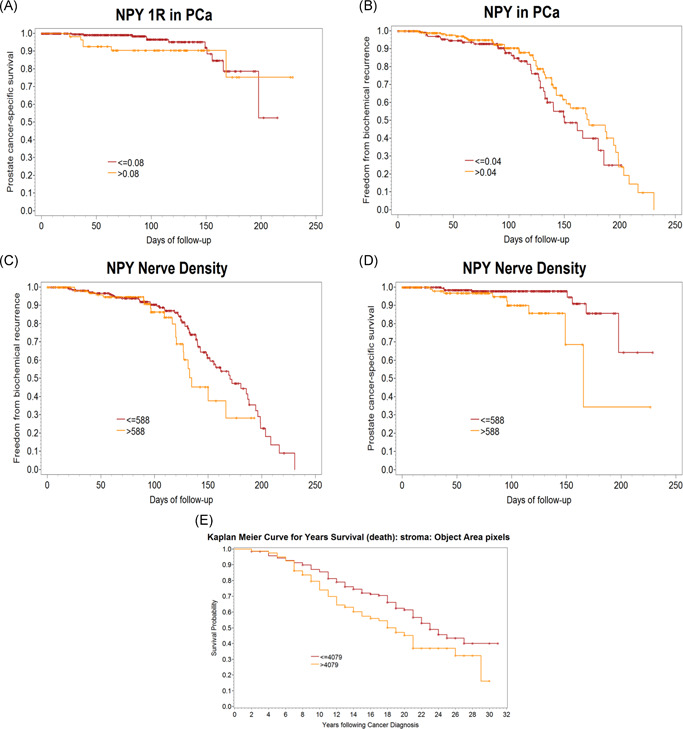
Human studies to identify the predictive value of NPY and NPY1R expression in PCa cells and NPY nerve density. Slides were double stained, imaged with deconvolution, and segmented using computerized analysis. These markers were incorporated into current clinical models of care. (A) Elevated levels of NPY1R in PCa cells were predictive of PCa‐specific death (HR = 4.098 [1.187, 14.147], p = .0257). (B) Elevated levels of NPY in PCa cells were independently predictive of biochemical recurrence (HR = 0.603 [0.366, 0.994], p = .0475). Nerve density was independently predictive of both (C) biochemical recurrence (HR = 1.838 [1.045, 3.232], p = .0347) and (D) PCa‐specific death (HR = 5.331 [1.414, 20.107], p = .0135). (E) Validation studies in the Pound cohort, where nerve density was independently predictive of PCa‐specific death. HR, hazard ratio; NPY, neuropeptide Y; NPY1R, NPY receptor 1; PCa, prostate cancer [Color figure can be viewed at wileyonlinelibrary.com]
4. CONCLUSION
The influence of nerves in cancer is a field of growing interest. Several articles have been published lately that have increased awareness. 1 , 2 , 9 , 10 Science has also published an editorial on nerves and cancer, highlighting the importance of the growing field (https://www.sciencemag.org/news/2019/09/how-body-s-nerves-become-accomplices-spread-cancer).
There is ample data in the literature that support that NPY is critical to many tumor types. NPY acts through five G‐protein‐coupled receptors. Breast, adrenal gland, renal cell, and ovarian cancers expressed Y1 and Y2 receptors. 23 , 32 , 33 Breast cancer has a proliferative effect, mediated by NPY 5R. 34 The same receptor acts as a survival factor for neuroblastoma cells. 26
NPY and NPY1R are aberrantly overexpressed in PCa. 35 Signaling activation is through mitogen‐activated protein kinase/extracellular signal‐regulated kinase 1/2 phosphorylation, 25,25 reduction of cyclic adenosine monophosphate (cAMP) accumulation, and an increase of calcium and potassium channels. 23 , 36 VCaP and DUCaP cells express high levels of NPY, while Du145 and PC‐3 have low levels. LNCaP cells do not express NPY. 22 , 35 All PCa cell lines expressed NPY1R.
Our data show that NPY nerves regulate several processes associated with PCa aggressiveness. Cancer induces NPY nerve growth and this increase correlates with aggressive tumor behavior. NPY1R inhibition results in increased apoptosis and decreased motility. In addition, NPY regulates the energetic metabolism of cancer cells. These effects show the importance that paracrine NPY has on PCa biology and progression.
We used archival tissues from a published human neoadjuvant denervation clinical trial using Botox to corroborate the significance of NPY in human PCa. 1 A comparison of the transcriptomic changes in human tissues with metabolomic changes of NPY in vitro inhibition identified 13 common pathways. These were related to energetic metabolism. Botox affects acetylcholine, but it also induces inhibition of NPY vesicle docking and release. 30 , 37 Our studies confirm that Botox reduces NPY levels in vitro. NPY nerve density was also reduced in the human study after Botox treatment. Therefore, neurotoxins such as Botox represent a promising therapeutic approaches for PCa treatment.
Apoptosis of PCa cells in PNI is regulated through an NF‐κB mechanism. 12 There is activation (nuclear translocation) of NF‐κB and activation of downstream targets PIM‐2 and DAD‐1. 12 NF‐κB organizes energy metabolism by controlling the balance between glycolysis and mitochondrial respiration. 31 NF‐κB inhibition causes cellular reprogramming to aerobic glycolysis under basal conditions and induces necrosis on glucose starvation. 31 Our studies show that NPY inhibition results in inactivation of NF‐κB, through cytoplasmic entrapment of pNF‐κB. It is likely that the NPY regulation of energetic metabolism observed in our studies requires NF‐κB. Further studies will address downstream mechanisms.
NPY and NPY1R expression within the cancer cell strongly correlate with TMPRSS2–ERG fusion. 38 A meta‐analysis of gene expression data from ERG + PCa tumors show NPY upregulation in these patients. NPY–ERG‐associated expression induces metabolic changes, such as increased glucose uptake in PCa cells. 39 We hypothesize that ERG + tumors become less dependent on paracrine NPY nerves, due to NPY autocrine activation. 39 In fact, our data confirm that there is a strong correlation between ERG rearrangements and NPY expression in PCa cells. However, the paracrine nerve‐derived NPY loop seems to be more important. Elevated levels of NPY positive nerves were predictive of PCa‐specific death. PCa‐produced NPY was only predictive of biochemical recurrence (Figure 5).
Figure 5.
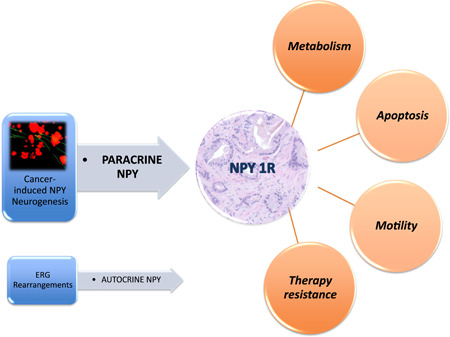
Paracrine NPY axis and its effects on cancer cell metabolism, apoptosis, motility, and therapy resistance. The autocrine expression is tied to ERG rearrangements. NPY, neuropeptide Y; NPY1R, NPY receptor 1 [Color figure can be viewed at wileyonlinelibrary.com]
Previous publications show the NPY is a biomarker for multiple cancer types. 25 Elevated systemic NPY levels correlate with adverse tumor phenotype in Ewing's sarcoma and neuroblastoma. 27 , 40 There are associations of elevated plasma NPY with metastasis in pheochromocytoma. 41 , 42 An increase in NPY expression in tissues is an early event in PCa development. 43 Our studies confirm that NPY is associated with increased PCa aggressiveness. It has the potential to become a clinically useful biomarker for PCa, with a solid biologic rationale.
Confined PCa is currently mostly treated with either surgery or RT. Both have a high risk of biochemical recurrence in high‐risk patients. 44 Previous literature has shown relationships between NPY positive nerves and radiation/chemotherapy. There is an increase in the density of NPY‐immunoreactive nerves in the irradiated bladders. 45 Y5R expression was observed in tissues from chemotherapy‐treated neuroblastoma tumors. 26 Lack of normalization of systemic NPY levels after treatment predicts neuroblastoma relapse. 46 , 47 , 48 Our studies confirm that NPY is elevated in PCa patients treated with radiation and that have failed therapy. They also confirm that nerves might provide protection against radiation‐induced apoptosis. While RT induces DNA damage and cell death, it also induces NPY positive nerve growth. This results in worse clinical outcomes through enhanced resistance due to the effects of NPY on PCa cells. It is likely that future strategies to improve the outcome of RT for PCa might include modulation of the NPY neural microenvironment. While Botox is a potential candidate, new and more specific therapies need to be developed.
There are multiple interactions between neurotransmitters in PCa. NPY is a sympathetic cotransmitter and vasoconstrictor. NPY's mitogenic responses require the upregulation of the Y1 receptor. The upregulation happens through NPY itself, or through beta‐adrenergic cAMP‐dependent activation. 49 It is possible that the effects of the adrenergic pathway on PCa are through the activation of NPY1R, and, hence, the NPY‐associated pathways. NPY and testosterone also interact. 50 Therefore, combination therapies with antiandrogens need to be explored. Future studies will address these issues.
We present that NPY‐specific nerves are increased in cancer and their quantification is independently predictive of PCa‐specific death. NPY is a key regulator of energy metabolism in PCa cells. Hence, targeting the NPY neural microenvironment may represent a therapeutic approach for treating cancer by exogenously targeting the regulators of cancer‐associated metabolic pathways, particularly in association with RT. This study not only reiterates the significance of our previous publications but also emphasizes that the effect of nerves on cancer cells is mediated by multiple mechanisms and pathways. We submit that this study represents a major advancement in the field, and will have immediate translational and clinical implications.
In conclusion, the NPY neural axis is a major pathway of homeostasis in PCa. It is a major mechanism that regulates cancer cell survival, metabolism, and therapy resistance. The NPY axis is critical for cancer regulation. Finally, NPY is upregulated with increasing stress. Therefore, the effects of NPY might be the result of direct local NPY nerves, and unexpected consequences of cancer‐induced stress. 27
CONFLICT OF INTERESTS
The authors declare that there are no conflict of interests.
AUTHOR CONTRIBUTIONS
Chad J. Creighton contributed to the bioinformatics analysis, discussion, and writing of the manuscript. Christian Coarfa and Arun Sreekumar contributed to the metabolomics study design and performance, discussion, and writing of the manuscript. Yi Ding contributed the microarray experiment of mice, and humans, the in vitro experiments, discussion, and writing of the manuscript. Brian Miles contributed in the design and discussion and writing of the manuscript. Gustavo Ayala contributed the idea and hypothesis, conception, and design of the study, development of the experimental mouse models, collection, analysis, and interpretation of data, drafting of the manuscript, obtaining funding, and study supervision and coordination.
Supporting information
Supporting information.
Supporting information.
Supporting information.
ACKNOWLEDGMENTS
This study was supported by National Institutes of Health Grant RO1 CA140734‐03 (Gustavo Ayala); TMEN U54CA126568‐01 (Gustavo Ayala), RO1CA133458 (Arun Sreekumar), RP120092 (Arun Sreekumar), U01 CA167234 (Arun Sreekumar), and a PCa Foundation Creativity Award (Gustavo Ayala).
Ding Y, Lee MJ, Gao Y, et al. Neuropeptide Y nerve paracrine regulation of prostate cancer oncogenesis and therapy resistance. The Prostate. 2021;81:58‐71. 10.1002/pros.24081
DATA AVAILABILITY STATEMENT
Correspondence and requests for materials should be addressed to Gustavo Ayala (Email: Gustavo.E.Ayala@uth.tmc.edu).
REFERENCES
- 1. Coarfa C, Florentin D, Putluri N, et al. Influence of the neural microenvironment on prostate cancer. Prostate. 2018;78(2):128‐139. 10.1002/pros.23454 [DOI] [PMC free article] [PubMed] [Google Scholar]
- 2. Chen D, Ayala GE. Innervating prostate cancer. N Engl J Med. 2018;378(7):675‐677. 10.1056/NEJMcibr1714003 [DOI] [PubMed] [Google Scholar]
- 3. Zhao CM, Hayakawa Y, Kodama Y, et al. Denervation suppresses gastric tumorigenesis. Sci Transl Med. 2014;6(250):250ra115 10.1126/scitranslmed.3009569 [DOI] [PMC free article] [PubMed] [Google Scholar]
- 4. Frisbie JH. Cancer of the prostate in myelopathy patients: lower risk with higher levels of paralysis. J Spinal Cord Med. 2001;24(2):92‐94. [DOI] [PubMed] [Google Scholar]
- 5. Frisbie JH, Binard J. Low prevalence of prostatic cancer among myelopathy patients. J Am Paraplegia Soc. 1994;17(3):148‐149. [DOI] [PubMed] [Google Scholar]
- 6. Ayala GE, Dai H, Powell M, et al. Cancer‐related axonogenesis and neurogenesis in prostate cancer. Clin Cancer Res. 2008;14(23):7593‐7603. 10.1158/1078-0432.CCR-08-1164 [DOI] [PubMed] [Google Scholar]
- 7. Olar A, He D, Florentin D, Ding Y, Ayala G. Biologic correlates and significance of axonogenesis in prostate cancer. Hum Pathol. 2014;45(7):1358‐1364. 10.1016/j.humpath.2014.02.009 [DOI] [PMC free article] [PubMed] [Google Scholar]
- 8. Ding Y, He D, Florentin D, et al. Semaphorin 4F as a critical regulator of neuroepithelial interactions and a biomarker of aggressive prostate cancer. Clin Cancer Res. 2013;19(22):6101‐6111. 10.1158/1078-0432.CCR-12-3669 [DOI] [PMC free article] [PubMed] [Google Scholar]
- 9. American Association for Cancer Research . CNS‐derived neural progenitors mediate neurogenesis in prostate cancer. Cancer Discov. 2019. 10.1158/2159-8290.CD-RW2019-079 [DOI] [Google Scholar]
- 10. Mauffrey P, Tchitchek N, Barroca V, et al. Progenitors from the central nervous system drive neurogenesis in cancer. Nature. 2019;569(7758):672‐678. 10.1038/s41586-019-1219-y [DOI] [PubMed] [Google Scholar]
- 11. Ayala GE, Dai H, Li R, et al. Bystin in perineural invasion of prostate cancer. Prostate. 2006;66(3):266‐272. 10.1002/pros.20323 [DOI] [PubMed] [Google Scholar]
- 12. Ayala GE, Dai H, Ittmann M, et al. Growth and survival mechanisms associated with perineural invasion in prostate cancer. Cancer Res. 2004;64(17):6082‐6090. 10.1158/0008-5472.CAN-04-0838 [DOI] [PubMed] [Google Scholar]
- 13. Ayala GE, Wheeler TM, Shine HD, et al. In vitro dorsal root ganglia and human prostate cell line interaction: redefining perineural invasion in prostate cancer. Prostate. 2001;49(3):213‐223. [DOI] [PubMed] [Google Scholar]
- 14. Ayala GE, Dai H, Tahir SA, et al. Stromal antiapoptotic paracrine loop in perineural invasion of prostatic carcinoma. Cancer Res. 2006;66(10):5159‐5164. 10.1158/0008-5472.CAN-05-1847 [DOI] [PubMed] [Google Scholar]
- 15. Albo D, Akay CL, Marshall CL, et al. Neurogenesis in colorectal cancer is a marker of aggressive tumor behavior and poor outcomes. Cancer. 2011;117:4834‐4845. 10.1002/cncr.26117 [DOI] [PubMed] [Google Scholar]
- 16. Liebig C, Ayala G, Wilks JA, Berger DH, Albo D. Perineural invasion in cancer: a review of the literature. Cancer. 2009;115(15):3379‐3391. 10.1002/cncr.24396 [DOI] [PubMed] [Google Scholar]
- 17. Dai H, Li R, Wheeler T, et al. Enhanced survival in perineural invasion of pancreatic cancer: an in vitro approach. Hum Pathol. 2007;38(2):299‐307. 10.1016/j.humpath.2006.08.002 [DOI] [PubMed] [Google Scholar]
- 18. Liebig C, Ayala G, Wilks J, et al. Perineural invasion is an independent predictor of outcome in colorectal cancer. J Clin Oncol. 2009;27(31):5131‐5137. 10.1200/JCO.2009.22.4949 [DOI] [PMC free article] [PubMed] [Google Scholar]
- 19. Magnon C, Hall SJ, Lin J, et al. Autonomic nerve development contributes to prostate cancer progression. Science. 2013;341(6142):1236361 10.1126/science.1236361 [DOI] [PubMed] [Google Scholar]
- 20. Hayakawa Y, Sakitani K, Konishi M, et al. Nerve growth factor promotes gastric tumorigenesis through aberrant cholinergic signaling. Cancer Cell. 2017;31(1):21‐34. 10.1016/j.ccell.2016.11.005 [DOI] [PMC free article] [PubMed] [Google Scholar]
- 21. Adrian TE, Gu J, Allen JM, Tatemoto K, Polak JM, Bloom SR. Neuropeptide Y in the human male genital tract. Life Sci. 1984;35(26):2643‐2648. [DOI] [PubMed] [Google Scholar]
- 22. Ruscica M, Dozio E, Boghossian S, et al. Activation of the Y1 receptor by neuropeptide Y regulates the growth of prostate cancer cells. Endocrinology. 2006;147(3):1466‐1473. 10.1210/en.2005-0925 [DOI] [PubMed] [Google Scholar]
- 23. Ruscica M, Dozio E, Motta M, Magni P. Relevance of the neuropeptide Y system in the biology of cancer progression. Curr Top Med Chem. 2007;7(17):1682‐1691. [DOI] [PubMed] [Google Scholar]
- 24. Ruscica M, Dozio E, Motta M, Magni P. Role of neuropeptide Y and its receptors in the progression of endocrine‐related cancer. Peptides. 2007;28(2):426‐434. 10.1016/j.peptides.2006.08.045 [DOI] [PubMed] [Google Scholar]
- 25. Ruscica M, Dozio E, Motta M, Magni P. Modulatory actions of neuropeptide Y on prostate cancer growth: role of MAP kinase/ERK 1/2 activation. Adv Exp Med Biol. 2007;604:96‐100. [DOI] [PubMed] [Google Scholar]
- 26. Czarnecka M, Trinh E, Lu C, et al. Neuropeptide Y receptor Y5 as an inducible pro‐survival factor in neuroblastoma: implications for tumor chemoresistance. Oncogene. 2015;34(24):3131‐3143. 10.1038/onc.2014.253 [DOI] [PMC free article] [PubMed] [Google Scholar]
- 27. Tilan J, Kitlinska J. Neuropeptide Y (NPY) in tumor growth and progression: lessons learned from pediatric oncology. Neuropeptides. 2016;55:55‐66. 10.1016/j.npep.2015.10.005 [DOI] [PMC free article] [PubMed] [Google Scholar]
- 28. Hong SH, Tilan JU, Galli S, et al. High neuropeptide Y release associates with Ewing sarcoma bone dissemination—in vivo model of site‐specific metastases. Oncotarget. 2015;6(9):7151‐7165. 10.18632/oncotarget.3345 [DOI] [PMC free article] [PubMed] [Google Scholar]
- 29. Properzi G, Cordeschi G, Francavilla S. Postnatal development and distribution of peptide‐containing nerves in the genital system of the male rat. An immunohistochemical study. Histochemistry. 1992;97(1):61‐68. [DOI] [PubMed] [Google Scholar]
- 30. Royal MA. Botulinum toxins in pain management. Phys Med Rehabil Clin N Am. 2003;14(4):805‐820. [DOI] [PubMed] [Google Scholar]
- 31. Mauro C, Leow SC, Anso E, et al. NF‐kappaB controls energy homeostasis and metabolic adaptation by upregulating mitochondrial respiration. Nat Cell Biol. 2011;13(10):1272‐1279. 10.1038/ncb2324 [DOI] [PMC free article] [PubMed] [Google Scholar]
- 32. Korner M, Reubi JC. NPY receptors in human cancer: a review of current knowledge. Peptides. 2007;28(2):419‐425. 10.1016/j.peptides.2006.08.037 [DOI] [PubMed] [Google Scholar]
- 33. Nagakawa O, Ogasawara M, Murata J, Fuse H, Saiki I. Effect of prostatic neuropeptides on migration of prostate cancer cell lines. Int J Urol. 2001;8(2):65‐70. [DOI] [PubMed] [Google Scholar]
- 34. Medeiros PJ, Al‐Khazraji BK, Novielli NM, Postovit LM, Chambers AF, Jackson DN. Neuropeptide Y stimulates proliferation and migration in the 4T1 breast cancer cell line. Int J Cancer. 2012;131(2):276‐286. 10.1002/ijc.26350 [DOI] [PubMed] [Google Scholar]
- 35. Magni P, Motta M. Expression of neuropeptide Y receptors in human prostate cancer cells. Ann Oncol. 2001;12:27‐29. [DOI] [PubMed] [Google Scholar]
- 36. Nagakawa O, Ogasawara M, Fujii H, et al. Effect of prostatic neuropeptides on invasion and migration of PC‐3 prostate cancer cells. Cancer Lett. 1998;133(1):27‐33. [DOI] [PubMed] [Google Scholar]
- 37. Hohne‐Zell B, Galler A, Schepp W, Gratzl M, Prinz C. Functional importance of synaptobrevin and SNAP‐25 during exocytosis of histamine by rat gastric enterochromaffin‐like cells. Endocrinology. 1997;138(12):5518‐5526. 10.1210/endo.138.12.5615 [DOI] [PubMed] [Google Scholar]
- 38. Ueda K, Tatsuguchi A, Saichi N, et al. Plasma low‐molecular‐weight proteome profiling identified neuropeptide‐Y as a prostate cancer biomarker polypeptide. J Proteome Res. 2013;12(10):4497‐4506. 10.1021/pr400547s [DOI] [PubMed] [Google Scholar]
- 39. Massoner P, Kugler KG, Unterberger K, et al. Characterization of transcriptional changes in ERG rearrangement‐positive prostate cancer identifies the regulation of metabolic sensors such as neuropeptide Y. PLoS One. 2013;8(2):e55207 10.1371/journal.pone.0055207 [DOI] [PMC free article] [PubMed] [Google Scholar]
- 40. Tilan JU, Lu C, Galli S, et al. Hypoxia shifts activity of neuropeptide Y in Ewing sarcoma from growth‐inhibitory to growth‐promoting effects. Oncotarget. 2013;4(12):2487‐2501. 10.18632/oncotarget.1604 [DOI] [PMC free article] [PubMed] [Google Scholar]
- 41. Kogner P, Theodorsson E, Bjork O. Plasma neuropeptide Y (NPY): a novel marker of neuroblastoma. Prog Clin Biol Res. 1991;366:367‐373. [PubMed] [Google Scholar]
- 42. Tabarin A, Cassiede P, Minot AP, Cuber JC, Roger P, Ducassou D. Heterogeneity of neuropeptide Y immunoreactivity in patients with pheochromocytoma: influence on the diagnostic power of measuring plasma NPY using antisera with different specificities. Acta Endocrinol. 1993;128(3):243‐250. [DOI] [PubMed] [Google Scholar]
- 43. Rasiah KK. Aberrant neuropeptide Y and macrophage inhibitory cytokine‐1 expression are early events in prostate cancer development and are associated with poor prognosis. Cancer Epidemiol Biomarkers Prev. 2006;15(4):711‐716. 10.1158/1055-9965.EPI-05-0752 [DOI] [PubMed] [Google Scholar]
- 44. Zaorsky NG, Shaikh T, Murphy CT, et al. Comparison of outcomes and toxicities among radiation therapy treatment options for prostate cancer. Cancer Treat Rev. 2016;48:50‐60. 10.1016/j.ctrv.2016.06.006 [DOI] [PMC free article] [PubMed] [Google Scholar]
- 45. Crowe R, Vale J, Trott KR, Soediono P, Robson T, Burnstock G. Radiation‐induced changes in neuropeptides in the rat urinary bladder. J Urol. 1996;156(6):2062‐2066. [PubMed] [Google Scholar]
- 46. Dotsch J, Christiansen H, Hanze J, Lampert F, Rascher W. Plasma neuropeptide Y of children with neuroblastoma in relation to stage, age and prognosis, and tissue neuropeptide Y. Regul Pept. 1998;75‐76:185‐90. [DOI] [PubMed] [Google Scholar]
- 47. Nowicki M, Ostalska‐Nowicka D, Miskowiak B. Prognostic value of stage IV neuroblastoma metastatic immunophenotype in the bone marrow: preliminary report. J Clin Pathol. 2006;59(2):150‐152. 10.1136/jcp.2004.024687 [DOI] [PMC free article] [PubMed] [Google Scholar]
- 48. Rascher W, Kremens B, Wagner S, Feth F, Hunneman DH, Lang RE. Serial measurements of neuropeptide Y in plasma for monitoring neuroblastoma in children. J Pediatr. 1993;122(6):914‐916. [DOI] [PubMed] [Google Scholar]
- 49. Pons J, Kitlinska J, Ji H, Lee EW, Zukowska Z. Mitogenic actions of neuropeptide Y in vascular smooth muscle cells: synergetic interactions with the beta‐adrenergic system. Can J Physiol Pharmacol. 2003;81(2):177‐185. 10.1139/y02-166 [DOI] [PubMed] [Google Scholar]
- 50. Sahu A, Phelps CP, White JD, Crowley WR, Kalra SP, Kalra PS. Steroidal regulation of hypothalamic neuropeptide Y release and gene expression. Endocrinology. 1992;130(6):3331‐3336. 10.1210/endo.130.6.1375900 [DOI] [PubMed] [Google Scholar]
Associated Data
This section collects any data citations, data availability statements, or supplementary materials included in this article.
Supplementary Materials
Supporting information.
Supporting information.
Supporting information.
Data Availability Statement
Correspondence and requests for materials should be addressed to Gustavo Ayala (Email: Gustavo.E.Ayala@uth.tmc.edu).