

ABSTRACT
Aims
Cardiac specificity provides an advantage in correlating heart failure (HF) biomarker plasma levels with indices of cardiac function and remodelling, as shown for natriuretic peptides. Using bioinformatics, we explored the cardiac specificity of secreted proteins and investigated in more detail the relationship of Dickkopf‐3 (DKK3) gene expression and DKK3 plasma concentrations with cardiac function and remodelling in (pre)clinical studies.
Methods and results
The cardiac specificity of secreted proteins was determined using RNAseq data for a large panel of organs and tissues. This showed that natriuretic peptides (NPPA and NPPB) are highly cardiac‐specific (>99%), whereas other HF biomarkers, including galectin‐3 (Gal‐3, LGALS3) and growth differentiation factor‐15 (GDF‐15), lack cardiac specificity (<4%). DKK3 was cardiac‐enriched (44%), warranting further investigation. In three different HF mouse models, cardiac Dkk3 expression was altered, but DKK3 plasma concentrations were not. In humans, DKK3 plasma concentrations were higher in HF patients (n = 2090) in comparison with age‐ and sex‐matched controls without HF (n = 240) (46.4 ng/mL vs. 36.3 ng/mL; P < 0.001). Multivariate regression analysis revealed that DKK3 was strongly associated with HF risk factors and comorbidities, including age, kidney function and atrial fibrillation. After correction for existing prediction models, DKK3 did not independently predict HF outcome [all‐cause mortality/HF hospitalization, hazard ratio 1.13 (0.79–1.61) per DKK3 doubling; P = 0.503].
Conclusions
Of actively secreted HF biomarkers, only natriuretic peptides showed high cardiac specificity. Despite a cardiac specificity of 44%, secreted DKK3 had limited additional diagnostic and prognostic value.
Keywords: Heart failure, Biomarker, DKK3, Natriuretic peptides, Cardiac specificity
Introduction
Nowadays, natriuretic peptides as plasma biomarkers are indispensable in the diagnosis and treatment of heart failure (HF), and are included in European and American HF treatment guidelines. 1 , 2 , 3 The success of natriuretic peptides, which are actively released from the heart upon myocardial stretch, is predominantly explained by their cardiac specificity. 3 , 4 , 5 , 6 , 7 This also applies to cardiac‐specific troponins, which are released from the heart by passive leakage upon myocardial damage. 1 , 2 , 8 However, these biomarkers provide information only on myocardial stretch and myocardial damage. New biomarkers could potentially provide additional insight into ongoing cardiac remodelling processes and may improve diagnosis and patient stratification.
Recently, we argued that, in the context of relating circulating concentrations to cardiac remodelling and function, cardiac specificity is one of the most important characteristics of a cardiac biomarker. 4 , 9 Using several HF animal models, we showed that a lack of cardiac specificity is likely to be an important reason why many emerging HF biomarkers, including galectin‐3 (Gal‐3) and growth differentiation factor‐15 (GDF‐15), have relatively limited clinical value. 4 , 9 Thus, for the identification of possible novel HF biomarkers that provide information on cardiac remodelling and/or function, cardiac specificity seems indispensable. This idea is further illustrated by established plasma biomarkers used in other fields, which often show high organ specificity, such as prostate‐specific antigen (PSA) for prostate cancer, alanine aminotransferase (ALAT) for liver disease, and pancreas‐specific amylase and lipase for pancreas disease. 10 , 11 , 12
Thus, in the search for novel HF biomarkers, selecting for cardiac specificity seems, amongst other factors, a relevant step. In line with our recently proposed approach in HF biomarker studies, 4 we embarked on a search for novel cardiac‐specific biomarkers by performing an extensive bioinformatics analysis based on RNAseq data for a large panel of organs and tissues. 13 Two possible candidates were identified and molecular assays were available to perform further analyses on one of them, namely Dickkopf‐3 (DKK3), for which previous studies suggested an attenuating effect on cardiac remodelling. 14 , 15 , 16 , 17 , 18 Expression levels of DKK3 were determined in three different HF mouse models and in plasma samples from HF patients.
Methods
Ethics statement
The animal experimental protocols were approved by the Animal Ethical Committee of the University of Groningen (AVD105002016487, DEC6827A, DEC6920A and IVD16487‐03‐001) and conducted according to the existing guidelines for the care and use of laboratory animals. This study was performed according to the Declaration of Helsinki. Informed consent was obtained from all human participants.
Bioinformatics
To determine the cardiac specificity of genes, several databases were combined. For gene expression of organs and tissues in healthy humans, RNAseq data as published by Fagerberg et al. 13 were used. Included organs and tissues are listed in online supplementary Appendix S1 (Methods). Cardiac specificity of genes was calculated as follows: cardiac specificity (%) = (cardiac expression counts/expression counts in all organs) × 100.
Expression counts are the RNAseq counts of each gene. To determine whether genes encode for secreted proteins, databases from proteinatlas.org were consulted. Analyses were performed for males and females separately. For a selection of genes, raw data and calculations are shown in online supplementary Table S1 .
Animal studies
Three mouse models were included: (i) a myocardial infarction (MI) model; (ii) a transverse aortic constriction (TAC) model, and (iii) an obesity/hypertension model. The animal experimental protocols have been described in detail previoulsy 9 , 19 and are summarized in online supplementary Appendix S1 (Methods).
Real‐time quantitative polymerase chain reaction
Gene expression was determined by real‐time quantitative polymerase chain reaction (RT‐qPCR) in total RNA extracted from mouse tissues. The full procedure is described in online supplementary Appendix S1 (Methods). Oligonucleotide sequences are listed in online supplementary Table S2 .
ELISA
Mouse DKK3 plasma concentrations were measured using mouse DKK3 enzyme‐linked immunosorbent assay (ELISA) kits (OKCD02498‐96; Aviva Systems Biology Corp., San Diego, CA, USA). Mouse NT‐proANP plasma concentrations as measured by NT‐proANP ELISA kits (BI‐20892; Biomedica Medizinprodukte GmbH, Vienna, Austria) have been reported previously 9 and are presented here for convenience. Human DKK3 plasma concentrations were measured using human DKK3 ELISA kits (DY1118; R&D Systems, Inc., Minneapolis, MN, USA). For the DKK3 ELISAs, quality control and materials are described in online supplementary Appendix S1 (Methods).
Human heart failure cohort
DKK3 plasma concentrations were measured in 2090 patients with HF. This cohort has been described in detail elsewhere. 20 All patients were aged >18 years and had evidence of HF [left ventricular ejection fraction (LVEF) <40%, or plasma concentrations of BNP >400 pg/mL or NT‐proBNP >2000 pg/mL]. Plasma samples were collected at baseline and stored at −80°C until analysis. Patients were followed for a median of 21 months and endpoints were registered, including the primary endpoint (HF hospitalization and all‐cause mortality), all‐cause mortality and cardiovascular mortality.
Age‐ and sex‐matched control group
To compare plasma DKK3 concentrations between HF patients and controls, an age‐ and sex‐matched control group of subjects without HF was composed from a large population cohort. This cohort has been described in detail elsewhere 21 and is reported in brief, along with the protocol used to select it, in online supplementary Appendix S1 (Methods). Plasma samples were collected at baseline and stored at −80 °C until analysis.
Statistical analysis
The homogeneity of variance and normality of data were analysed using Levene's test for homogeneity of variance, and Kolmogorov–Smirnov tests combined with QQ‐plots, respectively. Animal data are presented as the mean ± standard error of the mean (SEM). For human data, normally distributed variables are presented as the mean ± standard deviation (SD), non‐normally distributed variables as the median [interquartile range (IQR)] and categorical variables as n (%). Differences between two groups were analysed using independent‐samples t‐tests for normally distributed variables, Mann–Whitney U‐tests for non‐normally distributed variables and Fisher's exact tests for categorical variables. To analyse differences among multiple groups, one‐way analysis of variance (ANOVA) with Bonferroni post hoc correction was used for normally distributed variables that showed homogeneity of variance and Kruskal–Wallis tests followed by separate Mann–Whitney U‐tests were used otherwise. To analyse correlations between cardiac Dkk3 gene expression levels and DKK3 plasma concentrations with indices of cardiac remodelling in mice, Pearson's correlation tests were used.
For further analysis of the HF cohort, non‐normally distributed variables were log2‐transformed. Trends over DKK3 quintiles were tested using linear regression analysis for normally distributed variables, Jonckheere–Terpstra tests for non‐normally distributed variables and Cochran–Armitage trend tests for categorical variables. Both crude and age‐adjusted linear regression analyses were performed. Variables with a P‐value <0.1 in age‐adjusted analysis were included in multivariable linear regression analysis, using forward selection and pairwise exclusion. Differences in survival between DKK3 quintiles were analysed using Kaplan–Meier curves combined with log‐rank tests. To analyse the association of DKK3 with clinical outcomes, Cox regression analysis was performed. Using forward selection with entry based on significance and removal based on likelihood ratio, the critically nullifying factors for DKK3 prediction capacity were determined. Harrell's C‐statistic, the net reclassification index (NRI) and the integrated discrimination index (IDI) were determined to investigate the predictive performance of DKK3.
A P‐value of <0.05 was considered to indicate statistical significance. Statistical analysis was performed using IBM SPSS Statistics Version 23.0 (IBM Corp., Armonk, NY, USA) and STATA Version 14.0 (StataCorp LLC, College Station, TX, USA).
Results
Several suggested heart failure biomarkers lack cardiac specificity
To determine the cardiac specificity of established HF biomarkers, we first determined the cardiac specificity of the total human genome as described in Figure 1A , using expression data of healthy tissues as published by Fagerberg et al. 13 Of the 18 938 genes included in this analysis, only 24 genes (0.13%) showed cardiac‐specific expression (>90–100% cardiac‐derived) (Figure 1B ). Based on the proteinatlas.org database, we subsequently selected for genes encoding for known and predicted secreted proteins, which might constitute potential HF biomarkers. Of these, only three genes, including natriuretic peptide precursor type A (NPPA) and type B (NPPB), were cardiac‐specific, and five (0.24%) and 108 (5.1%) genes showed cardiac specificity of, respectively, 50–90% and 10–50% (Figure 1B ). The cardiac specificity of four HF biomarkers is visualized in Figure 1C , which shows that NPPB is highly cardiac‐specific (99.9%), whereas other markers, including Gal‐3 (LGALS3), GDF‐15 and tissue inhibitor of metalloproteinase‐1 (TIMP‐1), have low cardiac specificity (3.2%, 0.06% and 3.6%, respectively). Similar results were acquired for females (online supplementary Figure S1 ).
Figure 1.
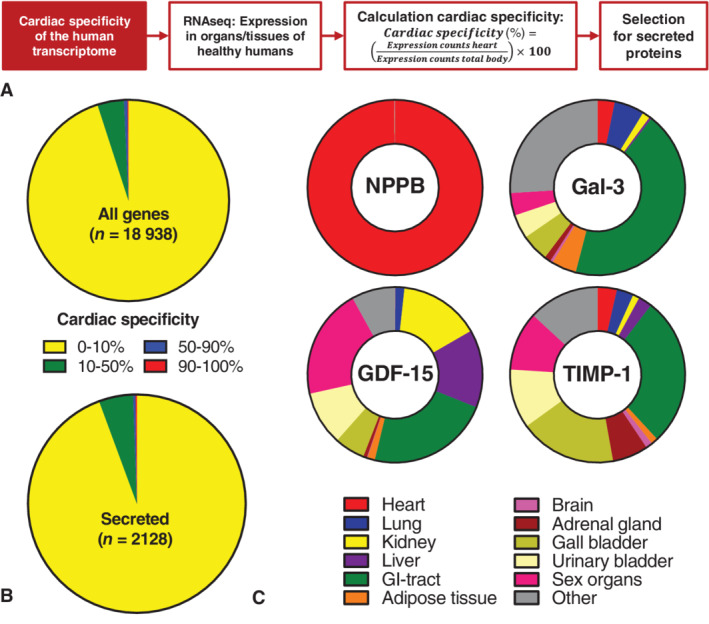
Cardiac specificity of the human genome and heart failure (HF) biomarkers. (A) Schematic depiction of the bioinformatics approach. Gene expression data as measured by RNAseq in all organs and tissues of healthy humans were used. 13 Included are adipose tissue, adrenal gland, appendix, bone marrow, brain, colon, duodenum, gall bladder, heart, kidney, liver, lung, lymph node, oesophagus, pancreas, salivary gland, skin, small intestine, spleen, stomach and thyroid gland. Sex‐specific organs or tissues were the prostate and testis for males, and endometrium and ovary for females. The cardiac specificity of genes was calculated by the formula shown. Finally, genes assumed to encode for secreted proteins were selected. (B) The cardiac specificity of the human genome (top) and of secreted protein encoding genes (bottom, showing the numbers of included genes. Coloured areas represent the amount of genes with the corresponding degree of specificity. Data include those for male tissues. (C) Cardiac specificity of several HF biomarkers. Coloured areas represent organ specificity. Data include those for male tissues. Gal‐3 (LGALS3), galectin‐3; GDF‐15, growth differentiation factor 15; GI tract, gastrointestinal tract, including appendix, colon, duodenum, oesophagus, small intestine and stomach; NPPB, natriuretic peptide precursor type B; TIMP‐1, tissue inhibitor of metalloproteinase 1; Sex organs, prostate and testis. The bioinformatics analysis was based on publicly available RNAseq data previously published by Fagerberg et al. 13
Next, cardiac specificity of secreted protein encoding genes was plotted against their total cardiac expression (Figure 2 ). Again, this confirmed that natriuretic peptides, including NPPA and NPPB, had high cardiac specificity (>99%) and high absolute cardiac expression (6250.9 and 3030.7 cardiac expression counts, respectively). In contrast, several other HF biomarkers, including Gal‐3 (LGALS3), interleukin‐6 (IL‐6), GDF‐15, TIMP‐1, insulin‐like growth factor‐binding protein‐7 (IGFBP‐7), myeloperoxidase (MPO) and human epididymis protein‐4 (HE4), showed low absolute and low relative cardiac gene expression (online supplementary Figure S2 ). Similar results were acquired for females (online supplementary Figures S3 and S4 ).
Figure 2.
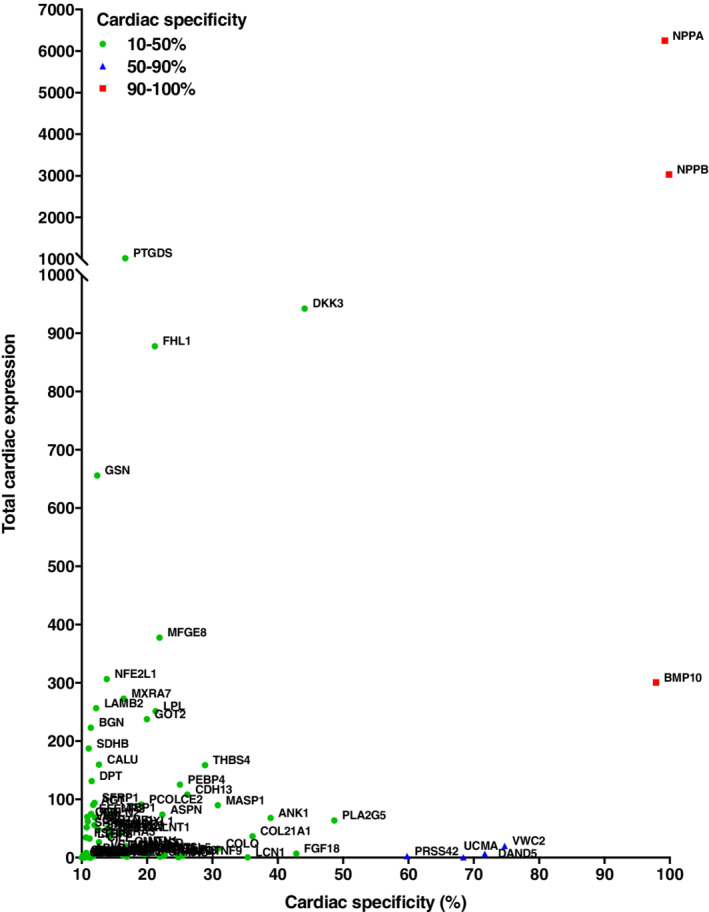
The cardiac specificity of secreted protein encoding genes. The total cardiac expression of secreted protein encoding genes was plotted against their calculated cardiac specificity. All genes with cardiac specificity of >10% are shown. Gene name abbreviations are used for readability. Organs and tissues include adipose tissue, adrenal gland, appendix, bone marrow, brain, colon, duodenum, gall bladder, heart, kidney, liver, lung, lymph node, oesophagus, pancreas, salivary gland, skin, small intestine, spleen, stomach and thyroid gland, and sex‐specific organs or tissues for males (prostate and testis). The bioinformatics analysis was based on publicly available RNAseq data previously published by Fagerberg et al. 13
DKK3 showed biomarker potential in bioinformatics analysis
The bioinformatics approach was used to identify possible novel cardiac‐specific HF biomarker candidates. Based on NPPA and NPPB, both cardiac specificity and high absolute cardiac expression were considered important characteristics. In line with these criteria, DKK3 and bone morphogenic protein 10 (BMP‐10) were selected as biomarker candidates (Figure 2 ). DKK3 was cardiac‐enriched, with 44.1% of expression counts coming from the heart. Moreover, total cardiac expression was relatively high, with an absolute 942.3 cardiac expression counts. In addition to the heart, DKK3 is also expressed in several other tissues, including the brain, gastrointestinal tract, lung and kidney, amongst others (online supplementary Figure S5 ). BMP‐10 showed greater cardiac specificity than DKK3 (97.9% cardiac‐specific), but lower absolute cardiac expression (300.5 cardiac expression counts). Because of analytical difficulties, we were not able to include BMP‐10 in this study. Together, these results warranted further investigation of DKK3 as an HF biomarker.
DKK3 in heart failure mouse models
To investigate the relationship between cardiac DKK3 expression and DKK3 plasma concentrations, left ventricular (LV) Dkk3 gene expression levels and DKK3 plasma concentrations were determined in three different HF mouse models, including an MI model, a TAC model and an obesity/hypertension model. Nppa gene expression and NT‐proANP plasma concentrations were determined as controls. These models have been described in detail previously, 9 , 19 and data on cardiac remodelling, including hypertrophy, fibrosis, cardiac function and cardiac dimensions are listed in online supplementary Table S4 . As shown previously, 9 LV Nppa gene expression was increased in all models and was associated with increased NT‐proANP plasma concentrations (Figure 3A ). In addition, LV Dkk3 gene expression levels were increased in MI and TAC mice, but were decreased in obese/hypertensive animals (Figure 3B ). However, the changes in LV Dkk3 gene expression did not translate into altered DKK3 plasma concentrations in any of these models (Figure 3B ). In liver, kidney and lung tissue, Dkk3 expression did not change in association with the disease perturbations (online supplementary Figure S6 ). Similarly to findings in humans, mouse Dkk3 gene expression was relatively high in the heart and low in liver and kidney; however, mouse lung tissue showed relatively high Dkk3 gene expression (online supplementary Figure S7 ). LV Dkk3 gene expression was associated with cardiac hypertrophy, cardiac dilatation and cardiac dysfunction (online supplementary Figures [Link] , [Link] ). However, LV Dkk3 gene expression levels showed no association with plasma DKK3 levels. Further, no direct associations between plasma DKK3 levels and indices of cardiac remodelling were observed (online supplementary Figures [Link] , [Link] ). Thus, in these models there was no simple relationship between circulating DKK3 with either cardiac Dkk3 expression or cardiac remodelling.
Figure 3.
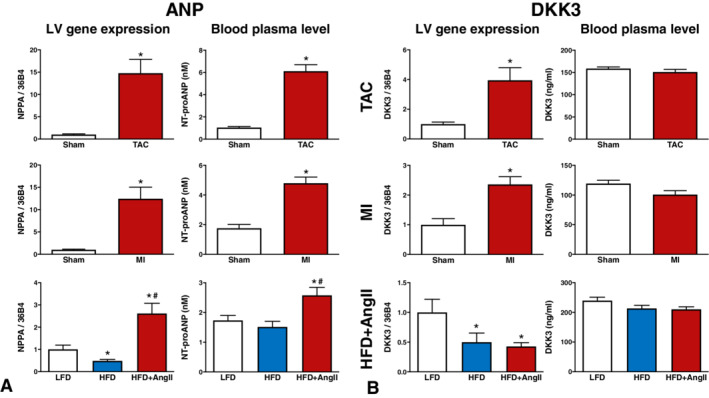
Cardiac gene expression and plasma concentrations of ANP and DKK3 in three different heart failure (HF) mouse models. Included HF models are transverse aortic constriction (TAC) (top row), myocardial infarction (MI) (middle row) and an obese/hypertension mouse model with HF with preserved ejection fraction characteristics (HFD + AngII, bottom row). (A) Natriuretic peptide precursor type A (Nppa) left ventricular (LV) gene expression (left) and N‐terminal pro‐atrial natriuretic peptide (NT‐proANP) plasma concentrations (right). Data on Nppa and NT‐proANP have been published previously, 9 but are presented here for convenience. (B) Dickkopf‐3 (Dkk3) gene expression (left) and DKK3 plasma concentrations (right). Gene expression values are corrected for 36b4 gene expression and presented as fold change. Bars represent means. Error bars represent standard errors of the mean. *P < 0.05 vs. sham or low fat diet. #P < 0.05 vs. HFD. AngII, angiotensin‐II; HFD, high fat diet; LFD, low fat diet.
Plasma DKK3 concentrations were higher in heart failure patients
Plasma concentrations of DKK3 were determined in HF patients and in age‐ and sex‐matched controls without HF. These results showed that median DKK3 plasma concentrations were higher in HF patients than in controls [46.4 ng/mL (IQR 38.6–57.4) vs. 36.3 ng/mL (IQR 31.5–41.3); P < 0.001] (online supplementary Figure S11 A and Table S5 ). Moreover, in HF patients, DKK3 concentrations increased with increasing NT‐proBNP quartiles, indicating a relationship with HF severity (online supplementary Figure S11 B).
Associations between DKK3 and patient characteristics
Next, the association of DKK3 with patient characteristics was further investigated in the total HF cohort. The mean ± SD age of the cohort was 68.3 ± 12.1 years. Median estimated glomerular filtration rate (eGFR) and LVEF were 59.5 mL/min (IQR 44.2–77.6 mL/min) and 30% (IQR 25–36%), respectively. Median DKK3 plasma concentration was 49.4 ng/mL (IQR 40.5–61.8 ng/mL). Baseline characteristics according to DKK3 quintiles are shown in Table 1 . Patients in higher DKK3 quintiles were generally older, and had a lower body mass index (BMI) and a lower eGFR. Moreover, these patients showed more severe HF, as indicated by a higher New York Heart Association (NYHA) class, higher prevalence of peripheral oedema, and higher circulating levels of NT‐proBNP and blood urea nitrogen (BUN). Echocardiography showed that higher plasma DKK3 levels were associated with smaller LV end‐diastolic diameters (LVEDDs), larger left atrial diameters and a higher prevalence of mitral valve regurgitation. Finally, this group's medical records showed a more vulnerable patient, with a higher prevalence of HF hospitalizations in the past year, and higher prevalences of atrial fibrillation and chronic obstructive pulmonary disease (COPD).
Table 1.
Baseline characteristics of heart failure patients according to blood plasma DKK3 quintiles
| DKK3, ng/mL | P‐value for trend | ||||||||||
|---|---|---|---|---|---|---|---|---|---|---|---|
| Q1: <38.8 | Q2: 38.8–45.7 | Q3: 45.8–53.2 | Q4: 53.3–65.8 | Q5: >65.8 | |||||||
| (n = 418) | (n = 418) | (n = 418) | (n = 418) | (n = 418) | |||||||
| Clinical characteristic | |||||||||||
| Age, years, mean ± SD | 61 ± 3 | 66 ± 12 | 70 ± 11 | 72 ± 11 | 73 ± 10 | <0.001* | |||||
| Male sex, n, % | 300 (71.8) | 323 (77.3) | 306 (73.2) | 304 (72.7) | 301 (72.0) | 0.552 | |||||
| White race, n, % | 415 (99.3) | 411 (98.3) | 414 (99.0) | 415 (99.3) | 412 (98.6) | 0.767 | |||||
| BMI, kg/m2, median (IQR) | 28 (25–33) | 28 (24–31) | 27 (24–31) | 26 (24–30) | 26 (23–29) | <0.001* | |||||
| SBP, mmHg, median (IQR) | 120 (110–138) | 125 (110–140) | 124 (110–140) | 120 (110–140) | 120 (108–130) | 0.002* | |||||
| eGFR, mL/min/1.73 m2, median (IQR) | 77.8 (59.3–92.2) | 63.1 (47.2–79.3) | 59.6 (45.2–75.5) | 53.5 (42.1–69.6) | 45.8 (31.9–62.2) | <0.001* | |||||
| Current AF, n, % | 80 (20.9) | 123 (33.4) | 146 (41.6) | 163 (48.1) | 180 (53.3) | <0.001* | |||||
| NYHA class III or IV, n, % | 232 (57.1) | 231 (57.0) | 258 (62.9) | 257 (64.4) | 270 (66.0) | 0.001* | |||||
| Peripheral oedema, n, % | 168 (50.8) | 188 (53.9) | 207 (57.3) | 218 (64.1) | 241 (68.9) | <0.001* | |||||
| Current smoker, n, % | 91 (21.8) | 78 (18.7) | 55 (13.2) | 44 (10.6) | 40 (9.6) | <0.001* | |||||
| Echocardiography | |||||||||||
| LVEF, %, median (IQR) | 30 (25–36) | 30 (25–35) | 30 (25–38) | 30 (25–35) | 30 (25–38) | 0.069 | |||||
| LVEDD, mm, mean ± SD | 62 ± 10 | 62 ± 9 | 61 ± 9 | 60 ± 10 | 60 ± 10 | 0.003* | |||||
| LVESD, mm, mean ± SD | 51 ± 12 | 50 ± 11 | 50 ± 11 | 50 ± 11 | 49 ± 12 | 0.134 | |||||
| Interventricular WT, mm, median (IQR) | 10 (9–12) | 10 (9–12) | 10 (9–12) | 10 (9–12) | 10 (9–12) | 0.207 | |||||
| Posterior WT, mm, median (IQR) | 10 (9–11) | 10 (9–11) | 10 (9–12) | 10 (9–11) | 10 (9–12) | 0.328 | |||||
| Left atrial diameter, mm, mean ± SD | 46 ± 7 | 47 ± 7 | 48 ± 7 | 47 ± 9 | 48 ± 9 | 0.009* | |||||
| Mitral valve regurgitation, n (%) | 149 (38.3) | 190 (48.1) | 191 (47.4) | 194 (48.4) | 201 (50.8) | 0.002* | |||||
| Medical history, n (%) | |||||||||||
| HF hospitalization in past year | 113 (27.0) | 132 (31.6) | 122 (29.2) | 136 (32.5) | 150 (35.9) | 0.009* | |||||
| Myocardial infarction | 140 (33.5) | 155 (37.1) | 153 (36.6) | 165 (39.5) | 164 (39.2) | 0.063 | |||||
| Stroke | 31 (7.4) | 33 (7.9) | 44 (10.5) | 36 (8.6) | 58 (13.9) | 0.003* | |||||
| Peripheral arterial disease | 45 (10.8) | 45 (10.8) | 48 (11.5) | 43 (10.3) | 48 (11.5) | 0.843 | |||||
| Diabetes | 133 (31.8) | 138 (33.0) | 134 (32.1) | 141 (33.7) | 121 (28.9) | 0.486 | |||||
| COPD | 59 (14.1) | 73 (17.5) | 85 (20.3) | 75 (17.9) | 64 (15.3) | 0.621 | |||||
| Medication, n (%) | |||||||||||
| Beta‐blocker | 358 (85.6) | 352 (84.2) | 344 (82.3) | 335 (80.1) | 348 (83.3) | 0.127 | |||||
| ACEi/ARB | 325 (77.8) | 313 (74.9) | 286 (68.4) | 287 (68.7) | 288 (68.9) | <0.001* | |||||
| Aldosterone antagonist | 248 (59.3) | 213 (51.0) | 229 (54.8) | 220 (52.6) | 187 (44.7) | <0.001* | |||||
| Diuretics | 418 (100.0) | 418 (100.0) | 416 (99.5) | 418 (100.0) | 418 (100.0) | 1.000 | |||||
| Blood laboratory values | |||||||||||
| Haemoglobin, g/dL, mean ± SD | 13.4 ± 1.8 | 13.3 ± 1.9 | 13.2 ± 1.9 | 13.1 ± 1.9 | 12.8 ± 1.9 | 0.541 | |||||
| Haematocrit, %, mean ± SD | 40.5 ± 4.9 | 40.3 ± 5.4 | 40.0 ± 5.3 | 39.8 ± 5.4 | 39.1 ± 5.4 | 0.880 | |||||
| BUN, mmol/L, median (IQR) | 8.3 (6.0–13.7) | 10.4 (7.5–17.1) | 11.1 (7.4–17.9) | 11.1 (8.0–18.2) | 13.9 (9.3–22.5) | <0.001* | |||||
| Sodium, mmol/L, median (IQR) | 140 (137–141) | 139 (137–141) | 140 (137–142) | 140 (138–141) | 139 (136–142) | 0.964 | |||||
| Potassium, mmol/L, median (IQR) | 4.2 (3.9–4.5) | 4.3 (3.9–4.7) | 4.3 (3.9–4.6) | 4.2 (3.9–4.6) | 4.2 (3.9–4.6) | 0.945 | |||||
| HDL, mmol/L, median (IQR) | 1.01 (0.80–1.32) | 1.06 (0.86–1.27) | 1.02 (0.83–1.25) | 1.09 (0.88–1.40) | 1.02 (0.86–1.32) | 0.689 | |||||
| NT‐proBNP, pg/mL, median (IQR) | 1444 (636–3177) | 2345 (1062–4884) | 2689 (1158–5337) | 3533 (1819–6299) | 4503 (2048–9322) | <0.001* | |||||
| Serum creatinine, µg/dL, median (IQR) | 1.00 (0.81–1.19) | 1.14 (0.95–1.40) | 1.13 (0.97–1.44) | 1.22 (1.00–1.56) | 1.40 (1.10–1.83) | <0.001* | |||||
| Troponin‐T, pg/mL, median (IQR) | 21.0 (13.1–37.4) | 28.4 (17.9–49.5) | 30.3 (20.2–50.2) | 34.8 (23.2–56.2) | 43.8 (27.6–72.2) | <0.001* | |||||
ACEi, angiotensin‐converting enzyme inhibitor; AF, atrial fibrillation; ARB, angiotensin receptor blocker; BMI, body mass index; BUN, blood urea nitrogen; COPD, chronic obstructive pulmonary disease; DKK3, Dickkopf‐3; eGFR, estimated glomerular filtration rate; HDL, high‐density lipoprotein; HF, heart failure; IQR, interquartile range; LVEDD, left ventricular end‐diastolic diameter; LVEF, left ventricular ejection fraction; LVESD, left ventricular end‐systolic diameter; NT‐proBNP, N‐terminal prohormone of B‐type natriuretic peptide; NYHA, New York Heart Association; SBP, systolic blood pressure; SD, standard deviation; WT, wall thickness.
P < 0.05 for trend analysis.
Online supplementary Table S6 shows the associations between plasma DKK3 and clinical variables. Next, a multivariable model was composed (Table 2 ). The strongest correlates with higher DKK3 concentrations were lower eGFR, higher age, higher NT‐proBNP level, presence of atrial fibrillation and lower BMI. The adjusted R 2 for the model was 0.212.
Table 2.
Multivariable model of variables associated with DKK3 plasma levels
| Variable | β ± SE | sβ | P‐value |
|---|---|---|---|
| eGFR a | −0.137 ± 0.027 | −0.201 | <0.001* |
| NT‐proBNP a | 0.041 ± 0.010 | 0.158 | <0.001* |
| Age | 0.004 ± 0.001 | 0.155 | <0.001* |
| Current AF | 0.098 ± 0.024 | 0.149 | <0.001* |
| BMI a | −0.142 ± 0.061 | −0.084 | 0.020* |
Multivariable model including DKK3‐associated factors. R 2adj = 0.212. Constructed with forward selection and pairwise exclusion. Variables with P < 0.10 in univariate regression analysis were included in constructing this model. DKK3 plasma levels were log2‐transformed.
AF, atrial fibrillation; β, beta coefficient; BMI, body mass index; eGFR, estimated glomerular filtration rate; NT‐proBNP, N‐terminal prohormone of B‐type natriuretic peptide; Sβ, standardized beta coefficient; SE, standard error.
Log2‐transformed.
P < 0.05.
DKK3 and HF outcome
During a median follow‐up of 21 months, 869 patients (41.6%) reached the primary endpoint (HF hospitalization or all‐cause mortality) and 555 patients (26.6%) died, 319 (57.5%) of whom from a cardiovascular cause. Kaplan–Meier curves for crude DKK3 quintiles showed that higher quintiles were associated with lower survival rates for all endpoints (log‐rank for all endpoints P < 0.001) (online supplementary Figure S12 ). These results were corroborated by crude Cox regression analysis, showing that baseline DKK3 plasma concentrations were predictive for the primary endpoint [hazard ratio (HR) 2.42 (1.74–3.38) per DKK3 doubling; P < 0.001], all‐cause mortality [HR 2.78 (2.11–3.67) per DKK3 doubling; P < 0.001] and cardiovascular mortality [HR 2.71 (1.86–3.93) per DKK3 doubling; P < 0.001] (Table 3 , model A). These remained significant after correction for age for all endpoints (Table 3 , model B), including the primary endpoint [HR 1.83 (1.29–2.60) per DKK3 doubling; P < 0.001], all‐cause mortality [HR 2.01 (1.05–2.72) per DKK3 doubling; P < 0.001] and cardiovascular mortality [HR 2.03 (1.36–3.04) per DKK3 doubling; P = 0.001]. However, after adjusting for established HF prediction models 22 (for predicting primary endpoint and all‐cause mortality) or the multivariable model (Table 2 , for predicting cardiovascular mortality), DKK3 did not independently predict HF outcome (Table 3 , models E and F). Critically nullifying factors for DKK3 prediction capacity were age + NT‐proBNP for the primary endpoint and cardiovascular mortality, and age + NT‐proBNP + BUN for all‐cause mortality (Table 3 , models C and D). Harrell's C‐statistic, the NRI and the IDI confirmed that DKK3 did not improve prediction models of HF outcome (online supplementary Table S7 ).
Table 3.
Cox proportional hazards analysis for prediction of heart failure outcome by doubling of DKK3
| Model | Primary endpoint | All‐cause mortality | Cardiovascular mortality | |||
|---|---|---|---|---|---|---|
| HR (95% CI) | P‐value | HR (95% CI) | P‐value | HR (95% CI) | P‐value | |
| A | 2.42 (1.74–3.38) | <0.001* | 2.78 (2.11–3.67) | <0.001* | 2.76 (1.90–4.00) | <0.001* |
| B | 1.83 (1.29–2.60) | 0.001* | 2.02 (1.50–2.72) | <0.001* | 2.07 (1.39–3.10) | <0.001* |
| C | 1.34 (0.93–1.92) | 0.116 | 1.43 (1.05–1.94) | 0.024* | 1.44 (0.95–1.92) | 0.088 |
| D | NA | NA | 1.24 (0.91–1.70) | 0.172 | NA | NA |
| E | 1.13 (0.79–1.61) | 0.503 | 1.27 (0.94–1.73) | 0.122 | NA | NA |
| F | NA | NA | NA | NA | 1.15 (0.74–1.80) | 0.531 |
Model A = Univariable DKK3. Model B = Model A corrected for age. Model C = Model B corrected for NT‐proBNP. Model D = Model C corrected for BUN. Model E = Model A corrected for previously published HF risk prediction models. 22 For the primary endpoint, this includes age, previous HF hospitalization in the past year, peripheral oedema, SBP, NT‐proBNP, haemoglobin, HDL, sodium and beta‐blocker usage. For all‐cause mortality, this includes age, NT‐proBNP, BUN, haemoglobin and beta‐blocker usage. Model F = Model A corrected for multivariable model as presented in Table 2 .
BUN, blood urea nitrogen; CI, confidence interval; HDL, high‐density lipoprotein; HF, heart failure; HR, hazard ratio; NA, not available; NT‐proBNP, N‐terminal prohormone of B‐type natriuretic peptide; SBP, systolic blood pressure.
P < 0.05.
Discussion
By performing a bioinformatics analysis, we determined the cardiac specificity of known HF biomarkers with the aim of identifying novel HF biomarkers of cardiac remodelling by selecting for cardiac specificity. We confirmed that several suggested HF biomarkers, including Gal‐3 and GDF‐15, lack cardiac specificity, whereas natriuretic peptides are characterized by both high relative and absolute cardiac expression. A search for novel HF biomarkers with higher cardiac specificity and absolute cardiac expression showed that DKK3 is cardiac‐enriched and hence could be a potential HF biomarker. However, in three different HF mouse models, no relationship between cardiac Dkk3 expression and circulating DKK3 concentrations was observed. Moreover, although DKK3 plasma concentrations were increased in HF patients compared with age‐ and sex‐matched controls, plasma concentrations were predominantly associated with HF risk factors and comorbidities and showed no independent association with clinical outcomes. Overall, DKK3 has limited value as an HF biomarker in addition to natriuretic peptides, and it appears that proteins must have a high degree of cardiac specificity to have potential as diagnostic HF biomarkers.
In recent decades, HF biomarkers have been studied extensively, but only natriuretic peptides (released by active secretion) and troponins (released by passive leakage) are currently used in the clinic, whereas many other investigated markers fail to provide additional clinical value. 1 , 2 , 3 , 4 , 5 , 7 , 8 It is known that comorbidities influence the plasma levels of several biomarkers, which hampers the correlating of plasma concentrations with processes of cardiac remodelling. 9 Lack of cardiac specificity was suggested to be one of the main reasons why novel biomarkers fail to add clinical value. 4 , 9 Our analysis confirms the lack of cardiac specificity of several suggested HF biomarkers, including Gal‐3, GDF‐15, HE4, IGFBP‐7, IL‐6, MPO and TIMP‐1. Further, this study suggests that, although DKK3 can be marked as cardiac‐enriched and shows relatively high absolute cardiac expression, DKK3 appears not to be suitable as a biomarker of cardiac remodelling in HF. Our findings suggest that only BMP‐10 shows a profile similar to that of natriuretic peptides (high cardiac absolute expression, high cardiac specificity, encoding a secreted protein). However, whether BMP‐10 expression and secretion are altered upon pathological stress conditions is yet unknown and there is currently no proper method of detecting plasma BMP‐10. Thus, to date natriuretic peptides are the only known secreted proteins with high absolute cardiac expression, high cardiac specificity and increased expression in HF conditions.
Based on previous research and our bioinformatics analysis, DKK3 showed HF biomarker potential. Our mouse studies revealed elevated cardiac Dkk3 gene expression in mouse models of HF with reduced ejection fraction (HFrEF), but these changes were not reflected in the plasma pool. This indicates that cardiac contribution to the total plasma pool is limited and/or that cardiac‐derived DKK3 does not enter the circulation. In this regard, it should be noted that DKK3 is a relatively large glycoprotein of approximately 50 kDa, and is much larger than the small natriuretic peptides (<4 kDa), which possibly impedes its passage over the tight cardiac endothelial barrier. 23 Protein size may therefore also be an important consideration in HF biomarker research. In addition, other protein characteristics, such as half‐life, degradation, metabolization, internalization and protein interactions, may also influence plasma levels and hence biomarker function. The fact that plasma DKK3 concentrations were elevated in HF patients compared with control subjects may be a result of comorbidities present in HF patients. In these patients, increased DKK3 expression and/or secretion by other affected tissues may cause elevated plasma levels. This may also be partly dependent on the degree of HF, as severe HF will more strongly affect other organs and tissues. In this respect, HF may indirectly affect plasma DKK3 concentrations. The HF mouse models used are in general ‘clean’ models, which lack the complexity of many comorbidities and/or other diseases present in the human population, which may explain the absence of elevated plasma DKK3 concentrations in HF mouse models. Only the obesity/hypertension mouse model included obesity as a comorbidity and interestingly showed lower cardiac Dkk3 gene expression and a tendency towards lower plasma levels. This may reflect the inverse relationship between DKK3 plasma concentrations and BMI, as observed in the current patient cohort, and deserves further investigation. These results indicate that cardiac‐specific gene expression is an important determinant, but not the only factor that determines plasma concentrations of biomarkers.
Our results suggest that cardiac specificity appears to be an important factor in a diagnostic HF biomarker. In the animal models investigated, no direct relationship between cardiac Dkk3 expression and plasma DKK3 concentrations was observed. Hence, the diagnostic value of DKK3, at least in the types of HF investigated, seems limited. Possibly, DKK3 may serve as a diagnostic atrial biomarker as DKK3 was associated with left atrial diameter and atrial fibrillation. However, as HF is a systemic syndrome, high cardiac specificity is probably less important for a prognostic HF biomarker. This is illustrated by the fact that existing HF prediction models contain a broad variety of predictors, including some not specifically associated with the heart. The prediction models used in this study are already strong. DKK3 did not improve these models and we believe it will be difficult to identify additional and independent predictors to add to these established predictors of HF outcome.
Previously, the use of HF mouse models confirmed an association between DKK3 and cardiac remodelling. 14 , 15 , 16 Dkk3 overexpression attenuated cardiac hypertrophy and dilatation, whereas Dkk3 deletion aggravated these processes and resulted in increased mortality. 14 , 15 , 16 Thus, Dkk3 has cardioprotective qualities. Although our analysis was not designed to investigate the role of Dkk3 in cardiac remodelling, the observation that LV Dkk3 gene expression was increased in MI and TAC mice and was associated with indices of cardiac remodelling at least suggests a role for Dkk3 in HF pathophysiology.
DKK3 is an emerging biomarker and has been investigated as a biomarker for non‐cardiac diseases in several studies. Firstly, a recent study in patients with prevalent renal dysfunction showed that urinary levels of DKK3 independently predict future loss of renal function. 24 Further, in patients about to undergo major cardiac surgery, preoperative urinary DKK3 levels are associated with postoperative acute kidney injury and future loss of renal function. 25 Animal experiments showed that renal tubular epithelial cells appear to be the main source of urinary DKK3 and DKK3 in urine has been proposed as a marker for renal tubular damage and renal tubules at risk. 24 , 25 , 26 , 27 In this study, which investigated DKK3 levels in plasma rather than in urine, a relationship was identified between kidney function and DKK3 plasma levels. Secondly, a previous study showed that DKK3 plasma levels are inversely related to atherosclerosis. 28 The current study was not designed to specifically investigate the association of DKK3 with atherosclerosis, but it did not identify any independent relationship with any variable associated with atherosclerosis. Finally, DKK3 has been found previously to be associated with age. 29 The current study also found a strong correlation between DKK3 and age, thereby corroborating previous observations.
Some limitations should be mentioned. The bioinformatics approach is based on RNAseq data derived from many organs and tissues, but does not correct for organ size. Small organs may have been over‐represented and large organs under‐represented in this analysis. Nevertheless, the values observed for natriuretic peptides and several other markers (including Gal‐3, GDF‐15, TIMP‐1 and DKK3) were in line with previous findings. 9 , 30 Based on the bioinformatics approach, BMP‐10 also appeared to be an HF biomarker candidate. Unfortunately, we were unable to measure BMP‐10 with acceptable precision and reproducibility, an issue that has been reported previously and which is thought to be caused by interference of BMP‐9 with BMP‐10. 31 We note that BMP‐10 assays may become available in the near future based on a recent patent by Roche (WO/2020/035605; Roche Diagnostics GmbH, Mannheim, Germany).
Conclusions
Herein, we have shown that several suggested HF biomarkers are not cardiac‐specific. Although DKK3 is cardiac‐enriched and the secreted protein shows relatively high absolute cardiac expression, including in comparison with other suggested markers, such as Gal‐3 and GDF‐15, in HF mouse models a simple relationship between cardiac and circulating DKK3 pools was absent. Moreover, DKK3 was not independently associated with HF outcome. Based on this study, the clinical potential of DKK3 as a biomarker for HF seems limited. Finally, we believe that high cardiac specificity is an important characteristic in a protein if it is to have potential as a diagnostic HF biomarker.
Supporting information
Appendix S1. Methods.
Table S1. Raw data of a selection of genes as analyzed in the bioinformatics analysis. Table showing the raw data and calculation procedures of a selection of genes encoding established and suggested HF biomarkers. Expression levels are shown for the heart separately and for the total body (for male and female tissues separately). Finally, the cardiac specificity of listed genes as calculated by the formula as described in Figure 1 is shown. Expression levels are represented as absolute read values in RNAseq as performed and published by Fagerberg et al. 13 Included organs and tissues in total body expression levels are adipose tissue, adrenal gland, appendix, bone marrow, brain colon, duodenum, esophagus, gall bladder, heart, kidney, liver, lung, lymph node, pancreas, salivary gland, skin, small intestine, spleen, stomach, thyroid gland, and prostate and testis for male, and endometrium and ovary for female. BMP‐10=Bone morphogenic protein 10. DKK3=Dickkopf‐3. GDF‐15=Growth differentiation factor 15. HE4=Human epididymis protein 4. IGFBP‐7=Insulin growth factor binding protein 7. IL‐6=Interleukin‐6. LGALS3=Gene encoding galectin‐3. MPO=Myeloperoxidase. NPPA=Natriuretic peptide precursor type A. NPPB=Natriuretic peptide precursor type B. TIMP‐1=Tissue inhibitor of metalloproteinase‐1.
Table S2. Oligonucleotide pairs used for RT‐qPCR. Oligonucleotide pairs used for real‐time quantitative polymerase chain reaction. DKK3=Dickopf‐3. NPPA=Natriuretic peptide precursor type A.
Table S3. Stability of human DKK3 in plasma. Included treatments are four freeze‐thaw cycles, storage of plasma samples at 4°C for 48 hours and storage of a plasma sample at room temperature for 48 hours. DKK3 values are shown as mean ± standard deviation. N=3 per group. DKK3=Dickkopf‐3.
Table S4. Hemodynamics, cardiac dimensions and left ventricular remodeling in TAC, MI and obese/hypertensive mice. Data are presented as means ± standard error of the mean. AngII=Angiotensin‐II (final 4wks of 16wks HFD). CMR=Cardiac magnetic resonance imaging. dP/dTmax=Measure for left ventricular maximal contraction capacity, here corrected for maximal ventricular pressure. dP/dTmin=Measure for left ventricular maximal relaxation capacity, here corrected for maximal ventricular pressure. HFD=High fat diet (16wks). LFD=Low fat diet (16wks). LV=Left ventricle. LVEDV=Left ventricular end‐diastolic volume. LVEF=Left ventricular ejection fraction. LVESP=Left ventricular end‐systolic pressure. LVESV=Left ventricular end‐systolic volume. MI=Myocardial infarction (8wks). P‐catheter=Pressure catheter. TAC=Transverse aortic constriction (8wks). LV weight is corrected for tibia length to the power of 332. N=6‐20. *P < 0.05 versus respective sham group for TAC and MI, or LFD for HFD and HFD+AngII. #P<0.05 versus HFD. Data as published before in Theranostics9 and Scientific Reports19, but presented here for convenience.
Table S5. Baseline characteristics of patients with heart failure, and age and sex matched controls. Data are presented as means ± standard deviation for normally distributed variables, as medians (interquartile range) for non‐normally distributed variables and as percentage (n) for categorical variables. BMI=Body mass index. DKK3=Dickkopf‐3. eGFR=Estimated glomerular filtration rate. Maximum age used for these comparisons was 75 years. Control subjects were selected for having no history of myocardial infarction, cerebrovascular accidents or renal disease and no eGFR < 60. *P < 0.05.
Table S6. Relationship between DKK3 plasma levels and baseline characteristics. The relationship between DKK3 plasma concentrations and baseline characteristics as analyzed by univariate linear regression and age‐adjusted linear regression analysis. Sβ=Standardized beta coefficient. †=Log‐transformed. Abbreviations as in Table 1. *P < 0.05.
Table S7. Heart failure outcome prediction models and the effect of DKK3 on predictive performance. The effect of DKK3 on the predictive performance of heart failure outcome prediction models is analyzed by Harrell's C‐statistic, NRI and IDI. Results are shown for the three endpoints, including the primary endpoint (HF‐hospitalization and all‐cause mortality), all‐cause mortality and cardiovascular mortality. For the primary endpoint the prediction model includes includes age, previous HF hospitalization in last year, peripheral edema, SBP, NT‐proBNP, hemoglobin, HDL, sodium and betablocker usage. For all‐cause mortality the prediction model includes age, NT‐proBNP, BUN, hemoglobin and betablocker usage. For cardiovascular mortality the prediction model includes the variables included in the multivariable model as presented in Table 2. DKK3=Dickkopf‐3. IDI=Integrated discrimination index. NRI=Net reclassification index. Other abbreviations as in Table 1. DKK3 did not significantly improve any of the models.
Figure S1. Cardiac specificity of the human genome and heart failure (HF) biomarkers, including female tissues. (A) Graphs showing the cardiac specificity of the human genome (top) and of secreted protein encoding genes (bottom), showing numbers of genes included. Coloured areas represent the amount of genes with corresponding degrees of specificity. (B) The cardiac specificity of several HF biomarkers. Coloured areas represent organ specificity. Gal‐3, galectin‐3; GDF‐15, growth differentiation factor 15; GI tract, gastrointestinal tract, including appendix, colon, duodenum, oesophagus, small intestine and stomach; NPPB, natriuretic peptide precursor type B; sex organs, endometrium and ovary; TIMP‐1, tissue inhibitor of metalloproteinase 1. Organs and tissues included are adipose tissue, adrenal gland, appendix, bone marrow, brain, colon, duodenum, gall bladder, heart, kidney, liver, lung, lymph node, oesophagus, pancreas, salivary gland, skin, small intestine, spleen, stomach and thyroid gland, and female sex‐specific tissues. The bioinformatics analysis was based on publicly available RNAseq data previously published by Fagerberg et al. 13
Figure S2. Cardiac specificity of suggested heart failure (HF) biomarkers. The total cardiac expression of secreted protein encoding genes was plotted against their calculated cardiac specificity. Data for suggested HF biomarkers are shown, including insulin‐like growth factor‐binding protein 7 (IGFBP‐7), tissue inhibitor of metalloproteinase 1 (TIMP‐1), LGALS3 (gene encoding galectin‐3), interleukin‐6 (IL‐6), human epididymis protein 4 (HE4), myeloperoxidase (MPO) and growth differentiation factor 15 (GDF‐15). Organs and tissues included are adipose tissue, adrenal gland, appendix, bone marrow, brain, colon, duodenum, gall bladder, heart, kidney, liver, lung, lymph node, oesophagus, pancreas, salivary gland, skin, small intestine, spleen, stomach and thyroid gland, and male sex‐specific tissues (prostate and testis). The bioinformatics analysis was based on publicly available RNAseq data previously published by Fagerberg et al. 13
Figure S3. Cardiac specificity of secreted protein encoding genes, including female tissues. Total cardiac expression of secreted protein encoding genes was plotted against their calculated cardiac specificity. All genes with cardiac specificity >10% are shown. Gene name abbreviations are used for readability. Organs and tissues included are adipose tissue, adrenal gland, appendix, bone marrow, brain, colon, duodenum, gall bladder, heart, kidney, liver, lung, lymph node, oesophagus, pancreas, salivary gland, skin, small intestine, spleen, stomach and thyroid gland, and female‐specific tissues (endometrium and ovary). The bioinformatics analysis was based on publicly available RNAseq data previously published by Fagerberg et al. 13
Figure S4. Cardiac specificity of suggested heart failure (HF) biomarkers. The total cardiac expression of secreted protein encoding genes was plotted against their calculated cardiac specificity. Data for suggested HF biomarkers is shown, including insulin‐like growth factor‐binding protein 7 (IGFBP‐7), tissue inhibitor of metalloproteinase 1 (TIMP‐1), LGALS3 (gene encoding galectin‐3), interleukin‐6 (IL‐6), human epididymis protein 4 (HE4), myeloperoxidase (MPO) and growth differentiation factor 15 (GDF‐15). Organs and tissues included are adipose tissue, adrenal gland, appendix, bone marrow, brain, colon, duodenum, gall bladder, heart, kidney, liver, lung, lymph node, oesophagus, pancreas, salivary gland, skin, small intestine, spleen, stomach and thyroid gland, and female‐specific tissues (endometrium and ovary). The bioinformatics analysis was based on publicly available RNAseq data previously published by Fagerberg et al. 13
Figure S5. Expression of Dickkopf‐3 (DKK3) in multiple organs and tissues. Cardiac specificity of DKK3 according to the bioinformatics analysis, which was based on publicly available RNAseq data previously published by Fagerberg et al. 13 The left graph includes male sex‐specific organs (prostate and testis). The right graph includes female sex‐specific organs (endometrium and ovary). Organs and tissues included are adipose tissue, adrenal gland, appendix, bone marrow, brain, colon, duodenum, gall bladder, heart, kidney, liver, lung, lymph node, oesophagus, pancreas, salivary gland, skin, small intestine, spleen, stomach and thyroid gland. GI tract, gastrointestinal tract.
Figure S6. Dickkopf‐3 (DKK3) gene expression in liver, kidney and lung tissue of mice in three heart failure (HF) mouse models: (i) transverse aortic constriction (TAC); (ii) myocardial infarction (MI), and (iii) an obese/hypertension mouse model (HFD and HFD + AngII). Included organs are (A) left ventricle (LV), (B) liver, (C) kidney and (D) lung. AngII, Angiotensin‐II; DKK3, Dickkopf‐3; HFD, high fat diet. Gene expression values are corrected for 36B4 gene expression and presented as fold change. Bars represent means. Error bars represent standard errors of the mean. The striped line represents expression levels in the control. *P < 0.05 vs. control.
Figure S7. Dickkopf‐3 (DKK3) gene expression in mouse left ventricle (LV), liver, kidney and lung tissue in the low fat diet (LFD) group of the obesity/hypertension mouse model. Gene expression values are corrected for 36B4 gene expression and presented as fold change compared with expression in LV. Bars represent means. Error bars represent standard errors of the mean. *P < 0.05 vs. LV. #P < 0.05 vs. group as indicated.
Figure S8. Correlation matrix showing the associations between cardiac Dickkopf‐3 (DKK3) expression, plasma DKK3 levels and indices of cardiac remodelling in the transverse aortic constriction (TAC), 8 weeks, mouse model. Data are shown as Pearson's correlation coefficients. Colours indicate the degree and direction of the correlation coefficient, with red shades indicating positive correlations and blue shades indicating negative correlations. Left ventricle (LV) weight is corrected for tibia length to the power of 3. 32 dP/dTmax, measure for LV maximal contraction capacity, here corrected for maximal ventricular pressure; dP/dTmin, measure for LV maximal relaxation capacity, here corrected for maximal ventricular pressure; LVEDV, LV end‐diastolic volume; LVEF, LV ejection fraction; LVESP, LV end‐systolic pressure; LVESV, LV end‐systolic volume. *P < 0.05.
Figure S9. Correlation matrix showing the associations between cardiac Dickkopf‐3 (DKK3) expression, plasma DKK3 levels and indices of cardiac remodelling in the myocardial infarction (MI), 8 weeks, mouse model. Data are shown as Pearson's correlation coefficients. Colours indicate the degree and direction of the correlation coefficient, with red shades indicating positive correlations and blue shades indicating negative correlations. Left ventricle (LV) weight is corrected for tibia length to the power of 3. 32 dP/dTmax, measure for LV maximal contraction capacity, here corrected for maximal ventricular pressure; dP/dTmin, measure for LV maximal relaxation capacity, here corrected for maximal ventricular pressure; LVEDV, LV end‐diastolic volume; LVEF, LV ejection fraction; LVESP, LV end‐systolic pressure; LVESV, LV end‐systolic volume. *P < 0.05.
Figure S10. Correlation matrix showing the associations between cardiac Dickkopf‐3 (DKK3) expression, plasma DKK3 levels and indices of cardiac remodelling in the obesity/hypertension (HFD/AngII) mouse model. Data are shown as Pearson's correlation coefficients. Colours indicate the degree and direction of the correlation coefficient, with red shades indicating positive correlations and blue shades indicating negative correlations. Left ventricular (LV) weight is corrected for tibia length to the power of 3. 32 AngII, angiotensin‐II (final 4 weeks of 16 weeks HFD); dP/dTmax, measure for LV maximal contraction capacity, here corrected for maximal ventricular pressure; dP/dTmin, measure for LV maximal relaxation capacity, here corrected for maximal ventricular pressure; HFD, high fat diet (16 weeks); LFD, low fat diet (16 weeks); LVEDV, LV end‐diastolic volume; LVEF, LV ejection fraction; LVESP, LV end‐systolic pressure; LVESV, LV end‐systolic volume. *P < 0.05.
Figure S11. Dickkopf‐3 (DKK3) plasma concentrations in heart failure (HF) patients vs. age‐ and sex‐matched controls without HF. (A, B) DKK3 plasma levels in patients with HF and age‐ and sex‐matched healthy controls from PREVEND. (A) Comparison of DKK3 plasma levels in HF patients vs. controls. (B) Comparison of DKK3 plasma levels in controls, and in HF patients according to NT‐proBNP. P < 0.05 vs. control. #P < 0.05 vs. all other quartiles.
Figure S12. Kaplan–Meier curves based on Dickkopf‐3 (DKK3) quintiles. (A–C) Kaplan–Meier curves based on DKK3 quintiles in patients with heart failure (HF) for (A) the composite endpoint (HF hospitalization and all‐cause mortality), (B) cardiovascular mortality, and (C) all‐cause mortality. DKK3 quintiles are <38.8, 38.8–45.7, 45.8–53.2, 53.3–65.8 and >65.8 ng/mL. Log‐rank tests were significant for all endpoints.
Acknowledgements
The authors would like to thank Martin Dokter, Weijie Du, Frouke Houtsma, Noa Keizer and Marloes Schouten for excellent technical assistance, and Haye van der Wal for reviewing the statistical methods.
Funding
The authors acknowledge the support of the Netherlands Heart Foundation (CVON Predict2, grant no. 2018‐30; CVON DOSIS, grant no. 2014–40), the Foundation Leducq (CurePLaN) and the European Research Council (ERC CoG 818715, SECRETE‐HF).
Conflict of interest: the University Medical Centre Groningen, which employs A.P., N.S., A.A.V., R.A.dB. and H.H.W.S., has received research grants and/or fees from AstraZeneca, Abbott, Bristol‐Myers Squibb, Novartis, Novo Nordisk and Roche. A.A.V. has received consultancy fees and education grants from Roche Diagnostics. R.A.dB. has received personal fees from Abbott, AstraZeneca, Novartis and Roche Diagnostics. The other authors have nothing to disclose.
References
- 1. Yancy CW, Jessup M, Bozkurt B, Butler J, Casey DE Jr, Colvin MM, Drazner MH, Filippatos GS, Fonarow GC, Givertz MM, Hollenberg SM, Lindenfeld J, Masoudi FA, McBride PE, Peterson PN, Stevenson LW, Westlake C. 2017 ACC/AHA/HFSA focused update of the 2013 ACCF/AHA Guideline for the Management of Heart Failure: a report of the American College of Cardiology/American Heart Association Task Force on Clinical Practice Guidelines and the Heart Failure Society of America. J Card Fail 2017;23:628–651. [DOI] [PubMed] [Google Scholar]
- 2. Ponikowski P, Voors AA, Anker SD, Bueno H, Cleland JG, Coats AJ, Falk V, Gonzalez‐Juanatey JR, Harjola VP, Jankowska EA, Jessup M, Linde C, Nihoyannopoulos P, Parissis JT, Pieske B, Riley JP, Rosano GM, Ruilope LM, Ruschitzka F, Rutten FH, van der Meer P; Authors/Task Force Members . 2016 ESC guidelines for the diagnosis and treatment of acute and chronic heart failure: the Task Force for the diagnosis and treatment of acute and chronic heart failure of the European Society of Cardiology (ESC). Developed with the special contribution of the Heart Failure Association (HFA) of the ESC. Eur J Heart Fail 2016;18:891–975. [DOI] [PubMed] [Google Scholar]
- 3. Levin ER, Gardner DG, Samson WK. Natriuretic peptides. N Engl J Med 1998;339:321–328. [DOI] [PubMed] [Google Scholar]
- 4. Piek A, Du W, de Boer RA, Sillje HHW. Novel heart failure biomarkers: why do we fail to exploit their potential? Crit Rev Clin Lab Sci 2018;55:246–263. [DOI] [PubMed] [Google Scholar]
- 5. Kinnunen P, Vuolteenaho O, Ruskoaho H. Mechanisms of atrial and brain natriuretic peptide release from rat ventricular myocardium: effect of stretching. Endocrinology 1993;132:1961–1970. [DOI] [PubMed] [Google Scholar]
- 6. Liang F, Gardner DG. Mechanical strain activates BNP gene transcription through a p38/NF‐kappaB‐dependent mechanism. J Clin Invest 1999;104:1603–1612. [DOI] [PMC free article] [PubMed] [Google Scholar]
- 7. Liang F, Wu J, Garami M, Gardner DG. Mechanical strain increases expression of the brain natriuretic peptide gene in rat cardiac myocytes. J Biol Chem 1997;272:28050–28056. [DOI] [PubMed] [Google Scholar]
- 8. Omland T, Rosjo H, Giannitsis E, Agewall S. Troponins in heart failure. Clin Chim Acta 2015;443:78–84. [DOI] [PubMed] [Google Scholar]
- 9. Du W, Piek A, Schouten EM, van de Kolk CWA, Mueller C, Mebazaa A, Voors AA, de Boer RA, Sillje HHW. Plasma levels of heart failure biomarkers are primarily a reflection of extracardiac production. Theranostics 2018;8:4155–4169. [DOI] [PMC free article] [PubMed] [Google Scholar]
- 10. De Angelis G, Rittenhouse HG, Mikolajczyk SD, Blair Shamel L, Semjonow A. Twenty years of PSA: from prostate antigen to tumor marker. Rev Urol 2007;9:113–123. [PMC free article] [PubMed] [Google Scholar]
- 11. Dufour DR, Lott JA, Nolte FS, Gretch DR, Koff RS, Seeff LB. Diagnosis and monitoring of hepatic injury. I. Performance characteristics of laboratory tests. Clin Chem 2000;46:2027–2049. [PubMed] [Google Scholar]
- 12. Ismail OZ, Bhayana V. Lipase or amylase for the diagnosis of acute pancreatitis? Clin Biochem 2017;50:1275–1280. [DOI] [PubMed] [Google Scholar]
- 13. Fagerberg L, Hallstrom BM, Oksvold P, Kampf C, Djureinovic D, Odeberg J, Habuka M, Tahmasebpoor S, Danielsson A, Edlund K, Asplund A, Sjostedt E, Lundberg E, Szigyarto CA, Skogs M, Takanen JO, Berling H, Tegel H, Mulder J, Nilsson P, Schwenk JM, Lindskog C, Danielsson F, Mardinoglu A, Sivertsson A, von Feilitzen K, Forsberg M, Zwahlen M, Olsson I, Navani S, Huss M, Nielsen J, Ponten F, Uhlen M. Analysis of the human tissue‐specific expression by genome‐wide integration of transcriptomics and antibody‐based proteomics. Mol Cell Proteomics 2014;13:397–406. [DOI] [PMC free article] [PubMed] [Google Scholar]
- 14. Zhang Y, Liu Y, Zhu XH, Zhang XD, Jiang DS, Bian ZY, Zhang XF, Chen K, Wei X, Gao L, Zhu LH, Yang Q, Fan GC, Lau WB, Ma X, Li H. Dickkopf‐3 attenuates pressure overload‐induced cardiac remodelling. Cardiovasc Res 2014;102:35–45. [DOI] [PMC free article] [PubMed] [Google Scholar]
- 15. Zhai CG, Xu YY, Tie YY, Zhang Y, Chen WQ, Ji XP, Mao Y, Qiao L, Cheng J, Xu QB, Zhang C. DKK3 overexpression attenuates cardiac hypertrophy and fibrosis in an angiotensin‐perfused animal model by regulating the ADAM17/ACE2 and GSK‐3beta/beta‐catenin pathways. J Mol Cell Cardiol 2018;114:243–252. [DOI] [PubMed] [Google Scholar]
- 16. Lu D, Bao D, Dong W, Liu N, Zhang X, Gao S, Ge W, Gao X, Zhang L. Dkk3 prevents familial dilated cardiomyopathy development through Wnt pathway. Lab Invest 2016;96:239–248. [DOI] [PubMed] [Google Scholar]
- 17. Bao MW, Cai Z, Zhang XJ, Li L, Liu X, Wan N, Hu G, Wan F, Zhang R, Zhu X, Xia H, Li H. Dickkopf‐3 protects against cardiac dysfunction and ventricular remodelling following myocardial infarction. Basic Res Cardiol 2015;110:25. [DOI] [PubMed] [Google Scholar]
- 18. Cox EJ, Marsh SA. A systematic review of fetal genes as biomarkers of cardiac hypertrophy in rodent models of diabetes. PLoS One 2014;9:e92903. [DOI] [PMC free article] [PubMed] [Google Scholar]
- 19. Piek A, Koonen DPY, Schouten EM, Lindtstedt EL, Michaelsson E, de Boer RA, Sillje HHW. Pharmacological myeloperoxidase (MPO) inhibition in an obese/hypertensive mouse model attenuates obesity and liver damage, but not cardiac remodeling. Sci Rep 2019;9:18765. [DOI] [PMC free article] [PubMed] [Google Scholar]
- 20. Voors AA, Anker SD, Cleland JG, Dickstein K, Filippatos G, van der Harst P, Hillege HL, Lang CC, Ter Maaten JM, Ng L, Ponikowski P, Samani NJ, van Veldhuisen DJ, Zannad F, Zwinderman AH, Metra M. A systems BIOlogy Study to TAilored Treatment in Chronic Heart Failure: rationale, design, and baseline characteristics of BIOSTAT‐CHF. Eur J Heart Fail 2016;18:716–726. [DOI] [PubMed] [Google Scholar]
- 21. Pinto‐Sietsma SJ, Janssen WM, Hillege HL, Navis G, De Zeeuw D, De Jong PE. Urinary albumin excretion is associated with renal functional abnormalities in a nondiabetic population. J Am Soc Nephrol 2000;11:1882–1888. [DOI] [PubMed] [Google Scholar]
- 22. Voors AA, Ouwerkerk W, Zannad F, van Veldhuisen DJ, Samani NJ, Ponikowski P, Ng LL, Metra M, Ter Maaten JM, Lang CC, Hillege HL, van der Harst P, Filippatos G, Dickstein K, Cleland JG, Anker SD, Zwinderman AH. Development and validation of multivariable models to predict mortality and hospitalization in patients with heart failure. Eur J Heart Fail 2017;19:627–634. [DOI] [PubMed] [Google Scholar]
- 23. Aird WC. Phenotypic heterogeneity of the endothelium: I. Structure, function, and mechanisms. Circ Res 2007;100:158–173. [DOI] [PubMed] [Google Scholar]
- 24. Zewinger S, Rauen T, Rudnicki M, Federico G, Wagner M, Triem S, Schunk SJ, Petrakis I, Schmit D, Wagenpfeil S, Heine GH, Mayer G, Floege J, Fliser D, Grone HJ, Speer T. Dickkopf‐3 (DKK3) in urine identifies patients with short‐term risk of eGFR loss. J Am Soc Nephrol 2018;29:2722–2733. [DOI] [PMC free article] [PubMed] [Google Scholar]
- 25. Schunk SJ, Zarbock A, Meersch M, Kullmar M, Kellum JA, Schmit D, Wagner M, Triem S, Wagenpfeil S, Grone HJ, Schafers HJ, Fliser D, Speer T, Zewinger S. Association between urinary dickkopf‐3, acute kidney injury, and subsequent loss of kidney function in patients undergoing cardiac surgery: an observational cohort study. Lancet 2019;394:488–496. [DOI] [PubMed] [Google Scholar]
- 26. Schunk SJ, Speer T, Petrakis I, Fliser D. Dickkopf 3‐a novel biomarker of the ‘kidney injury continuum’. Nephrol Dial Transplant 2020 Feb 5. 10.1093/ndt/gfaa003. [DOI] [PubMed] [Google Scholar]
- 27. Federico G, Meister M, Mathow D, Heine GH, Moldenhauer G, Popovic ZV, Nordstrom V, Kopp‐Schneider A, Hielscher T, Nelson PJ, Schaefer F, Porubsky S, Fliser D, Arnold B, Grone HJ. Tubular Dickkopf‐3 promotes the development of renal atrophy and fibrosis. JCI Insight 2016;1:e84916. [DOI] [PMC free article] [PubMed] [Google Scholar]
- 28. Yu B, Kiechl S, Qi D, Wang X, Song Y, Weger S, Mayr A, Le Bras A, Karamariti E, Zhang Z, Barco Barrantes ID, Niehrs C, Schett G, Hu Y, Wang W, Willeit J, Qu A, Xu Q. A cytokine‐like protein Dickkopf‐related protein 3 is atheroprotective. Circulation 2017;136:1022–1036. [DOI] [PMC free article] [PubMed] [Google Scholar]
- 29. Zenzmaier C, Sklepos L, Berger P. Increase of Dkk‐3 blood plasma levels in the elderly. Exp Gerontol 2008;43:867–870. [DOI] [PubMed] [Google Scholar]
- 30. Krupnik VE, Sharp JD, Jiang C, Robison K, Chickering TW, Amaravadi L, Brown DE, Guyot D, Mays G, Leiby K, Chang B, Duong T, Goodearl AD, Gearing DP, Sokol SY, McCarthy SA. Functional and structural diversity of the human Dickkopf gene family. Gene 1999;238:301–313. [DOI] [PubMed] [Google Scholar]
- 31. Tillet E, Ouarne M, Desroches‐Castan A, Mallet C, Subileau M, Didier R, Lioutsko A, Belthier G, Feige JJ, Bailly S. A heterodimer formed by bone morphogenetic protein 9 (BMP9) and BMP10 provides most BMP biological activity in plasma. J Biol Chem 2018;293:10963–10974. [DOI] [PMC free article] [PubMed] [Google Scholar]
- 32. Hagdorn QAJ, Bossers GPL, Koop AMC, Piek A, Eijgenraam TR, van der Feen DE, Sillje HHW, de Boer RA, Berger RMF. A novel method optimizing the normalization of cardiac parameters in small animal models: the importance of dimensional indexing. Am J Physiol Heart Circ Physiol 2019;316:H1552–H1557. [DOI] [PubMed] [Google Scholar]
Associated Data
This section collects any data citations, data availability statements, or supplementary materials included in this article.
Supplementary Materials
Appendix S1. Methods.
Table S1. Raw data of a selection of genes as analyzed in the bioinformatics analysis. Table showing the raw data and calculation procedures of a selection of genes encoding established and suggested HF biomarkers. Expression levels are shown for the heart separately and for the total body (for male and female tissues separately). Finally, the cardiac specificity of listed genes as calculated by the formula as described in Figure 1 is shown. Expression levels are represented as absolute read values in RNAseq as performed and published by Fagerberg et al. 13 Included organs and tissues in total body expression levels are adipose tissue, adrenal gland, appendix, bone marrow, brain colon, duodenum, esophagus, gall bladder, heart, kidney, liver, lung, lymph node, pancreas, salivary gland, skin, small intestine, spleen, stomach, thyroid gland, and prostate and testis for male, and endometrium and ovary for female. BMP‐10=Bone morphogenic protein 10. DKK3=Dickkopf‐3. GDF‐15=Growth differentiation factor 15. HE4=Human epididymis protein 4. IGFBP‐7=Insulin growth factor binding protein 7. IL‐6=Interleukin‐6. LGALS3=Gene encoding galectin‐3. MPO=Myeloperoxidase. NPPA=Natriuretic peptide precursor type A. NPPB=Natriuretic peptide precursor type B. TIMP‐1=Tissue inhibitor of metalloproteinase‐1.
Table S2. Oligonucleotide pairs used for RT‐qPCR. Oligonucleotide pairs used for real‐time quantitative polymerase chain reaction. DKK3=Dickopf‐3. NPPA=Natriuretic peptide precursor type A.
Table S3. Stability of human DKK3 in plasma. Included treatments are four freeze‐thaw cycles, storage of plasma samples at 4°C for 48 hours and storage of a plasma sample at room temperature for 48 hours. DKK3 values are shown as mean ± standard deviation. N=3 per group. DKK3=Dickkopf‐3.
Table S4. Hemodynamics, cardiac dimensions and left ventricular remodeling in TAC, MI and obese/hypertensive mice. Data are presented as means ± standard error of the mean. AngII=Angiotensin‐II (final 4wks of 16wks HFD). CMR=Cardiac magnetic resonance imaging. dP/dTmax=Measure for left ventricular maximal contraction capacity, here corrected for maximal ventricular pressure. dP/dTmin=Measure for left ventricular maximal relaxation capacity, here corrected for maximal ventricular pressure. HFD=High fat diet (16wks). LFD=Low fat diet (16wks). LV=Left ventricle. LVEDV=Left ventricular end‐diastolic volume. LVEF=Left ventricular ejection fraction. LVESP=Left ventricular end‐systolic pressure. LVESV=Left ventricular end‐systolic volume. MI=Myocardial infarction (8wks). P‐catheter=Pressure catheter. TAC=Transverse aortic constriction (8wks). LV weight is corrected for tibia length to the power of 332. N=6‐20. *P < 0.05 versus respective sham group for TAC and MI, or LFD for HFD and HFD+AngII. #P<0.05 versus HFD. Data as published before in Theranostics9 and Scientific Reports19, but presented here for convenience.
Table S5. Baseline characteristics of patients with heart failure, and age and sex matched controls. Data are presented as means ± standard deviation for normally distributed variables, as medians (interquartile range) for non‐normally distributed variables and as percentage (n) for categorical variables. BMI=Body mass index. DKK3=Dickkopf‐3. eGFR=Estimated glomerular filtration rate. Maximum age used for these comparisons was 75 years. Control subjects were selected for having no history of myocardial infarction, cerebrovascular accidents or renal disease and no eGFR < 60. *P < 0.05.
Table S6. Relationship between DKK3 plasma levels and baseline characteristics. The relationship between DKK3 plasma concentrations and baseline characteristics as analyzed by univariate linear regression and age‐adjusted linear regression analysis. Sβ=Standardized beta coefficient. †=Log‐transformed. Abbreviations as in Table 1. *P < 0.05.
Table S7. Heart failure outcome prediction models and the effect of DKK3 on predictive performance. The effect of DKK3 on the predictive performance of heart failure outcome prediction models is analyzed by Harrell's C‐statistic, NRI and IDI. Results are shown for the three endpoints, including the primary endpoint (HF‐hospitalization and all‐cause mortality), all‐cause mortality and cardiovascular mortality. For the primary endpoint the prediction model includes includes age, previous HF hospitalization in last year, peripheral edema, SBP, NT‐proBNP, hemoglobin, HDL, sodium and betablocker usage. For all‐cause mortality the prediction model includes age, NT‐proBNP, BUN, hemoglobin and betablocker usage. For cardiovascular mortality the prediction model includes the variables included in the multivariable model as presented in Table 2. DKK3=Dickkopf‐3. IDI=Integrated discrimination index. NRI=Net reclassification index. Other abbreviations as in Table 1. DKK3 did not significantly improve any of the models.
Figure S1. Cardiac specificity of the human genome and heart failure (HF) biomarkers, including female tissues. (A) Graphs showing the cardiac specificity of the human genome (top) and of secreted protein encoding genes (bottom), showing numbers of genes included. Coloured areas represent the amount of genes with corresponding degrees of specificity. (B) The cardiac specificity of several HF biomarkers. Coloured areas represent organ specificity. Gal‐3, galectin‐3; GDF‐15, growth differentiation factor 15; GI tract, gastrointestinal tract, including appendix, colon, duodenum, oesophagus, small intestine and stomach; NPPB, natriuretic peptide precursor type B; sex organs, endometrium and ovary; TIMP‐1, tissue inhibitor of metalloproteinase 1. Organs and tissues included are adipose tissue, adrenal gland, appendix, bone marrow, brain, colon, duodenum, gall bladder, heart, kidney, liver, lung, lymph node, oesophagus, pancreas, salivary gland, skin, small intestine, spleen, stomach and thyroid gland, and female sex‐specific tissues. The bioinformatics analysis was based on publicly available RNAseq data previously published by Fagerberg et al. 13
Figure S2. Cardiac specificity of suggested heart failure (HF) biomarkers. The total cardiac expression of secreted protein encoding genes was plotted against their calculated cardiac specificity. Data for suggested HF biomarkers are shown, including insulin‐like growth factor‐binding protein 7 (IGFBP‐7), tissue inhibitor of metalloproteinase 1 (TIMP‐1), LGALS3 (gene encoding galectin‐3), interleukin‐6 (IL‐6), human epididymis protein 4 (HE4), myeloperoxidase (MPO) and growth differentiation factor 15 (GDF‐15). Organs and tissues included are adipose tissue, adrenal gland, appendix, bone marrow, brain, colon, duodenum, gall bladder, heart, kidney, liver, lung, lymph node, oesophagus, pancreas, salivary gland, skin, small intestine, spleen, stomach and thyroid gland, and male sex‐specific tissues (prostate and testis). The bioinformatics analysis was based on publicly available RNAseq data previously published by Fagerberg et al. 13
Figure S3. Cardiac specificity of secreted protein encoding genes, including female tissues. Total cardiac expression of secreted protein encoding genes was plotted against their calculated cardiac specificity. All genes with cardiac specificity >10% are shown. Gene name abbreviations are used for readability. Organs and tissues included are adipose tissue, adrenal gland, appendix, bone marrow, brain, colon, duodenum, gall bladder, heart, kidney, liver, lung, lymph node, oesophagus, pancreas, salivary gland, skin, small intestine, spleen, stomach and thyroid gland, and female‐specific tissues (endometrium and ovary). The bioinformatics analysis was based on publicly available RNAseq data previously published by Fagerberg et al. 13
Figure S4. Cardiac specificity of suggested heart failure (HF) biomarkers. The total cardiac expression of secreted protein encoding genes was plotted against their calculated cardiac specificity. Data for suggested HF biomarkers is shown, including insulin‐like growth factor‐binding protein 7 (IGFBP‐7), tissue inhibitor of metalloproteinase 1 (TIMP‐1), LGALS3 (gene encoding galectin‐3), interleukin‐6 (IL‐6), human epididymis protein 4 (HE4), myeloperoxidase (MPO) and growth differentiation factor 15 (GDF‐15). Organs and tissues included are adipose tissue, adrenal gland, appendix, bone marrow, brain, colon, duodenum, gall bladder, heart, kidney, liver, lung, lymph node, oesophagus, pancreas, salivary gland, skin, small intestine, spleen, stomach and thyroid gland, and female‐specific tissues (endometrium and ovary). The bioinformatics analysis was based on publicly available RNAseq data previously published by Fagerberg et al. 13
Figure S5. Expression of Dickkopf‐3 (DKK3) in multiple organs and tissues. Cardiac specificity of DKK3 according to the bioinformatics analysis, which was based on publicly available RNAseq data previously published by Fagerberg et al. 13 The left graph includes male sex‐specific organs (prostate and testis). The right graph includes female sex‐specific organs (endometrium and ovary). Organs and tissues included are adipose tissue, adrenal gland, appendix, bone marrow, brain, colon, duodenum, gall bladder, heart, kidney, liver, lung, lymph node, oesophagus, pancreas, salivary gland, skin, small intestine, spleen, stomach and thyroid gland. GI tract, gastrointestinal tract.
Figure S6. Dickkopf‐3 (DKK3) gene expression in liver, kidney and lung tissue of mice in three heart failure (HF) mouse models: (i) transverse aortic constriction (TAC); (ii) myocardial infarction (MI), and (iii) an obese/hypertension mouse model (HFD and HFD + AngII). Included organs are (A) left ventricle (LV), (B) liver, (C) kidney and (D) lung. AngII, Angiotensin‐II; DKK3, Dickkopf‐3; HFD, high fat diet. Gene expression values are corrected for 36B4 gene expression and presented as fold change. Bars represent means. Error bars represent standard errors of the mean. The striped line represents expression levels in the control. *P < 0.05 vs. control.
Figure S7. Dickkopf‐3 (DKK3) gene expression in mouse left ventricle (LV), liver, kidney and lung tissue in the low fat diet (LFD) group of the obesity/hypertension mouse model. Gene expression values are corrected for 36B4 gene expression and presented as fold change compared with expression in LV. Bars represent means. Error bars represent standard errors of the mean. *P < 0.05 vs. LV. #P < 0.05 vs. group as indicated.
Figure S8. Correlation matrix showing the associations between cardiac Dickkopf‐3 (DKK3) expression, plasma DKK3 levels and indices of cardiac remodelling in the transverse aortic constriction (TAC), 8 weeks, mouse model. Data are shown as Pearson's correlation coefficients. Colours indicate the degree and direction of the correlation coefficient, with red shades indicating positive correlations and blue shades indicating negative correlations. Left ventricle (LV) weight is corrected for tibia length to the power of 3. 32 dP/dTmax, measure for LV maximal contraction capacity, here corrected for maximal ventricular pressure; dP/dTmin, measure for LV maximal relaxation capacity, here corrected for maximal ventricular pressure; LVEDV, LV end‐diastolic volume; LVEF, LV ejection fraction; LVESP, LV end‐systolic pressure; LVESV, LV end‐systolic volume. *P < 0.05.
Figure S9. Correlation matrix showing the associations between cardiac Dickkopf‐3 (DKK3) expression, plasma DKK3 levels and indices of cardiac remodelling in the myocardial infarction (MI), 8 weeks, mouse model. Data are shown as Pearson's correlation coefficients. Colours indicate the degree and direction of the correlation coefficient, with red shades indicating positive correlations and blue shades indicating negative correlations. Left ventricle (LV) weight is corrected for tibia length to the power of 3. 32 dP/dTmax, measure for LV maximal contraction capacity, here corrected for maximal ventricular pressure; dP/dTmin, measure for LV maximal relaxation capacity, here corrected for maximal ventricular pressure; LVEDV, LV end‐diastolic volume; LVEF, LV ejection fraction; LVESP, LV end‐systolic pressure; LVESV, LV end‐systolic volume. *P < 0.05.
Figure S10. Correlation matrix showing the associations between cardiac Dickkopf‐3 (DKK3) expression, plasma DKK3 levels and indices of cardiac remodelling in the obesity/hypertension (HFD/AngII) mouse model. Data are shown as Pearson's correlation coefficients. Colours indicate the degree and direction of the correlation coefficient, with red shades indicating positive correlations and blue shades indicating negative correlations. Left ventricular (LV) weight is corrected for tibia length to the power of 3. 32 AngII, angiotensin‐II (final 4 weeks of 16 weeks HFD); dP/dTmax, measure for LV maximal contraction capacity, here corrected for maximal ventricular pressure; dP/dTmin, measure for LV maximal relaxation capacity, here corrected for maximal ventricular pressure; HFD, high fat diet (16 weeks); LFD, low fat diet (16 weeks); LVEDV, LV end‐diastolic volume; LVEF, LV ejection fraction; LVESP, LV end‐systolic pressure; LVESV, LV end‐systolic volume. *P < 0.05.
Figure S11. Dickkopf‐3 (DKK3) plasma concentrations in heart failure (HF) patients vs. age‐ and sex‐matched controls without HF. (A, B) DKK3 plasma levels in patients with HF and age‐ and sex‐matched healthy controls from PREVEND. (A) Comparison of DKK3 plasma levels in HF patients vs. controls. (B) Comparison of DKK3 plasma levels in controls, and in HF patients according to NT‐proBNP. P < 0.05 vs. control. #P < 0.05 vs. all other quartiles.
Figure S12. Kaplan–Meier curves based on Dickkopf‐3 (DKK3) quintiles. (A–C) Kaplan–Meier curves based on DKK3 quintiles in patients with heart failure (HF) for (A) the composite endpoint (HF hospitalization and all‐cause mortality), (B) cardiovascular mortality, and (C) all‐cause mortality. DKK3 quintiles are <38.8, 38.8–45.7, 45.8–53.2, 53.3–65.8 and >65.8 ng/mL. Log‐rank tests were significant for all endpoints.