Abstract
Ru/Al2O3 is a highly stable, but less active catalyst for methanation reactions. Herein we report an effective approach to significantly improve its performance in the methanation of CO2/H2 mixtures. Highly active and stable Ru/γ‐Al2O3 catalysts were prepared by high‐temperature treatment in the reductive reaction gas. Operando/in situ spectroscopy and STEM imaging reveals that the strongly improved activity, by factors of 5 and 14 for CO and CO2 methanation, is accompanied by a flattening of the Ru nanoparticles and the formation of highly basic hydroxylated alumina sites. We propose a modification of the metal–support interactions (MSIs) as the origin of the increased activity, caused by modification of the Al2O3 surface in the reductive atmosphere and an increased thermal mobility of the Ru nanoparticles, allowing their transfer to modified surface sites.
Keywords: CO2 methanation, Lewis basic sites, Metal–support interactions, operando spectroscopy, particle shape
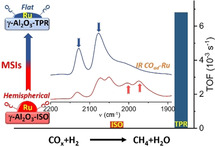
Substantial enhancement of the activity of Ru/γ‐Al2O3 catalyst for the methanation of CO2 results from an unusual modification of the metal–support interaction between Ru nanoparticles (NPs) and γ‐Al2O3, which causes a significant increase of support basicity and restructuring of Ru NPs from hemispherical to flat.
Introduction
The methanation of CO2 has attracted enormous interest recently, both as a possible means for curbing greenhouse gases and to chemically store excess electric energy from fluctuating renewable sources, which was discussed and considered as an important part of “power‐to‐gas” concepts.[ 1 , 2 , 3 ] Supported Ni catalysts are generally considered as standard catalyst for this reaction, but they are little active at low temperature (<300 °C) and also suffer from deactivation due to sintering via Ni(CO)4 formation.[ 4 , 5 ] Supported Ru catalysts, which are more active and stable at lower temperatures, are therefore an attractive alternative for applications where lower temperatures are beneficial, despite of their higher costs.[ 3 , 4 ] It quickly turned out that also the nature of the oxide support plays an important role, [6] with a superior activity for Ru nanoparticles (NPs) supported on reducible oxides (TiO2 or CeO2) [7] compared to much less active catalysts based on inert oxides such as Al2O3.[ 8 , 9 ] Because of their significantly higher stability during reaction, however, Ru/Al2O3 catalysts would be an attractive alternative, provided their activity could be enhanced to the level of Ru/TiO2. We demonstrated recently that the activity of Ru/TiO2 catalysts for CO2 methanation could be significantly improved by a high temperature reaction treatment in reductive atmosphere, which we had attributed to a modification of the metal‐support interactions (MSIs), [10] for example, by stabilization of metal NPs and/or charge transfer effects.[ 6 , 11 , 12 ] Variation in the catalytic performance due to modification of MSIs has been considered for decades for noble metal catalysts supported on reducible oxides under reductive reaction conditions,[ 13 , 14 , 15 , 16 ] including also CO2 hydrogenation,[ 10 , 17 , 18 ] but not for stable (inert) oxides such as Al2O3. [6] Recent experimental and theoretical studies, however, indicated a stabilization of noble metals on penta‐coordinated Al3+ sites, reflecting a modification of the MSIs that could lead also to the formation of flat NPs.[ 19 , 20 , 21 ] This and also the hydroxylation of alumina were postulated to affect the CO2 dissociation. [20] Stimulated by these earlier findings and proposals we decided to explore the possibility of modifying the MSIs in a Ru/γ‐Al2O3 catalyst by a high‐temperature treatment in the reaction gas atmosphere, employing a combination of in situ/ operando FTIR and X‐ray absorption spectroscopy (XAS) measurements, coupled with CO/ pyrrole adsorption measurements and ex situ techniques for catalyst characterization. If successful, this work will not only introduce a new and efficient approach for fabricating highly active and stable Ru/γ‐Al2O3 catalysts for COx methanation, but also lead to a significantly improved fundamental understanding of the role of MSIs in metal catalysts supported on irreducible oxides.
Results and Discussion
Ru/γ‐Al2O3 catalysts with ≈2.3 wt. % Ru loading were prepared by incipient wetness impregnation. [6] We first evaluated the activity of the Ru/γ‐Al2O3 catalyst in the methanation of CO2 in a CO2/H2 mixture (CO2‐ref: 15.5 % CO2, 80.9 % H2, N2 balance) at 190 °C for 1000 min (190 °C‐1 phase). Next we stepwise increased the temperature from 210 to 350 °C in a temperature programmed reaction (TPR) sequence, followed by a second reaction phase at 190 °C (190 °C‐2 phase) for 1000 min (Experimental section, Supporting Information (SI)). In the 190 °C‐1 phase, the catalyst showed a stable CO2 methanation activity with a rate of ≈2.7 μmolCH4 gRu −1 s−1 (TOF: 4.0×10⁻⁴ s−1) and 100 % selectivity for methane formation, with no evidence for the formation of gaseous CO via the reverse water‐gas shift (RWGS) reaction. During the TPR sequence, the CO2 conversion increased with temperature, reaching 61 % at 350 °C, while keeping its high selectivity for methane formation (Figure 1 a). Interestingly, after cooling down to 190 °C‐2 phase, the catalyst showed a much higher activity (40.5 μmolCH4 gRu −1 s−1) than in the 190 °C‐1 phase, while keeping essentially 100 % selectivity for methane formation (Figure 1 b). After less than 5 % deactivation over 200 min on stream, the steady‐state activity in the 190 °C‐2 phase leveled off at ≈38.3 μmolCH4 gRu −1 s−1 (TOF: 6.8×10⁻³ s−1), which is ≈14 times higher than in the 190 °C‐1 phase.
Figure 1.
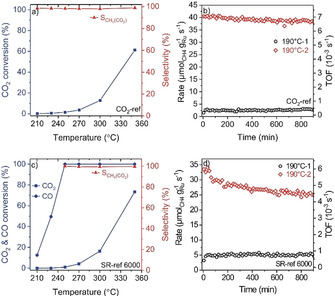
a) CO2 conversion and selectivity for methane formation (SCH4(CO2)=RCH4 (CH4 formation)/ R(CO2 consumption)) in CO2‐ref in the range 210 to 350 °C. b) Temporal evolution of the Ru‐mass‐normalized CO2 methanation rate and the corresponding TOFs in CO2‐ref reformate gas during isothermal reaction in the 190 °C‐1 and 190 °C‐2 phases. c) CO/ CO2 conversion and the selectivity for CO2 methanation (see above) during reaction in SR‐ref 6000 reformate gas in the range 210 to 350 °C. d) Temporal evolution of the Ru‐mass‐normalized CO methanation rate and the corresponding TOFs during reaction in SR‐ref 6000 reformate gas in the 190 °C‐1 and 190 °C‐2 phases.
To unravel the influence of trace impurities of CO on CO2 hydrogenation, we examined the CO2 methanation in the presence of CO traces (SR‐ref 6000: 15.5 % CO2, 0.6 % CO, 80.9 % H2, N2 balance). During the 190 °C‐1 phase, the catalyst showed only CO methanation (no CO2 conversion), with a rather low rate of ≈5.0 μmolCH4 gRu −1 s−1 (TOF: 7.6×10⁻⁴ s−1) for 1000 min. The inhibition of CO2 methanation under these conditions was previously explained and discussed in detail by COad induced site blocking effects.[ 22 , 23 ] During the TPR sequence, full CO conversion was reached at 250 °C (Figure 1 c). At that point, CO2 methanation started and increased with temperature, reaching a conversion of ≈73 % at 350 °C, with close to 100 % selectivity towards methane formation (no RWGS activity). After cooling back to 190 °C‐2, we did not see any evidence for CO2 methanation. The increase in CO2 methanation activity during the TPR sequence is largely similar to that observed in CO2‐ref reformate gas (in the absence of CO), indicating that the under these conditions the CO traces do not affect the CO2 methanation behavior. Furthermore, we observed a ≈5 times higher CO methanation rate in the 190 °C‐2 phase compared to that in the 190 °C‐1 phase (Figure 1 d). This higher rate is comparable to that reported on Ru/TiO2 and Ru/zeolite catalysts, so far the most active Ru‐based catalysts for (selective) CO methanation,[ 8 , 23 , 24 , 25 ] but with a significantly higher stability of the Ru/γ‐Al2O3 catalyst (Table S1, SI).
To examine the impact of CO2 on the observed enhancement of the CO methanation activity, we tested the CO methanation behavior in a CO2‐free gas mixture (ID‐ref 6000: 0.6 % CO, 80.9 % H2, N2 balance). This test showed an essentially similar behavior as for the CO methanation in the SR‐ref 6000 gas mixture, with little difference in the Ru‐mass‐normalized rates (see details in Figure S1, SI). Overall, the TPR sequence results in a pronounced enhancement both of CO2 and CO methanation rates on Ru/γ‐Al2O3 catalyst, while CO traces do not measurably affect the CO2 methanation performance.
To elucidate the physical origin of these changes in reactivity, we characterized the structural properties of the Ru/γ‐Al2O3 catalyst after the 190 °C‐1 phase in SR‐ref 6000 reformate (Ru/γ‐Al2O3‐ISO), and after the TPR sequence and the subsequent 190 °C‐2 phase (Ru/γ‐Al2O3‐TPR), respectively.
XRD measurements indicated that the cubic γ‐Al2O3 phase is retained after the TPR sequence, without any measurable bulk structural changes. The diffraction patterns did not show any Ru reflections, as expected for the very small Ru NPs in these catalysts (Figure S2, SI). Also the specific surface areas (127±4 m2 g−1) and porosity (volume: 0.91 cm3 g−1, pore diameter: 22 nm) remained unchanged, confirming the stability of the γ‐Al2O3 bulk structure during the TPR sequence (Table S2, SI). The structure of γ‐Al2O3 was also examined by 27Al magic angle sample spinning (MAS) NMR spectroscopy, after calcination and after the 190 °C‐1 and 190 °C‐2 phases (Figure S3, SI). We can clearly identify the Al3+ ions in octahedral (Ao, 7 ppm) and tetrahedral (At, 63 ppm) coordination sites on the three catalysts, while the concentration of pentahedral Al3+ sites (Alp) was below the detection limit of the NMR measurements. [19] Comparison of the NMR spectra indicated no significant changes in the spectra, indicating that there is no measurable change in the coordination environment of Al3+.
Furthermore, the structure of the catalysts was examined by (S)TEM (Figure 2 a,c). Comparison of HAADF‐STEM images recorded before and after the TPR sequence reveals the presence of very small Ru NPs with sizes in the range of 1–5 nm (see also Figure S4, SI). Ru particle size distributions, obtained by evaluating over 600 NPs in (S)TEM images (Figure 2 b,d), revealed a slight increase of the mean Ru particle size from 1.5±0.4 nm for the Ru/γ‐Al2O3‐ISO catalyst to 1.7±0.5 nm for the Ru/γ‐Al2O3‐TPR catalyst. (S)TEM measurements performed after reaction in CO2‐ref gas mixture under similar reaction conditions revealed mean particle sizes for the two catalysts (Figure S5, SI), which are essentially identical to those obtained after reaction in SR‐ref 6000 reformate gas. Hence, the presence of CO in the feed gas (in SR‐ref 6000) has little effect on the size/ distribution of the Ru NPs after CO2 hydrogenation.
Figure 2.
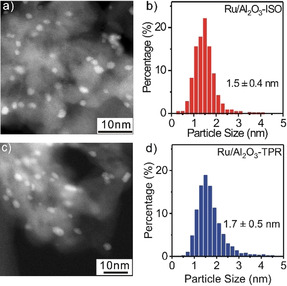
Representative HAADF‐STEM images and Ru particle size distributions. a),b) Ru/γ‐Al2O3‐ISO and c),d) Ru/γ‐Al2O3‐TPR catalysts.
Furthermore, we evaluated the shape of the Ru NPs by analyzing more than 600 Ru NPs on the (S)TEM images, following an approach described earlier.[ 6 , 11 , 12 ] Briefly, this is based on determining the ratio of the shortest diameter (R1) to the longest diameter (R2) of the two‐dimensional projection of each Ru NP (Figure 3 a). Low R1/R2 ratios are expected for flat particles. Those particles observed from the side appear with an elliptic shape, while those viewed from the top should appear circular (Figure 3 b,d). Spherical particles, in contrast, should always appear with circular projection, independent of the imaging angle (Figure 3 b). The fraction of Ru particles with a ratio ≤0.8 was about 42 % in the Ru/γ‐Al2O3‐ISO catalyst (Figure 3 c), while for Ru/γ‐Al2O3‐TPR this increased to ≈69 % (Figure 3 e), indicating an irreversible flattening of the Ru NPs during the TPR sequence. Further information on TPR induced changes of the Ru NPs was obtained from diffuse reflectance FTIR (DRIFTS) spectroscopy measurements during CO adsorption at 30 °C. Both before and after the TPR sequence the catalysts showed typical bands of COad species in the range from 1900 to 2170 cm−1 (Figure 4 a). Assuming similar cross‐sections for different COad species, the COad coverage on the Ru NPs in Ru/γ‐Al2O3‐TPR is 1.4 times higher than in Ru/γ‐Al2O3‐ISO. Since changes in the COad saturation coverage on that scale are unlikely, this points to an increase in surface area of the Ru NPs after the TPR sequence. Considering the little variation of the Ru NP size upon the TPR sequence, this would be consistent with the change in particle shape towards flat configurations, sufficient to overcompensate the loss of surface area due to the subtle increase in mean Ru particle size upon the TPR sequence.
Figure 3.
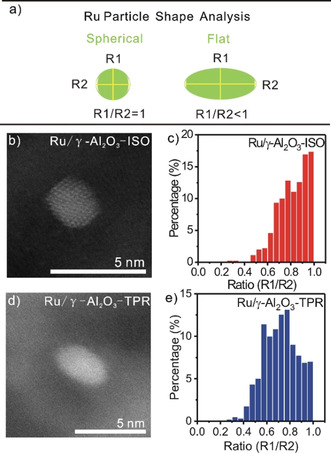
Ru particle shape analysis probed by (S)TEM. Schematic illustration of the particle shape analysis based on the TEM images (a). Representative HAADF‐STEM images of the Ru/γ‐Al2O3‐ISO (b) and Ru/γ‐Al2O3‐TPR (d) catalysts, and diameter ratio distributions of the respective catalysts (c,e). Additional representative (S)TEM images used for size and shape evaluation are shown in Figure S4, Supporting Information.
Figure 4.
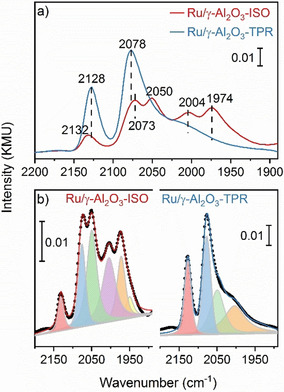
Ru particle shape analysis probed by in situ IR spectroscopy. a) DRIFT spectra showing the COad band region of Ru/γ‐Al2O3‐ISO and Ru/γ‐Al2O3‐TPR catalysts. Spectra were recorded under steady‐state conditions during low‐temperature (30 °C) CO adsorption from 1 % CO/ N2. b) Deconvolution of the spectra in (a).
FTIR spectra of the COad region and fits of the individual contributions are presented in Figure 4. The pronounced bands at 2128 and 2078 cm−1 seem to be characteristic for COad on the Ru/γ‐Al2O3‐TPR catalyst, where their intensity is much higher than on Ru/γ‐Al2O3‐ISO. In contrast, the bands at 1974 and 2004 cm−1 and a weak contribution around 1950 cm−1 are characteristic for COad on the Ru/γ‐Al2O3‐ISO catalyst, where their intensities are much higher than for Ru/γ‐Al2O3‐TPR. The band at 2050 cm−1 shows about similar intensities on both catalysts, but considering the lower total COad band intensity on Ru/γ‐Al2O3‐ISO the relative contribution of the related COad species is lower on the Ru/γ‐Al2O3‐TPR catalyst.
Bands at ≈2130 cm−1 were assigned to Ru‐multicarbonyl species adsorbed at undercoordinated Ru atoms, e.g., at the periphery interface sites of the Ru NPs, with more than one CO adsorbed on low‐coordination Ru atoms.[ 21 , 26 , 27 ] In a recent study, bands ≈2070–2080 cm−1 were assigned to asymmetric stretch vibrations of the above species and to CO on‐top adsorbed on Ru sites that are electronically modified by interaction with the substrate (“monolayer sites”), [21] e.g., sites at the interface perimeter.[ 16 , 28 ] Bands in the range 2000–2050 cm−1 were associated with on‐top CO adsorbed on Ru NPs,[ 21 , 26 , 27 ] while bands below that range were attributed with bridge‐bonded CO. [28]
Based on the band intensities (Figure 4 b), the fraction of the COad species characteristic for the flat Ru NPs (bands at 2078 and 2132 cm−1) increased from 23 % for Ru/γ‐Al2O3‐ISO to 49 % for Ru/γ‐Al2O3‐TPR. The higher abundance of CO in multicarbonyl and monolayer Ru sites on the Ru/γ‐Al2O3‐TPR catalyst is in perfect agreement with the conclusion derived from (S)TEM imaging that the Ru particles in the Ru/γ‐Al2O3‐TPR catalyst are flatter and stabilized by stronger interaction with the modified substrate. In that case, we would expect an increase in island edges, the formation of a large fraction of “monolayer sites”, and a decrease of sites typical for hemispherical particles. The fact that there is some intensity at 2130 and at 2070 cm−1 also on the Ru/γ‐Al2O3‐ISO catalyst can simply be explained by the fact that also i) on this hemispherical catalyst undercoordinated sites exist at the periphery of the interface that can give rise to these COad species and that ii) this catalyst also contains flat particles, but fewer and less pronounced. Correspondingly, the fraction of COad species typical for CO adsorption on small hemispherical Ru NPs decreases upon the TPR sequence.
Next we examined the coordination of the Ru atoms in the Ru NPs during reaction by operando EXAFS measurements at the Ru K‐edge. Fourier transforms of representative spectra in (SR‐ref 6000) are shown in Figure 5 a. Here it should be noted that the shorter reaction times during operando XAS measurements are still sufficient to essentially reach steady‐state conditions (see details in Experimental section, SI)). After calcination, the Ru/γ‐Al2O3 catalyst showed a dominant Ru‐O coordination shell at a distance of 2.2±0.1 Å, with Ru‐O coordination numbers (CNRu‐O) of 5.0±0.5 (fit parameters in Table S3, SI). Upon switching to the reaction gas (190 °C‐1), the CNRu‐O decreased rapidly, being negligible already after 5 min, while the corresponding CNRu‐Ru values increased to 3.2±0.5 and grew further to 5.7±0.5 after 30 min on stream. For the remaining time at 190 °C‐1 it stayed constant. Hence, reduction of the oxidic Ru NPs to metallic Ru NPs occurs in the first few minutes during reaction. During the TPR sequence and the 190 °C‐2 phase, the CNRu‐Ru value remained unchanged at 5.5±0.5 (Figure 5 a and Figure S6, SI). Considering that the CN of Ru‐Ru is determined by Ru particle size and shape, we would expect an increase in the CN for an increase in particle size and a decrease for a flattening of the particles. The constant CNRu‐Ru value upon the TPR sequence can be rationalized by a counterbalance between the small increase in mean particle diameter, from 1.5 to 1.7 nm, and the change in particle shape, from hemispherical to flat.
Figure 5.
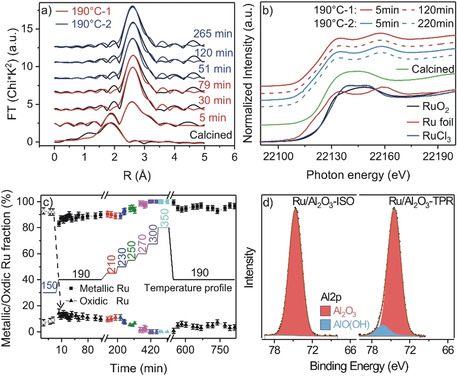
a) Fourier transformed EXAFS spectra in R‐space recorded at the Ru K‐edge in N2 after calcination and at different reaction times on the Ru/γ‐Al2O3 catalyst in SR‐ref 6000 at 190 °C (black lines: measured EXAFS data, red/ blue lines: fit data (red: during 190 °C‐1, blue: during 190 °C‐2). b) XANES spectra of references (Ru foil, RuO2, RuCl3 powder) and of the Ru/γ‐Al2O3 catalyst in N2 after calcination and during reaction in SR‐ref 6000 at 190 °C at different reaction times. c) Fractions of metallic Ru (square symbols) and oxidic Ru species (RuO2 and RuCl3: triangular symbols) as a function of time as derived from a LCA analysis of the XANES spectra of the Ru/γ‐Al2O3 catalyst. d) XP spectra of the Al 2p region of the Ru/γ‐Al2O3‐ISO and Ru/γ‐Al2O3‐TPR catalysts, respectively. Note that the FWMH of the major Al 2p component of the Ru/γ‐Al2O3‐TPR was fixed at the same value of the Al 2p peak of the Ru/γ‐Al2O3‐ISO sample (FWHM=2.35 eV).
Further information on the chemical state of the Ru NPs was obtained from the XANES spectra (Figure 5 b). The spectra recorded after calcination at 150 °C show a strong white line contribution between 22 120 and 22 160 eV, whose shape is a combination of the RuO2 and RuCl3 references. Only 5 min after switching to the reaction gas, the white line intensity has decreased dramatically and then remained almost constant, consistent with a very fast reduction of most of the oxidic Ru species (Figure 5 b and Figure S7, SI). Based on a linear combination analysis (LCA) of the XANES region for the Ru/γ‐Al2O3 catalyst the freshly calcined catalyst is composed of ≈92 % oxidic and ≈8 % metallic Ru species (Figure 5 c and Figure S8, SI). The contribution of metallic Ru species in the Ru/γ‐Al2O3 catalyst increased to ≈83 % in the first 5 min reaction at 190 °C‐1 and further to ≈88 % at extended reaction times. During the TPR sequence, specifically at 300–350 °C, the Ru species became even 100 % metallic. However, after cooling back to 190 °C, the content of metallic Ru species decreased slightly to ≈95 % during the first 40 min and then remained at this value. The slight re‐oxidation fits well to the observed initial slight deactivation after the TPR sequence.
XPS measurements (Figure 5 d and Figure S9, SI) revealed that the binding energies (BEs) of the main Ru 3d5/2 component of the Ru/γ‐Al2O3‐ISO and ‐TPR catalysts are around 280.6±0.1 eV, which in agreement with previous XPS data is slightly higher than the value of metallic Ru. [6] Based on a deconvolution of Ru 3d spectra (Figure S10, SI), the contribution of surface metallic Ru species in the Ru/γ‐Al2O3 catalyst is ≈80 % after 10 min reaction in the 190 °C‐1 phase, increasing to ≈87 % after 1000 min on stream. After the TPR sequence, the contribution of oxidic Ru is hardly visible any more (≈91 % metallic Ru). These ex situ XPS results agree very well with the trend observed by operando XANES results (Figure 5 c). The amount of surface carbon on the Ru/γ‐Al2O3‐ISO and ‐TPR catalysts, as evident from the C 1s signal at ≈284.8 eV, was essentially identical for both catalysts, indicating that the TPR sequence did not lead to increasing carbon deposition. For the Al 2p peak we obtained a BE of 74.6±0.1 eV, which is typical for fully oxidized Al2O3. [29] Interestingly the full width half maximum (FWHM) of the Al 2p peak for the Ru/γ‐Al2O3‐TPR catalyst (2.5±0.05 eV) was significantly larger than that of the Ru/γ‐Al2O3‐ISO catalyst (2.35±0.05 eV). Peak fitting of the Al 2p spectrum of the Ru/γ‐Al2O3‐TPR catalyst results in a good fit if we add a second component at about 76.3 eV with a FWHM=2.35 eV, which comprises about 9.5 % of the Al3+ ions in the γ‐Al2O3‐TPR catalyst. Following a previous assignment,[ 30 , 31 ] we attribute this peak to aluminum oxyhydroxide (AlO(OH)) species. The discrepancy to the NMR results can be explained by the surface sensitivity of XPS measurements.
Information on the adsorption properties of the Ru catalysts, basically COad species and hydroxyl groups, was derived during reaction in SR‐ref 6000 reformate and additionally in ID‐ref 6000 reformate in the absence of CO2 (Figure 6 a,b). The ID‐ref 6000 reformate was chosen to identify changes in the OH bands, which are not accessible in the presence of CO2 due to interference with CO2 combination bands (3500–3800 cm−1). Note that the behavior of COad species during reaction in ID‐ref 6000 is almost identical to that in SR‐ref 6000 (Figure S11–S12, SI). During the 190 °C‐1 phase, we observed bands at 3673 cm−1 and at 3701 cm−1, which had been assigned previously to hydrogen bonded OH and to bridged OH (b‐OH) on sixfold coordinated Al sites (AlVI) of γ‐Al2O3 (110) facets.[ 32 , 33 ] The intensity of these bands increased in the initial 20 min and then remained constant (Figure 6 a). During the TPR sequence we only observed these H‐bonded and bridged OH groups between 210 and 250 °C (left panel in Figure S11, SI). At 270 °C, a new band appeared at 3747 cm−1, which has been calculated as characteristic for terminal OH (t‐OH) on penta‐coordinated Al (Alv) sites of γ‐Al2O3 (110) surfaces, but also for μ3‐type bridged OH (b‐OH111) on hexa‐coordinated AlVI sites of polar (111) facets. [33] The relative concentration of this band increased with increasing temperature up to 350 °C (left panel in Figure S11, SI). Since we cannot distinguish between both species from the present data, we will henceforth denote them as OHTPR species. The previously observed bands at 3673 and 3701 cm−1 shifted to 3680 and 3706 cm−1, respectively (Figure S11, SI). After cooling back to 190 °C, the OH region was dominated by the band at 3747 cm−1, a very small band at 3726 cm−1 may point to water adsorbed on Alv sites of the γ‐Al2O3 surface (Figure 6 b). [33] Overall, these observations point to a distinct, activated modification of the Al2O3 surface during the TPR sequence, reflected by a change in the type of the dominant OH groups. Driving force for this change must be a higher stability of the resulting surface under TPR conditions, which, however, is maintained also during subsequent reaction at 190 °C.
Figure 6.
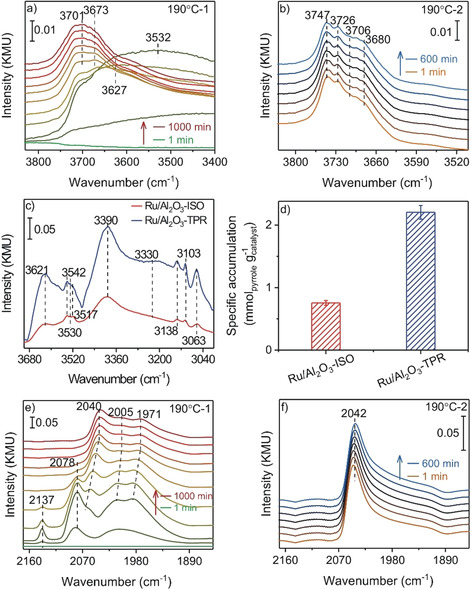
a),b) Time‐resolved in situ DRIFT spectra of OH groups recorded at different times during reaction in ID‐ref 6000 reformate at a) 190 °C‐1 (1, 2, 5, 7, 10, 20, 60, 120, 360, 660, 1000 min) and b) 190 °C‐2 (1, 60, 120, 240, 360, 480, 600 min). Note the intense and broad water bands (3500–3630 cm−1) appearing during the initial reduction of the Ru oxide NPs. c) In situ DRIFT spectra of the different pyrrole covered Ru/γ‐Al2O3 catalysts (steady‐state conditions) at 30 °C, d) accumulated, catalyst‐mass‐normalized amount of desorbed pyrrole during a TPD measurement in N2. e),f) Time‐resolved in situ DRIFT spectra of the COad region recorded at different times during reaction in SR‐ref 6000 at e) 190 °C‐1 phase (1, 2, 5, 7, 10, 20, 60, 120, 360, 660, 1000 min) (e) and f) 190 °C‐2 phase (1, 60, 120, 240, 360, 480, 600 min).
The t‐OH groups were previously reported to possess a higher Lewis basicity (higher net charge) compared to the b‐OH groups. [34] Therefore we tested whether the pronounced formation of the OHTPR groups during the TPR sequence, at temperatures ≥270 °C, will increase the Lewis basicity of the γ‐Al2O3 support. This could enhance the interaction between Ru and Al2O3 and thus stabilize flat Ru NPs. We examined changes in the number and properties of Lewis basic sites (O2−, OH groups, etc.) of the γ‐Al2O3 support upon the TPR sequence by pyrrole titration experiments. Here we focused on the N‐H stretch vibration of adsorbed pyrrole.
The DRIFT spectra (Figure 6 c) indicate a significantly higher concentration of Lewis basic sites (basic O2− (≈3330–3390 cm−1) and OH species (≈3621 cm−1)) on the Ru/γ‐Al2O3‐TPR catalyst than on Ru/γ‐Al2O3‐ISO[ 35 , 36 ] (detailed assignments see Section 12, SI). Analyzing the amount of gas phase pyrrole at the DRIFTS cell outlet during a temperature programmed desorption (TPD) measurement by transmission IR spectroscopy (Figure S13, SI), we detected a roughly 3 times higher amount of pyrrole desorption from Ru/γ‐Al2O3‐TPR (2.2 mmolpyrrole g−1 catalyst) than from the Ru/γ‐Al2O3‐ISO catalyst (0.76 mmolpyrrole g−1 catalyst, Figure 6 d and Figure S14, SI). Hence, the pyrrole titration confirms a significantly higher amount of Lewis basic sites (basic O2− sites and OH groups) on the γ‐Al2O3‐TPR support. DFT calculations of the interaction of small Ru clusters with (100) and (110) γ‐Al2O3 surfaces revealed that the introduction of surface OH groups enhances the basicity of the (100) surface, but lowers it for the (110) surface. This stabilizes the interaction between Ru and (hydroxylated) γ‐Al2O3 for the (100) surface, while this is opposite for the (110) surface.[ 20 , 37 ]
In combination, these results point to stronger interactions between the OHTPR hydroxylated γ‐Al2O3 and Ru NPs on the Ru/γ‐Al2O3‐TPR catalyst compared to the b‐OH hydroxylated Ru/γ‐Al2O3‐ISO catalyst, resulting in a stabilization of flat Ru NPs after TPR sequence. So far we have not considered, however, that the OHTPR type hydroxylation has to be present underneath the Ru NPs to result in a stronger interaction. In a static system these surface areas are not accessible to gas phase species. Hence, the higher temperatures during the TPR sequence are not only required to activate the reaction between γ‐Al2O3 surface and gas phase, but also to enhance the mobility of the Ru NPs to an extent that these can move to modified surface areas, where they are stabilized by the stronger interactions between modified surface and Ru NPs. The enhanced mobility of the Ru NPs also allows the thermodynamically favored reshaping of the Ru NPs.
In the C‐O stretch region, there are significant differences in the COad bands between the DRIFT spectra recorded during reaction (Figure 6 e,f) and during CO adsorption at 30 °C (Figure 4). During the 190 °C‐1 phase, the “Ru monolayer” species at ≈2078 cm−1 appeared only during the first 1 h reaction and vanished after that, the small band at 2137 cm−1 had disappeared after few min. The on‐top COad species characteristic for the hemispherical Ru NPs, which under reaction conditions appears at 2040 cm−1, and the bridge bonded COad species at 1971 cm−1 were almost unchanged for over 1000 min. Considering the much higher temperature during reaction than during the CO adsorption experiment in Figure 4, the complete absence of the high frequency bands under reaction conditions indicates that the multicarbonyl and “Ru monolayer” COad species with bands at 2132 and 2078 cm−1, respectively, relate to less strongly bound COad species.
During the TPR sequence, the COad coverage decreased due to the higher CO and CO2 conversion and desorption under these conditions; in addition, the COad bands also red shifted due to the lower CO‐CO repulsion/ dipole‐dipole coupling at lower COad coverages (right panel in Figure S11, SI). After cooling back to 190 °C, we observed only the band of on‐top COad at 2042 cm−1, while the low frequency COad bands almost disappeared. Furthermore, the total intensity is significantly lower, by 47 %, than before the TPR sequence. This discrepancy to the behavior during low‐temperature CO adsorption (Figure 4), where the TPR sequence leads to an increase of COad coverage, can be explained by the significantly weaker bonding of CO in the multicarbonyl and the “monolayer Ru” COad states with their bands at 2132–2137 and 2078 cm−1, respectively, discussed above. During low‐temperature CO adsorption, these sites are saturated with COad, while they are little populated under reaction conditions at 190 °C. This leads to a strong reduction of the total COad coverage during reaction on the Ru/γ‐Al2O3‐TPR catalyst, while on the Ru/γ‐Al2O3‐ISO catalyst the contribution of multicarbonyl and Ru monolayer COad sites is much smaller, and therefore its steady‐state coverage is less affected. Furthermore, the significantly higher reaction rate on the Ru/γ‐Al2O3‐TPR catalyst may also modify the occupation of different sites. For comparison, we also performed a blank experiment, monitoring the evolution of the adsorbate layer on a pure γ‐Al2O3 support in SR‐ref 6000 reformate gas by in situ DRIFTS measurement. They only show the gas phase signals of the reactants CO and CO2 (Figure S15, SI).
Furthermore, not only CO/CO2 adsorption and reaction are modified by the TPR sequence, but also the hydrogen adsorption/ desorption behavior. Exposing the catalysts to a mixture of H2 and D2 (10 % H2/ 10 % D2/N2, 190 °C), the amount of HD formation was significantly higher (about 20 %) over the Ru/γ‐Al2O3‐TPR catalyst than over the Ru/γ‐Al2O3‐ISO catalyst on the flat Ru NPs (Figure S16, SI).
Finally we would like to note that, although γ‐Al2O3 is considered to be very stable and non‐reducible, the present data clearly demonstrate that a reductive treatment can modify its metal‐support interactions, a phenomenon which so far had been reported only for noble metal NPs supported on reducible oxides. [15]
Conclusion
In combination, these data indicate that the high‐temperature treatment during COx methanation activates two processes that are kinetically hindered at lower temperatures: First, they activate the reactive modification of the support, leading to the formation of OHTPR species on its surface. Second, they activate the mobility of the Ru NPs, allowing them to transfer to already modified adjacent support sites. This first step results in the formation of Lewis basic sites on the γ‐Al2O3 surface with an enhanced interaction between Ru and γ‐Al2O3, which can stabilize flat Ru NPs, while the second part describes the kinetic activation required for the structural transformation of the Ru NPs. In total, we demonstrate that the enhanced MSIs induced by the temperature programmed reaction sequence result in a drastic increase of the CO2 methanation activity of the Ru/γ‐Al2O3 catalyst, both in the absence and presence of CO traces. This way Ru/γ‐Al2O3 reaches the activity of highly active Ru based catalysts, while keeping a high stability. Such kind of reductive higher‐temperature treatment provides a simple approach to fabricate a highly active and stable catalyst for methanation reactions, which can be useful for a wide range of reactions based on these supports.
Conflict of interest
The authors declare no conflict of interest.
Supporting information
As a service to our authors and readers, this journal provides supporting information supplied by the authors. Such materials are peer reviewed and may be re‐organized for online delivery, but are not copy‐edited or typeset. Technical support issues arising from supporting information (other than missing files) should be addressed to the authors.
Supplementary
Acknowledgements
S.C. is grateful for a fellowship from the Ministry of Science, Research and Arts of the State of Baden‐Württemberg. We acknowledge the electron synchrotron facilities Petra‐III (DESY, Germany, P65 beamline) and Elettra Synchrotrone (Trieste, Italy, XAFS beamline) for the provision of beam time and technical assistance. Finally, we would like to thank Dr. T. Diemant and S. Blessing (Ulm University) for XPS and XRD measurements. The Institute of Engineering Materials and Biomaterials of the Silesian University of Technology is acknowledged for the access to the Titan FEI TEM instrument. S.C., A.M.A., and J.B. are grateful for travel support for the synchrotron measurements by DESY (user office at DESY) and by Elettra (program CALIPSOplus, funded by Horizon 2020 EC program (GA n. 730872)). Open access funding enabled and organized by Projekt DEAL.
S. Chen, A. M. Abdel-Mageed, M. Dyballa, M. Parlinska-Wojtan, J. Bansmann, S. Pollastri, L. Olivi, G. Aquilanti, R. J. Behm, Angew. Chem. Int. Ed. 2020, 59, 22763.
Contributor Information
Dr. Ali M. Abdel‐Mageed, Email: ali.abdel-mageed@uni-ulm.de.
Prof. Dr. R. Jürgen Behm, Email: juergen.behm@uni-ulm.de.
References
- 1. Schüth F., Chem. Ing. Tech. 2011, 83, 1984. [Google Scholar]
- 2. Götz M., Lefebvre J., Mörs F., McDaniel Koch A., Graf F., Bajohr S., Reimert R., Kolb T., Renewable Energy 2016, 85, 1371. [Google Scholar]
- 3. Vogt C., Monai M., Kramer G. J., Weckhuysen B. M., Nat. Catal. 2019, 2, 188. [Google Scholar]
- 4. Wang W., Wang S., Ma X., Gong J., Chem. Soc. Rev. 2011, 40, 3703. [DOI] [PubMed] [Google Scholar]
- 5. Munnik P., Velthoen M. E. Z., de Jongh P. E., de Jong K. P., Gommes C. J., Angew. Chem. Int. Ed. 2014, 53, 9493; [DOI] [PubMed] [Google Scholar]; Angew. Chem. 2014, 126, 9647. [Google Scholar]
- 6. Chen S., Abdel-Mageed A. M., Gauckler C., Olesen S. E., Behm R. J., J. Catal. 2019, 373, 103. [Google Scholar]
- 7. Kattel S., Liu P., Chen J. G., J. Am. Chem. Soc. 2017, 139, 9739. [DOI] [PubMed] [Google Scholar]
- 8. Takenaka S., Shimizu T., Otsuka K., Int. J. Hydrogen Energy 2004, 29, 1065. [Google Scholar]
- 9. Wang F., He S., Chen H., Wang B., Zheng L., Wei M., Evans D. G., Duan X., J. Am. Chem. Soc. 2016, 138, 6298. [DOI] [PubMed] [Google Scholar]
- 10. Abdel-Mageed A. M., Wiese K., Parlinska-Wojtan M., Rabeah J., Brückner A., Behm R. J., Appl. Catal. B 2020, 270, 118846. [Google Scholar]
- 11. Abdel-Mageed A. M., Widmann D., Olesen S. E., Chorkendorff I., Behm R. J., ACS Catal. 2018, 8, 5399. [Google Scholar]
- 12. Chen S., Abdel-Mageed A. M., Li D., Bansmann J., Cisneros S., Biskupek J., Huang W., Behm R. J., Angew. Chem. Int. Ed. 2019, 58, 10732; [DOI] [PubMed] [Google Scholar]; Angew. Chem. 2019, 131, 10842. [Google Scholar]
- 13. Tauster S. J., Fung S. C., Garten R. L., J. Am. Chem. Soc. 1978, 100, 170. [Google Scholar]
- 14. Ahmadi M., Mistry H., Roldan Cuenya B., J. Phys. Chem. Lett. 2016, 7, 3519. [DOI] [PubMed] [Google Scholar]
- 15. van Deelen T. W., Hernandez Mejia C., de Jong K. P., Nat. Catal. 2019, 2, 955. [Google Scholar]
- 16. Liu Z., Zhang F., Rui N., Li X., Lin L., Betancourt L. E., Su D., Xu W., Cen J., Attenkofer K., Idriss H., Rodriguez J. A., Senanayake S. D., ACS Catal. 2019, 9, 3349. [Google Scholar]
- 17. Abe T., Tanizawa M., Watanabe K., Taguchi A., Energy Environ. Sci. 2009, 2, 315. [Google Scholar]
- 18. Li S., Xu Y., Chen Y., Li W., Lin L., Li M., Deng Y., Wang X., Ge B., Yang C., Yao S., Xie J., Li Y., Liu X., Ma D., Angew. Chem. Int. Ed. 2017, 56, 10761; [DOI] [PubMed] [Google Scholar]; Angew. Chem. 2017, 129, 10901. [Google Scholar]
- 19. Kwak J. H., Hu J., Mei D., Yi C. W., Kim D. H., Peden C. H. F., Allard L. F., Szanyi J., Science 2009, 325, 1670. [DOI] [PubMed] [Google Scholar]
- 20. Yang J., Zhao X., Bu S., Fan W., J. Phys. Chem. C 2018, 122, 17287. [Google Scholar]
- 21. Yan Y., Wang Q., Jiang C., Yao Y., Lu D., Zheng J., Dai Y., Wang H., Yang Y., J. Catal. 2018, 367, 194. [Google Scholar]
- 22. Eckle S., Anfang H.-G., Behm R. J., Appl. Catal. A 2011, 391, 325. [Google Scholar]
- 23. Abdel-Mageed A. M., Eckle S., Anfang H.-G., Behm R. J., J. Catal. 2013, 298, 148. [Google Scholar]
- 24. Panagiotopoulou P., Kondarides D. I., Verykios X. E., Appl. Catal. B 2009, 88, 470. [Google Scholar]
- 25. Abdel-Mageed A. M., Widmann D., Olesen S. E., Chorkendorff I., Biskupek J., Behm R. J., ACS Catal. 2015, 5, 6753. [Google Scholar]
- 26. Hadjiivanov K., Lavalley J.-C., Lamotte J., Maugé F., Saint-Just J., Che M., J. Catal. 1998, 176, 415. [Google Scholar]
- 27. Loveless B. T., Buda C., Neurock M., Iglesia E., J. Am. Chem. Soc. 2013, 135, 6107. [DOI] [PubMed] [Google Scholar]
- 28. Chin S. Y., Willimas C. T., Amiridis M. D., J. Phys. Chem. B 2006, 110, 871. [DOI] [PubMed] [Google Scholar]
- 29. Moulder J. F., Stickle W. F., Sobol P. E., Bomben K. D., Handbook of X-ray Photoelectron Spectroscopy (Ed.: Chastain J.), PerkinElmer Corp., Eden Prairie, USA, 1992. [Google Scholar]
- 30. Kloprogge J. T., Duong L. V., Wood B. J., Frost R. L., J. Colloid Interface Sci. 2006, 296, 572. [DOI] [PubMed] [Google Scholar]
- 31. Corsi J. S., Fu J., Wang Z., Lee T., Ng A. K., Detsi E., ACS Sustainable Chem. Eng. 2019, 7, 11194. [Google Scholar]
- 32. Busca G., Lorenzelli V., Escribano S., Guidelli R., J. Catal. 1991, 131, 167. [Google Scholar]
- 33. Digne M., Sautet P., Raybaud P., Euzen P., Toulhoat H., J. Catal. 2004, 226, 54. [Google Scholar]
- 34. Morterra C., Magnacca G., Catal. Today 1996, 27, 497. [Google Scholar]
- 35. Scokart P. O., Rouxhet P. G., J. Chem. Soc. Faraday Trans. 1980, 76, 1476. [Google Scholar]
- 36. Lavalley J. C., Catal. Today 1996, 27, 377. [Google Scholar]
- 37. Yang J., Wang H., Zhao X., Li Y. L., Fan W. L., RSC Adv. 2016, 6, 40459. [Google Scholar]
Associated Data
This section collects any data citations, data availability statements, or supplementary materials included in this article.
Supplementary Materials
As a service to our authors and readers, this journal provides supporting information supplied by the authors. Such materials are peer reviewed and may be re‐organized for online delivery, but are not copy‐edited or typeset. Technical support issues arising from supporting information (other than missing files) should be addressed to the authors.
Supplementary


