

Abstract
The lymphocyte stimulation test (LST) facilitates the diagnosis of non-IgE-mediated gastrointestinal food allergies (non-IgE-GI-FAs). However, LSTs require large volumes of blood and prolonged culture durations. Recently, we found that IL2RA mRNA expression in peripheral blood mononuclear cells (PBMCs) of patients with non-IgE-GI-FAs increased after a 24 h stimulation with milk proteins. We designated this gene expression test as the instant peripheral blood allergen stimulation test (iPAST). In this study, we investigated whether other activated T cell-associated genes are superior to IL2RA in the iPAST for the supplementary diagnosis of non-IgE-GI-FAs. After incubating PBMCs with milk proteins for 24 h, the mRNA levels of three genes, LRRC32, TNFRSF4, and CD69, were assessed using quantitative RT-PCR. The diagnostic significance of the mRNA expression was evaluated by analyzing the receiver operating characteristic (ROC) curve. Upon stimulation with α-casein, κ-casein, α-lactalbumin, or a mixture of four milk protein components (Pmix), LRRC32 expression in the PBMCs of 16 patients with non-IgE-GI-FAs was found to be higher than that in their 17 control counterparts, whereas TNFRSF4 and CD69 levels remained unaltered. Except for β-lactoglobulin and cow’s milk (CM), the area under the ROC curve (AUC) for LRRC32 mRNA expression upon stimulation was >0.7, which validated the diagnostic ability of this test. Notably, α-casein and Pmix had higher AUC scores of 0.820 and 0.842, respectively, than other antigens. iPAST assessed by LRRC32 as well as IL2RA may be useful for the supplementary diagnosis of non-IgE-GI-FAs as an alternative to LSTs and provide insight into the pathogenesis of non-IgE-GI-FAs.
Keywords: non-IgE-GI-FAs, LSTs, LRRC32, IL2RA, diagnosis, pathogenesis
Introduction
Non-IgE-mediated gastrointestinal food allergies (non-IgE-GI-FAs) are a type of food allergies that are primarily caused by the ingestion of cow’s milk (CM) and is especially prevalent among neonates and infants. Non-IgE-GI-FAs include food protein-induced enterocolitis syndrome (FPIES), food protein-induced allergic proctocolitis (FPIAP), and food protein-induced enteropathy (FPE) [1-3]. The number of neonates and infants with non-IgE-GI-FAs has been increasing rapidly in Japan since the late 1990s [4,5]. The global prevalence of FPIES is 0.015–0.7% [6-9], while the prevalence of non-IgE-GI-FAs has been reported to be 0.21% in Japan [10] and 0.13-0.72% in Europe [11]. As cases of non-IgE-GI-FAs show nonspecific symptoms, including fever, poor weight gain, and minor gastrointestinal (GI) troubles, the diagnosis of non-IgE-GI-FAs is sometimes challenging. Additionally, approximately 10% of patients develop severe complications, including mechanical ileus and delayed growth. Therefore, highly accurate diagnosis and prompt treatment are urgently needed for this disease. Oral food challenge (OFC) is necessary for definitive diagnosis. However, OFC can have risks, as it can induce the symptoms of non-IgE-GI-FAs, including severe symptoms, such as shock. Therefore, OFC cannot be performed easily as the patients comprise neonates and infants. Furthermore, OFC should not be performed until the patients are sufficiently healthy, which can subsequently delay diagnosis.
The lymphocyte stimulation test (LST), which is used to determine the reactivity of T-lymphocytes to specific allergens in vitro [12-14], aids in the diagnosis of non-IgE-GI-FAs. However, LSTs require substantial amounts of fresh peripheral blood and prolonged culture times of 5-7 days. Therefore, alternative tests that require small amounts of blood and shorter experimental times are needed on an urgent basis. Following activation by antigen recognition and co-stimulation, the T-cells express inflammatory cytokines, such as IL2, within a few hours. This is followed by the activation of certain genes, including CD69 and CD25 (interleukin-2 receptor-α (IL2RA)). A few days later, cell proliferation is observed by LSTs [15]. We hypothesized that the early transcriptional response of the allergen-stimulated lymphocytes of patients with non-IgE-GI-FAs replaces LSTs as an auxiliary in vitro test for assessing the antigen response. We designated this method as the instant peripheral blood allergen stimulation test (iPAST). In the iPAST, lymphocytes are stimulated with a specific allergen for 24 h, following which the mRNA levels are analyzed. In this study, we observed that IL2RA mRNA expression increased in the peripheral blood mononuclear cells (PBMCs) of patients with non-IgE-GI-FAs after stimulation with the allergens in CM for 24 h in vitro [16].
In the present study, we evaluated the mRNA levels of known T-cell-related genes, namely, leucine-rich repeat-containing protein 32 (LRRC32) [17], tumor necrosis factor receptor superfamily, member 4 (TNFRSF4) (OX40) [18], and CD69, upon stimulation with the allergens in CM for 24 h, for identifying superior biomarkers for the diagnosis of non-IgE-GI-FAs.
Materials and Methods
Patients
Patients with non-IgE-GI-FAs to CM, who were treated at our hospital from June 1, 2011, to July 31, 2018, were recruited after obtaining informed consents from parents or guardians for this study. The control group comprised individuals who did not have non-IgE-GI-FAs or other immune diseases. Non-IgE-GI-FAs were diagnosed on the basis of the criteria proposed by the Japanese Pediatric Guidelines for Food Allergy, and modified by Powell: (i) development of GI symptoms after the ingestion of causative foods; (ii) disappearance of the symptoms after discontinuation of the causative foods; (iii) exclusion of other disorders that can cause GI symptoms, including infections and surgical problems; and (iv) recurrence of GI symptoms during OFC or after re-administration of the causative foods. This study was conducted after obtaining approval from the Ethics Committee of Gunma University (approval number: 1507).
The Instant Peripheral Blood Allergen Stimulation Test (iPAST)
Samples of peripheral blood were obtained during the onset of the symptoms or before OFC. The PBMCs, collected from the patients and their control counterparts, were incubated with α-casein, κ-casein, α-lactalbumin, β-lactoglobulin, a mixture of all the four components (Pmix), or CM for 24 h, as previously described [16]. Quantitative reverse transcription polymerase chain reaction (qRT-PCR) was performed as previously described [16], with TaqMan Gene Expression Assays for LRRC32 (Assay ID: Hs00194136_m1; Thermo Fisher Scientific), TNFRSF4 (Assay ID: Hs00937194_g1; Thermo Fisher Scientific), CD69 (Assay ID: Hs00934033_m1; Thermo Fisher Scientific), and 18S rRNA (Assay ID: Hs99999901_s1; Thermo Fisher Scientific), which was used as the control. The gene expression was determined by dividing the gene expression in the stimulated samples with that of the non-stimulated samples, after normalizing the expression to that of 18S rRNA.
Lymphocyte Stimulation Test
The lymphocyte stimulation test was conducted with a few modifications to previously described implementations [19,20]. Briefly, PBMCs from each patient were incubated separately with CM and four different milk protein components (α-lactalbumin, β-lactoglobulin, α-casein, and κ-casein) for 5 days. Subsequently, proliferating cells were labeled by further incubation with 100 μM of 5-bromo-2-deoxyuridine (BrdU) for 6 h, and the incorporated BrdU contents were determined by an enzyme-linked immune-solvent assay. The results were described as stimulation index (SI), which was calculated as the ratio of BrdU-contents in a stimulated to unstimulated sample.
Statistical Analysis
The mRNA levels were statistically evaluated by Mann–Whitney U test, and diagnostic accuracy was assessed by analyzing the receiver operating characteristic (ROC) curve. Furthermore, the correlation between the expression levels of mRNA and the SI of LSTs by Spearman correlation coefficients. All analyses were performed using GraphPad Prism version 7 for Windows (GraphPad Inc., San Diego, CA, USA). The results were considered statistically significant if p < 0.05.
Results
Sixteen patients (8 boys and 8 girls) with non-IgE-GI-FAs participated in this study. Seventeen individuals (11 boys and 6 girls) who did not have non-IgE-GI-FAs or other immune diseases comprised the control group in this study. The median ages (interquartile ranges) of the patients and controls were 112.5 (61.3–292.5) days and 760 (287.5–1793) days, respectively (p = 0.0016, Mann–Whitney U test). Among the 16 patients, eight met the criteria for acute FPIES proposed in the 2017 International Consensus Guidelines [21]. For the other eight patients, three had FPIAP, one had chronic FPIES or FPE clinical features, and one had reproducible characteristic features of acute FPIES but did not meet the diagnostic criteria. The remaining three cases mainly showed bloody stools without vomiting, as well as poor general conditions. These three cases were categorized as unclassified. We assessed the mRNA expression levels and evaluated the diagnostic significance of LRRC32, TNFRSF4, and CD69 genes. Compared with the control group, the PBMCs obtained from the patients showed higher mRNA expression of LRRC32 after stimulation with α-casein, κ-casein, α-lactalbumin, or Pmix, but not β-lactoglobulin or CM (Table 1, Figure 1a and c). The area under the ROC curve (AUC) for LRRC32 mRNA expression after 24 h of stimulation with the aforementioned components, was greater than 0.7, with the exception of β-lactoglobulin and CM, and thus validated the diagnostic value of this analysis. Notably, the AUC scores of α-casein (AUC: 0.8203; p = 0.002) and Pmix (AUC: 0.8419; p = 0.0008) were higher than other antigens (Table 1, Figure 1b and d). As the two disease-related samples of PMBs were obtained during the onset of symptoms or before OFC, we examined whether testing during symptom onset and before OFC would give different results. There was no significant difference in the induced levels of LRRC32 mRNA expression between samples collected in the two different situations (Appendix A: Supplementary Table 1). Furthermore, because the control and patient groups had significantly different ages, there were no significant correlation between the LRRC32 mRNA levels and age for all antigens in all participants including in controls. In contrast, when the control group was exclusively analyzed, LRRC32 mRNA was significantly increased with age following α-casein, κ-casein, Pmix, and CM stimulation (see Appendix A: Supplementary Figure 1). The mRNA levels of TNFRSF4 and CD69 did not differ between the patients and the controls after 24 h of stimulation with any of the allergens (Table 1). Furthermore, subpopulation analysis after stimulation with milk allergens revealed no difference in LRRC32 mRNA expression between patients who fulfilled the diagnostic criteria for FPIES and those who did not or between the FPIES group and FPIAP group (Appendix A: Supplementary Table 2 and 3).
Table 1. mRNA levels and ROC curve analysis for the patients and controls.
| Fold induction of mRNA† |
ROC curve |
|||||||
| n | Patients with non-IgE-GI-FAs | Controls | p value* | AUC | p value | |||
|
| ||||||||
| LRRC32 | α-casein | 32 | 1.394 (0.655–2.862) |
0.486 (0.152–0.776) |
<0.01 | 0.8203 | <0.01 | |
| κ-casein | 32 | 1.028 (0.451–3.147) |
0.696 (0.238–1.402) |
<0.05 | 0.7294 | <0.05 | ||
| α-lactalbumin | 33 | 1.638 (1.125–2.817) |
1.252 (0.958–1.529) |
<0.05 | 0.7132 | <0.05 | ||
| β-lactoglobulin | 33 | 1.968 (1.593–2.637) |
1.637 (1.157–2.047) |
>0.1 | 0.6654 | >0.1 | ||
| Pmix | 33 | 2.224 (1.270–4.400) |
0.730 (0.350–1.156) |
<0.001 | 0.8419 | <0.001 | ||
| CM a | 30 | 2.016 (1.084–2.363) |
1.049 (0.706–2.172) |
>0.05 | 0.6964 | >0.05 | ||
| TNFRSF4 | α-casein | 33 | 0.929 (0.714–1.218) |
0.740 (0.482–0.997) |
>0.1 | 0.6397 | >0.1 | |
| κ-casein | 33 | 0.798 (0.502–0.997) |
0.599 (0.373–0.792) |
>0.05 | 0.6985 | >0.05 | ||
| α-lactalbumin | 33 | 1.631 (1.422–2.381) |
1.372 (0.960–1.937) |
>0.1 | 0.6507 | >0.1 | ||
| β-lactoglobulin | 33 | 1.781 (1.596–2.236) |
1.700 (1.021–2.198) |
>0.1 | 0.6066 | >0.1 | ||
| Pmix | 33 | 1.696 (1.372–2.401) |
1.186 (0.905–1.830) |
>0.05 | 0.6985 | >0.05 | ||
| CM a | 30 | 1.285 (0.886–2.222) |
1.296 (0.797–1.607) |
>0.1 | 0.5625 | >0.1 | ||
| CD69 | α-casein | 32 | 1.076 (0.823–1.255) |
0.894 (0.739–1.005) |
>0.05 | 0.6980 | >0.05 | |
| κ-casein | 32 | 0.952 (0.744–1.125) |
0.877 (0.494–1.034) |
>0.1 | 0.6314 | >0.1 | ||
| α-lactalbumin | 32 | 1.370 (1.097–1.969) |
1.086 (0.799–1.747) |
>0.1 | 0.6510 | >0.1 | ||
| β-lactoglobulin | 32 | 1.314 (0.934–1.535) |
1.061 (0.776–1.558) |
>0.1 | 0.5784 | >0.1 | ||
| Pmix | 32 | 1.330 (0.990–2.006) |
1.067 (0.860–1.582) |
>0.1 | 0.5961 | >0.1 | ||
| CM a | 30 | 1.232 (0.880–1.381) |
1.025 (0.813–1.261) |
>0.1 | 0.6161 | >0.1 | ||
a CM, Cow’s milk. Data are expressed as the median (interquartile ranges). *Mann–Whitney U test. † Fold induction of LRRC32, TNFRSF4, and CD69 mRNAs was calculated by dividing the expression in the stimulated samples with that of the non-stimulated samples, following normalization to that of 18S rRNA. p values < 0.05 are indicated by bold text.
Figure 1.
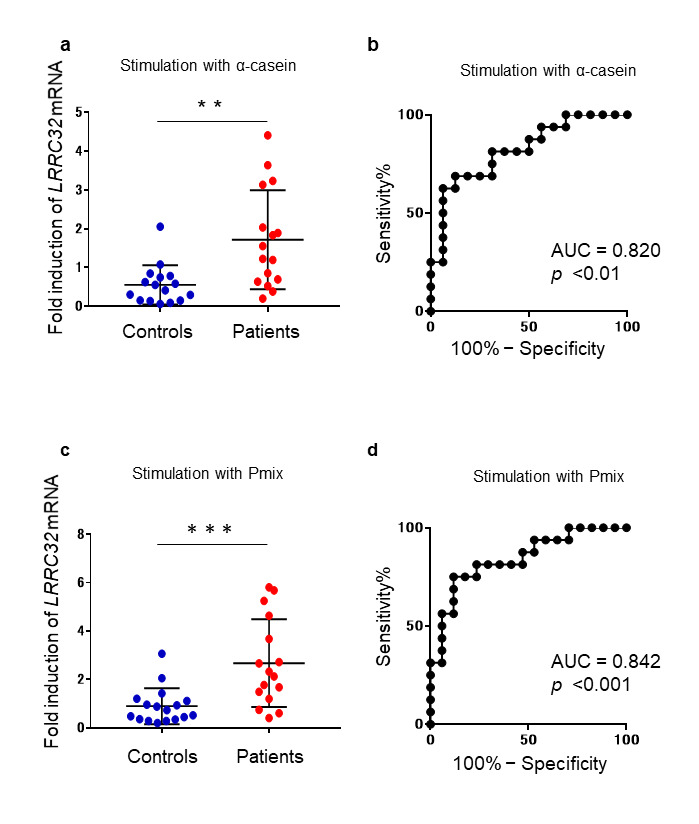
Comparison of the expression levels of LRRC32 mRNA between the patients and controls. a. The fold induction of LRRC32 mRNA was calculated by dividing the expression of LRRC32 mRNA in α-casein-stimulated samples with that of the non-stimulated samples, following normalization to that of 18S rRNA. Each blue dot represents the data obtained from a single control and each red dot represents the data obtained from a single patient. The bars indicate the median values. Mann–Whitney U tests were performed for comparisons. b. ROC curves for the expression levels of LRRC32 mRNA, in the PMBCs of the patients and controls stimulated with α-casein. c. The fold induction of LRRC32 mRNA was calculated by dividing the expression in the Pmix-stimulated samples with that of the non-stimulated samples, following normalization to that of 18S rRNA. Each blue dot represents the data obtained from a single control and each red dot represents the data obtained from a single patient. The bars indicate the median values. Mann–Whitney U tests were used for comparisons. d. The ROC curves for LRRC32 mRNA expression in the PMBCs of patients and controls stimulated with Pmix. **Refers to comparisons between patients and controls, p < 0.01. ***Refers to comparisons between patients and controls, p < 0.001.
We subsequently assessed the correlation between LRRC32 mRNA levels and the results obtained by conventional LSTs. The median (interquartile ranges) SI of LSTs of the patients and controls were 3.222 (2.377–6.686; α-casein), 15.04 (8.17–27.6; Pmix), and 0.959 (0.699–2.071; α-casein), 1.663 (1.169–2.795; Pmix), respectively. Using Spearman correlation, we observed that the correlations obtained for α-casein (r = 0.5048; p = 0.0032) and Pmix (r = 0.6702; p = 0.0006) were moderate and significant; however, this did not hold true for the other allergens (Figure 2a and b). These results indicated that α-casein- and Pmix-stimulated LRRC32 mRNA expression levels correlated with the SI obtained by LSTs.
Figure 2.
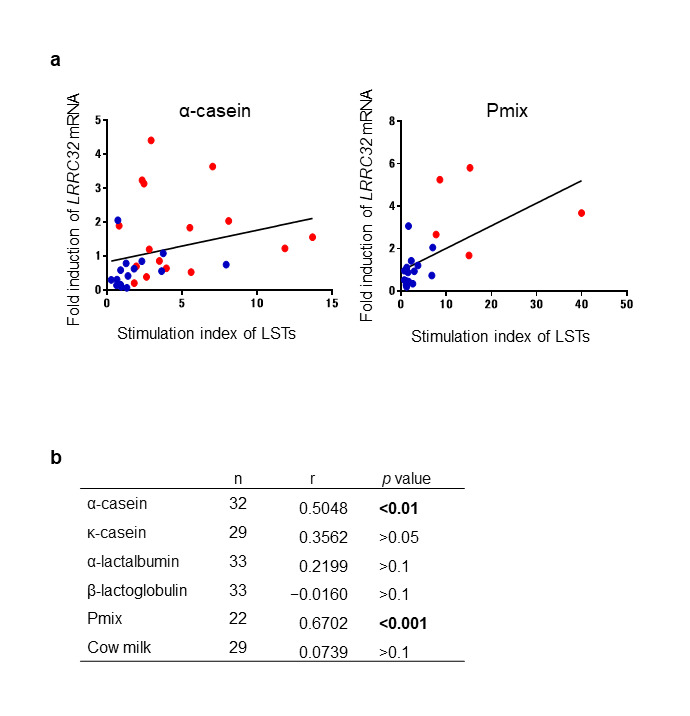
Comparison of the fold induction of LRRC32 mRNA using the stimulation index determined by conventional LSTs following stimulation with milk proteins. a. Spearman correlation analysis of the levels of LRRC32 mRNA and stimulation indexes obtained from LSTs after α-casein and Pmix stimulation. Levels of LRRC32 mRNA were described by the fold induction of LRRC32 mRNA expression, upon stimulation with the indicated milk proteins, relative to that of the unstimulated cells. Each blue dot represents the data obtained from a single control and each red dot represents the data obtained from a single patient. b. Summary of Spearman correlations. p values < 0.05 are indicated by bold text.
Discussion
In this study, we found that among LRRC32, TNFRSF4, and CD69, the expression of LRRC32 mRNA could be used to discriminate the patients from the control group, particularly after stimulation with α-casein and Pmix. The levels of LRRC32 mRNA stimulated by α-casein and Pmix correlated with those obtained from conventional LSTs. These results indicated that LRRC32plays an important role in non-IgE-GI-FAs, and further suggested that α-casein was a major allergen in non-IgE-GI-FAs.
The LRRC32 gene is located at the 11q13 region, which is associated with a wide range of allergic diseases, including asthma [22], atopic dermatitis [23], allergic rhinitis [24], and food allergies [25]. LRRC32 is a surface marker of activated FoxP3+ regulatory T-cells [17,26]. It directly binds to the TGF-β latency-associated peptide complex and suppresses the secretion of TGF-β [17]. Pathological conditions in FPIES may involve the decreased expression of the TGF-β1 receptor in GI tissues, with consequent impairment of GI barrier function resulting from the decreased activity of TGF-β [27]. Moreover, children with FPIES to CM have deficient T cell-mediated TGF-β responses to casein [28]. Taken together, a specific increase in LRRC32 expression was observed in this study, which suggested its important role in non-IgE-GI-FAs. The AUC of IL2RA mRNA expression following stimulation with α-casein in ROC curve analysis in our previous report was 0.9596 (p < 0.0001) [16]. This is higher than the AUC of LRRC32 mRNA (0.8203, p < 0.01) in the current study, indicating that IL2RA is a better marker for diagnosing non-IgE-GI-FAs.
Some of the major limitations of this study include the small number of patients in the group and the significant age difference between the non-IgE-GI-FAs patients and the control group. However, it is important to note that as non-IgE-GI-FAs mostly develop in young children, it is difficult to obtain samples from age-matched controls owing to ethical constraints and difficulties in obtaining consent. However, in analysis of the control group alone, α-casein-, κ-casein-, Pmix-, and CM-stimulated LRRC32 mRNA expression levels significantly increased with increasing age; LRRC32 expression in younger patients was higher after stimulation with milk allergens compared to in controls. This result indicates that LRCC32 levels were affected by the disease, which can be used as a diagnostic index. Additionally, we did not investigate which cells expressed the LRRC32, TNFRSF4, and CD69 mRNAs. The LST assay is useful for diagnosing non-IgE-GI-FA, but it is unclear which types of cells were proliferating after 5 days of stimulation with the milk allergen. In this study, the expression level of LRRC32 mRNA was correlated with conventional LST. Although an antigen-specific initial increase in LRRC32 mRNA levels may reflect an antigen-specific lymphocyte proliferation response, the corresponding mechanism is unknown. However, one of the strengths of this study is that the diagnosis of non-IgE-GI-FAs was based on strict diagnostic criteria and included an OFC or re-administration for confirming the diagnosis.
In conclusion, we have presented evidence that, in addition to IL2RA iPAST, LRRC32 has a good diagnostic value and its increase may provide insights into the pathogenesis of non-IgE-GI-FAs.
Acknowledgments
This study was supported by a Grant-in-Aid from JSPS KAKENHI for Challenging Exploratory Research (grant number: 24659488, HA), and funds from the Nipponham Foundation for the Future of Food (HY) and the Morinaga Foundation (TT). We would like to express our gratitude to Dr. Hideko Nishimura, Dr. Reiko Hatori, Dr. Harumi Koyama, and Dr. Takahiro Inoue for caring for the patients. We would also like to thank Ms. Kiyoe Ishii and Dr. Akira Aizawa for providing technical assistance with LST and iPAST. We would like to thank Editage (http://www.editage.com) for editing and reviewing this manuscript for English language.
Glossary
- non-IgE-GI-FAs
non-IgE-mediated gastrointestinal food allergy
- CM
cow’s milk
- FPIES
food protein-induced enterocolitis syndrome
- FPIAP
food protein-induced allergic proctocolitis
- FPE
food protein-induced enteropathy
- GI
gastrointestinal
- OFC
oral food challenge
- LST
lymphocyte stimulation test
- IL2RA
interleukin-2 receptor-α
- iPAST
instant peripheral blood allergen stimulation test
- PBMCs
peripheral blood mononuclear cells
- LRRC32
leucine-rich repeat-containing protein 32
- TNFRSF4
tumor necrosis factor receptor superfamily, member 4
- qRT-PCR
quantitative reverse transcription polymerase chain reaction
- BrdU
5-bromo-2’-deoxyuridine
- SI
stimulation index
- ROC
receiver operating characteristic
- AUC
area under the curve
- GWAS
genome-wide association analysis
Appendix A.
Author Contributions
HY performed the experiments and statistical analysis and prepared the manuscript. TT designed the study, reviewed the collected data, and supervised the study. YY and HA analyzed the results and suggested revisions. All the authors, except YY, contributed to data collection. All the authors read and approved the final manuscript.
References
- Nowak-Węgrzyn A, Katz Y, Mehr SS, Koletzko S. Non-IgE-mediated gastrointestinal food allergy. J Allergy Clin Immunol. 2015. May;135(5):1114–24. 10.1016/j.jaci.2015.03.025 [DOI] [PubMed] [Google Scholar]
- Caubet JC, Szajewska H, Shamir R, Nowak-Węgrzyn A. Non-IgE-mediated gastrointestinal food allergies in children. Pediatr Allergy Immunol. 2017. February;28(1):6–17. 10.1111/pai.12659 [DOI] [PubMed] [Google Scholar]
- Nowak-Wegrzyn A, Berin MC, Mehr S. Food Protein-Induced Enterocolitis Syndrome. J Allergy Clin Immunol Pract. 2020. January;8(1):24–35. 10.1016/j.jaip.2019.08.020 [DOI] [PubMed] [Google Scholar]
- Miyazawa T, Itahashi K, Imai T. Management of neonatal cow’s milk allergy in high-risk neonates. Pediatr Int. 2009. August;51(4):544–7. 10.1111/j.1442-200X.2009.02811.x [DOI] [PubMed] [Google Scholar]
- Yamada Y. Unique features of non-IgE-mediated gastrointestinal food allergy during infancy in Japan. Curr Opin Allergy Clin Immunol. 2020. June;20(3):299–304. 10.1097/aci.0000000000000642 [DOI] [PubMed] [Google Scholar]
- Katz Y, Goldberg MR, Rajuan N, Cohen A, Leshno M. The prevalence and natural course of food protein-induced enterocolitis syndrome to cow’s milk: a large-scale, prospective population-based study. J Allergy Clin Immunol. 2011;127(3):647-53 e1-3. doi: 10.1016/j.jaci.2010.12.1105. [DOI] [PubMed] [Google Scholar]
- Alonso SB, Ezquiaga JG, Berzal PT, Tardón SD, San José MM, López PA, et al. Food protein-induced enterocolitis syndrome: increased prevalence of this great unknown-results of the PREVALE study. J Allergy Clin Immunol. 2019. January;143(1):430–3. 10.1016/j.jaci.2018.08.045 [DOI] [PubMed] [Google Scholar]
- Mehr S, Frith K, Barnes EH, Campbell DE, Allen K, Barnes E, et al. FPIES Study Group . Food protein-induced enterocolitis syndrome in Australia: A population-based study, 2012-2014. J Allergy Clin Immunol. 2017. November;140(5):1323–30. 10.1016/j.jaci.2017.03.027 [DOI] [PubMed] [Google Scholar]
- Nowak-Wegrzyn A, Warren CM, Brown-Whitehorn T, Cianferoni A, Schultz-Matney F, Gupta RS. Food protein-induced enterocolitis syndrome in the US population-based study. J Allergy Clin Immunol. 2019. October;144(4):1128–30. 10.1016/j.jaci.2019.06.032 [DOI] [PMC free article] [PubMed] [Google Scholar]
- Ebisawa M, Ito K, Fujisawa T, Committee for Japanese Pediatric Guideline for Food Allergy, The Japanese Society of Pediatric Allergy and Clinical Immunology, The Japanese Society of Allergology Japanese guidelines for food allergy 2017. Allergol Int. 2017. April;66(2):248–64. 10.1016/j.alit.2017.02.001 [DOI] [PubMed] [Google Scholar]
- Schoemaker AA, Sprikkelman AB, Grimshaw KE, Roberts G, Grabenhenrich L, Rosenfeld L, et al. Incidence and natural history of challenge-proven cow’s milk allergy in European children—EuroPrevall birth cohort. Allergy. 2015. August;70(8):963–72. 10.1111/all.12630 [DOI] [PubMed] [Google Scholar]
- Shek LP, Bardina L, Castro R, Sampson HA, Beyer K. Humoral and cellular responses to cow milk proteins in patients with milk-induced IgE-mediated and non-IgE-mediated disorders. Allergy. 2005. July;60(7):912–9. 10.1111/j.1398-9995.2005.00705.x [DOI] [PubMed] [Google Scholar]
- Yagi H, Takizawa T, Sato K, Inoue T, Nishida Y, Ishige T, et al. Severity scales of non-IgE-mediated gastrointestinal food allergies in neonates and infants. Allergol Int. 2019. April;68(2):178–84. 10.1016/j.alit.2018.08.004 [DOI] [PubMed] [Google Scholar]
- Kimura M, Oh S, Narabayashi S, Taguchi T. Usefulness of lymphocyte stimulation test for the diagnosis of intestinal cow’s milk allergy in infants. Int Arch Allergy Immunol. 2012;157(1):58–64. 10.1159/000323896 [DOI] [PubMed] [Google Scholar]
- Lochmatter P, Zawodniak A, Pichler WJ. In vitro tests in drug hypersensitivity diagnosis. Immunol Allergy Clin North Am. 2009. August;29(3):537–54. 10.1016/j.iac.2009.04.009 [DOI] [PubMed] [Google Scholar]
- Yagi H, Takizawa T, Sato K, Inoue T, Nishida Y, Yamada S, et al. Interleukin 2 receptor-α expression after lymphocyte stimulation for non-IgE-mediated gastrointestinal food allergies. Allergol Int. 2020. April;69(2):287–9. 10.1016/j.alit.2019.11.003 [DOI] [PubMed] [Google Scholar]
- Tran DQ, Andersson J, Wang R, Ramsey H, Unutmaz D, Shevach EM. GARP (LRRC32) is essential for the surface expression of latent TGF- on platelets and activated FOXP3+ regulatory T cells. Proc Natl Acad Sci USA. 2009;106(32):13445-50. doi: 10.1073/pnas.0901944106. [DOI] [PMC free article] [PubMed] [Google Scholar]
- Akiba H, Miyahira Y, Atsuta M, Takeda K, Nohara C, Futagawa T, et al. Critical contribution of OX40 ligand to T helper cell type 2 differentiation in experimental leishmaniasis. J Exp Med. 2000. January;191(2):375–80. 10.1084/jem.191.2.375 [DOI] [PMC free article] [PubMed] [Google Scholar]
- Hoffman KM, Ho DG, Sampson HA. Evaluation of the usefulness of lymphocyte proliferation assays in the diagnosis of allergy to cow’s milk. J Allergy Clin Immunol. 1997. March;99(3):360–6. 10.1016/S0091-6749(97)70054-X [DOI] [PubMed] [Google Scholar]
- Morita H, Nomura I, Orihara K, Yoshida K, Akasawa A, Tachimoto H, et al. Antigen-specific T-cell responses in patients with non-IgE-mediated gastrointestinal food allergy are predominantly skewed to T(H)2. J Allergy Clin Immunol. 2013;131(2):590-2 e1-6. doi: 10.1016/j.jaci.2012.09.005. [DOI] [PubMed] [Google Scholar]
- Nowak-Węgrzyn A, Chehade M, Groetch ME, Spergel JM, Wood RA, Allen K, et al. International consensus guidelines for the diagnosis and management of food protein-induced enterocolitis syndrome: Executive summary-Workgroup Report of the Adverse Reactions to Foods Committee, American Academy of Allergy, Asthma & Immunology. J Allergy Clin Immunol. 2017. April;139(4):1111–1126.e4. 10.1016/j.jaci.2016.12.966 [DOI] [PubMed] [Google Scholar]
- Ferreira MA, Matheson MC, Duffy DL, Marks GB, Hui J, Le Souëf P, et al. Identification of IL6R and chromosome 11q13.5 as risk loci for asthma. Lancet. 2011;378(9795):1006-14. doi: 10.1016/s0140-6736(11)60874-x [DOI] [PMC free article] [PubMed] [Google Scholar]
- Esparza-Gordillo J, Weidinger S, Fölster-Holst R, Bauerfeind A, Ruschendorf F, Patone G, et al. A common variant on chromosome 11q13 is associated with atopic dermatitis. Nat Genet. 2009;41(5):596-601. doi: 10.1038/ng.347. [DOI] [PubMed] [Google Scholar]
- Ramasamy A, Curjuric I, Coin LJ, Kumar A, McArdle WL, Imboden M, et al. A genome-wide meta-analysis of genetic variants associated with allergic rhinitis and grass sensitization and their interaction with birth order. J Allergy Clin Immunol. 2011. November;128(5):996–1005. 10.1016/j.jaci.2011.08.030 [DOI] [PubMed] [Google Scholar]
- Ingo Marenholz SG. Genome-wide Association Study Identifies the SERPINB Gene Cluster as a Susceptibility Locus for Food Allergy. Nat Commun. 2017. doi: 10.1038/s41467-017-01220-0. [DOI] [PMC free article] [PubMed] [Google Scholar]
- Wang R, Kozhaya L, Mercer F, Khaitan A, Fujii H, Unutmaz D. Expression of GARP selectively identifies activated human FOXP3+ regulatory T cells. Proc Natl Acad Sci USA. 2009. August;106(32):13439–44. 10.1073/pnas.0901965106 [DOI] [PMC free article] [PubMed] [Google Scholar]
- Chung HL, Hwang JB, Park JJ, Kim SG. Expression of transforming growth factor beta1, transforming growth factor type I and II receptors, and TNF-alpha in the mucosa of the small intestine in infants with food protein-induced enterocolitis syndrome. J Allergy Clin Immunol. 2002. January;109(1):150–4. 10.1067/mai.2002.120562 [DOI] [PubMed] [Google Scholar]
- Konstantinou GN, Bencharitiwong R, Grishin A, Caubet JC, Bardina L, Sicherer SH, et al. The role of casein-specific IgA and TGF-β in children with food protein-induced enterocolitis syndrome to milk. Pediatr Allergy Immunol. 2014. November;25(7):651–6. 10.1111/pai.12288 [DOI] [PMC free article] [PubMed] [Google Scholar]