Abstract
Environmental exposures such as chemical toxicants can alter gene expression and disease susceptibility through epigenetic processes. Epigenetic changes can be passed to future generations through germ cells through epigenetic transgenerational inheritance of increased disease susceptibility. The current study used an epigenome-wide association study (EWAS) to investigate whether specific transgenerational epigenetic signatures of differential DNA methylation regions (DMRs) exist that are associated with particular disease states in the F3 generation great-grand offspring of F0 generation rats exposed during gestation to the agricultural pesticide methoxychlor. The transgenerational epigenetic profiles of sperm from F3 generation methoxychlor lineage rats that have only one disease state were compared to those that have no disease. Observations identify disease specific patterns of DMRs for these transgenerational rats that can potentially serve as epigenetic biomarkers for prostate disease, kidney disease, obesity, and the presence of multiple diseases. The chromosomal locations, genomic features, and gene associations of the DMRs are characterized. Disease specific DMR sets contained DMR-associated genes that have previously been shown to be associated with that specific disease. Future epigenetic biomarkers could potentially be developed and validated for humans as a disease susceptibility diagnostic tool to facilitate preventative medicine and management of disease.
Keywords: EWAS, DNA methylation, disease, prostate, kidney, obesity, epimutation, biomarker, transgenerational
Introduction
Factors in the environment that organisms are exposed to such as toxicants, nutrition, or trauma can alter gene expression and disease susceptibility in those organisms through epigenetic processes [1–4]. Epigenetics is defined as ‘molecular factors and processes around DNA that regulate genome activity, independent of DNA sequence, and are mitotically stable’ [5, 6]. Epigenetic processes include DNA methylation, histone modifications, adjustments to chromatin structure, expression of non-coding RNAs, and RNA methylation. Previous studies have shown that epigenetic changes can be passed to future generations through germ cells. These changes can lead to the epigenetic transgenerational inheritance of phenotypic changes and increased disease susceptibility [1]. Epigenetic transgenerational inheritance occurs when exposure to environmental factors induce germline epigenetic changes that are passed to subsequent generations that themselves had no direct exposure to those environmental factors, leading to phenotypic changes in these un-exposed generations [7, 8]. For example, in the case where a pregnant female is exposed to an environmental toxicant, the gestating fetus (F1 generation) is also directly exposed, and so are the germ cells in the fetus that will contribute to forming the F2 generation. Therefore, the F3 generation (i.e. great-grand offspring) is the first generation in which one could potentially see epigenetic transgenerational effects from the toxicant exposure [7]. The current study tests the hypothesis that epigenetic biomarkers in sperm are associated with specific diseases occurring in the transgenerational F3 generation after the ancestral gestating female was exposed to the pesticide methoxychlor.
Methoxychlor is an insecticide introduced as a replacement for DDT (dichloro-diphenyl-trichloroethane) [9]. DDT is an estrogenic toxicant that was used as a pesticide in the 1950s and 1960s in the USA and Europe extensively, then banned in the 1970s and replaced by methoxychlor. Methoxychlor is also considered to be a model environmental endocrine disruptor with anti-androgenic and estrogenic activities [10]. Methoxychlor was banned in the USA in 2003 [11] [Methoxychlor Reregistration Eligibility Decision (RED) June 30, 2004 EPA Publication No. EPA 738-R-04-010. https://www3.epa.gov/pesticides/chem_search/reg_actions/reregistration/red_PC-034001_30-Jun-04.pdf]. During its period of use, methoxychlor residues were found to be present in foods [12]. A previous study showed that exposure of pregnant F0 generation rats to methoxychlor from embryonic days E8–14 of development results in epigenetic transgenerational inheritance of increased disease rates in the F3 generation, compared to controls [13]. Diseases seen to be increased transgenerationally included renal disease, ovarian disease, obesity, and an increased rate of animals with multiple diseases. The sperm from F3 generation methoxychlor lineage rats showed epigenetic changes (epimutations) compared to F3 generation controls, namely changes in DNA methylation termed differential DNA methylation regions (DMRs) [13]. These sperm DMR provide a potential epigenetic signature (biomarker) associated with ancestral exposure to methoxychlor [14]. Recently, studies have demonstrated that the epigenetic transgenerational inheritance of specific pathologies can be assessed with DMR biomarkers in sperm from animals ancestrally exposed to either vinclozolin, DDT, or atrazine [15–17].
The current study performs an epigenome-wide association study (EWAS) to investigate whether specific transgenerational DMR signatures exist in sperm for specific disease states in the great-grand offspring of rats ancestrally exposed to the environmental toxicant methoxychlor. Disease specific sperm epigenetic biomarkers such as these may in the future be useful in predicting if an individual or their offspring have an increased susceptibility of developing a specific disease.
Results
The current study re-analysed sperm samples and stained histological tissue slides from the work of Manikkam et al., 2014 [13]. While the previous study characterized the epigenetic transgenerational DMR signature of ancestral methoxychlor exposure, the current study identifies transgenerational changes in sperm DNA methylation in individuals that are associated with specific disease states. As previously reported [13], pregnant F0 generation rats (n = 4) were exposed to 200 mg/kg body weight methoxychlor from days 8–14 of gestation. This is approximately 4% of the rat oral LD50 for methoxychlor [18]. The No Observed Adverse Effect Level (NOAEL) for decreased fertility in rats is reported as 79 mg/kg/day, while the calculated human Minimal Risk Levels (MRL) are 0.005 mg/kg/day (TOXICOLOGICAL PROFILE FOR METHOXYCHLOR, U.S. DEPARTMENT OF HEALTH AND HUMAN SERVICES, Public Health Service, Agency for Toxic Substances and Disease Registry, September 2002. https://www.atsdr.cdc.gov/toxprofiles/tp47.pdf) [19]. Control F0 generation rats (n = 6) were treated during the same gestational period with the vehicle control dimethyl sulfoxide (DMSO). F1 generation offspring were bred to unrelated F1 generation rats of the same exposure lineage to produce the F2 generation, and F2 generation rats were bred similarly to produce the transgenerational F3 generation. Twenty-eight methoxychlor lineage and twenty-nine control lineage F3 generation male rats were aged to one year and sacrificed. Sperm samples were collected for DNA methylation analysis, and testis, prostate, and kidney samples were collected for histopathological disease evaluation, as described in the Methods.
Tissue samples were evaluated for the presence of pathologies in the current study using updated methods including microscope digital image capture to identify abnormalities, as described in Methods. Briefly, for the testis, the abnormalities quantified were atrophy of seminiferous tubules, vacuoles within seminiferous tubules, and sloughing of cellular debris into the tubular lumen (maturation arrest). For the prostate, the abnormalities quantified were atrophy of prostatic epithelium, vacuoles within the prostatic epithelium, and prostatic epithelial hyperplasia. For kidney pathology, the abnormalities quantified were reduced glomerular size, thickening of the Bowman’s capsule, and renal cysts. The number of abnormalities in any tissue sample was compared to the average number of that abnormality in the controls to determine if that animal’s tissue was considered diseased. Two individuals blinded to exposure evaluated each tissue image for abnormalities. If there was disagreement about disease status, then a third individual blinded to exposure evaluated the tissue, as described in Methods. The new disease data from these updated methods are presented in Table 1 for the methoxychlor lineage and Supplementary Table S1 for the control lineage. Obesity was determined qualitatively from observation of excessive intra-abdominal and subcutaneous fat at the time of sacrifice, along with body weight. Age of puberty was determined by the day of preputial separation at the penis. The occurrence of tumors at any period of development was recorded, and tumor histology was assessed. The presence of disease in more than one tissue is considered to be ‘multiple disease’ for that rat. Within the methoxychlor lineage rats, the epigenetic profile of sperm from rats that have only one disease state (for example only kidney disease) was compared to those that have no disease in order to determine disease specific epimutations.
Table 1:
F3 generation methoxychlor lineage male pathology. The individual animals for the methoxychlor lineage males are listed and a (+) indicates presence of disease and (−) absence of disease. The animals with shaded (+) were used for the epigenetic analysis due to the presence of only one disease, except the multiple (≥2) disease. The animals with shading were used in the analysis as those with disease (+) or no disease (0).
| Molecular ID | Puberty | Testis | Prostate | Kidney | Obesity | Tumor | Multiple disease | Total disease |
|---|---|---|---|---|---|---|---|---|
| MX1 | − | − | + | − | − | − | − | 1 |
| MX2 | − | + | − | + | + | − | + | 3 |
| MX3 | − | − | + | − | + | − | + | 2 |
| MX4 | + | − | + | − | − | − | + | 2 |
| MX5 | − | + | − | − | + | − | + | 2 |
| MX6 | − | − | − | + | − | − | − | 1 |
| MX7 | − | − | − | − | + | − | − | 1 |
| MX8 | − | − | − | − | + | − | − | 1 |
| MX9 | − | + | + | − | + | − | + | 2 |
| MX10 | − | − | − | − | + | − | − | 1 |
| MX11 | − | − | − | + | − | − | − | 1 |
| MX12 | − | − | − | − | + | − | − | 1 |
| MX13 | − | − | + | − | + | − | + | 2 |
| MX14 | − | + | − | + | + | − | + | 3 |
| MX15 | − | − | − | + | + | − | + | 2 |
| MX16 | − | − | + | + | − | − | + | 2 |
| MX17 | − | − | − | − | − | − | − | 0 |
| MX18 | − | − | − | − | − | − | − | 0 |
| MX19 | − | − | − | + | − | − | − | 1 |
| MX20 | − | − | − | − | − | − | − | 0 |
| MX21 | − | − | − | − | − | − | − | 0 |
| MX22 | − | + | − | − | − | − | − | 1 |
| MX23 | − | − | − | − | − | − | − | 0 |
| MX24 | − | n/a | − | − | − | − | − | n/a |
| MX25 | − | − | + | − | − | − | − | 1 |
| MX26 | − | − | + | − | − | − | − | 1 |
| MX27 | − | − | − | − | + | − | − | 1 |
| MX28 | − | − | + | − | + | − | + | 2 |
| MX29 | − | − | + | − | − | − | − | 1 |
| Totals | 1/29 = 3% | 5/28 = 18% | 10/29 = 34% | 7/29 = 24% | 13/29 = 45% | 0/29 = 0% | 10/29 = 34% |
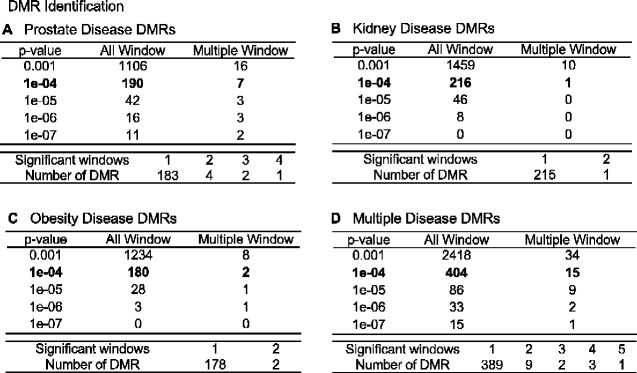
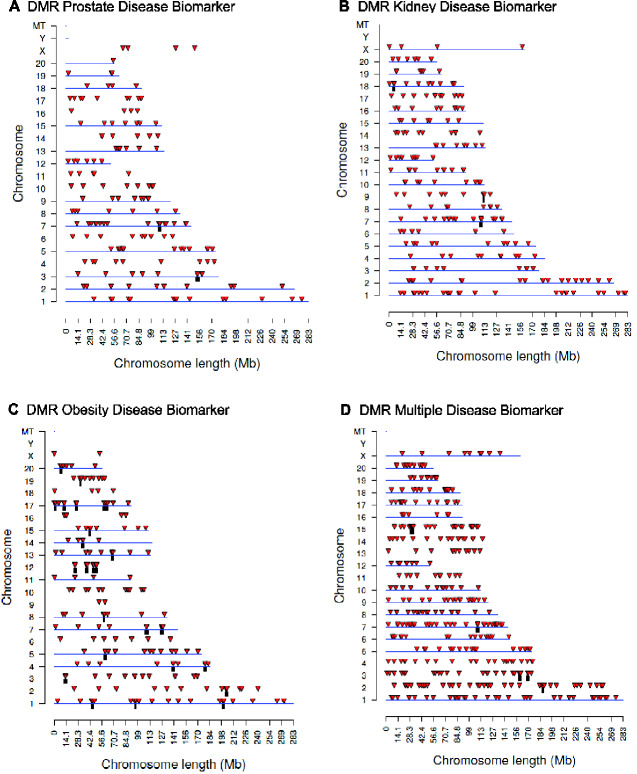
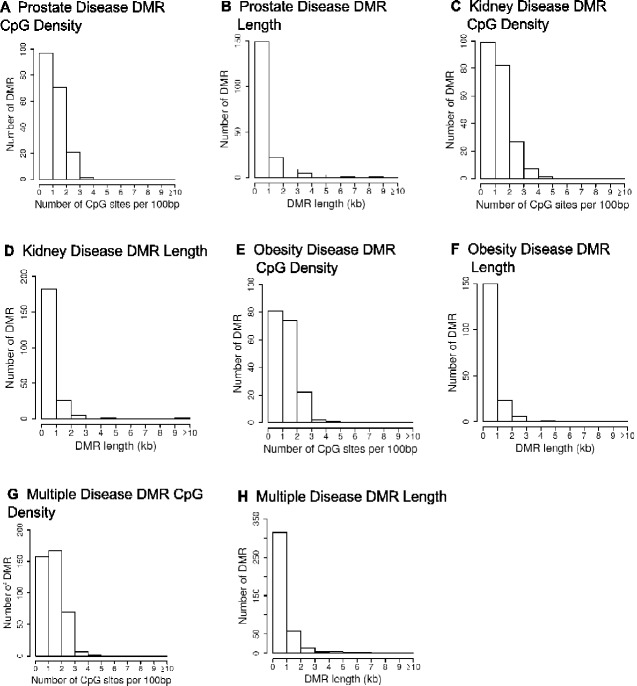
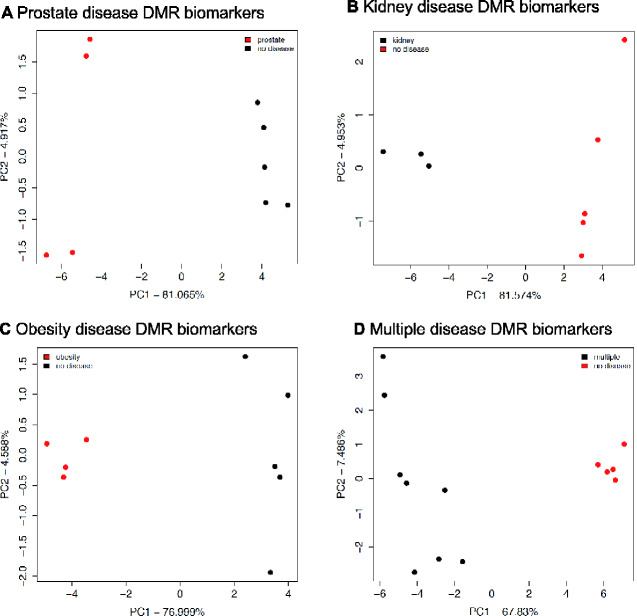
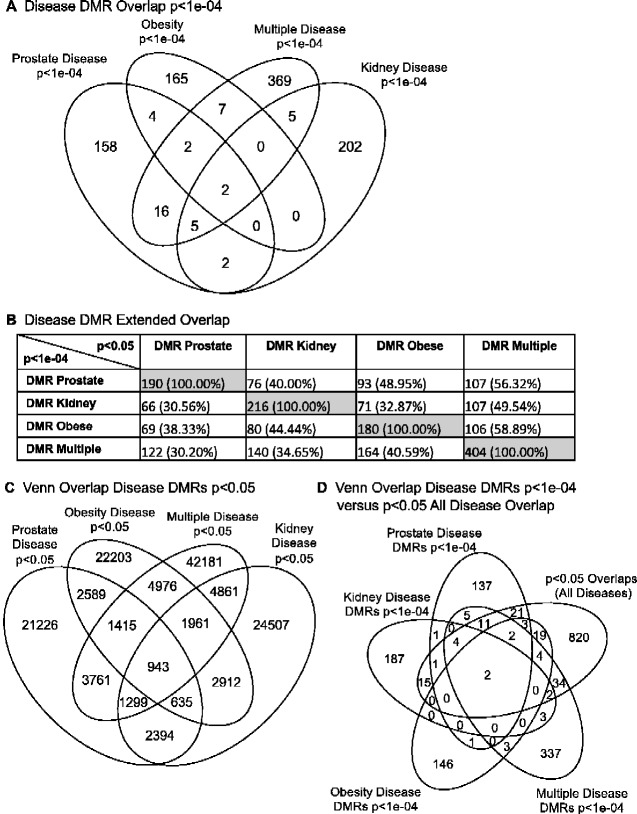
The cauda epididymal sperm were collected from 1 year methoxychlor lineage males, as described in the Methods [13]. Purified sperm DNA from individual animals was isolated, fragmented, and methylated DNA was collected using a methyl-cytosine precipitating antibody. The methylated DNA immunoprecipitation (MeDIP) procedure is described in the Methods. MeDIP fragments were sequenced and analysed to determine differential DMRs for specific diseases by comparing DNA methylation in animals with a specific disease to those with no disease within the methoxychlor lineage (see Methods). The MeDIP-Seq procedure was used due to the low CpG density bias of the protocol that allows >90% of the genome to be analysed. The specific animal samples used are identified in Table 1. The number of DMRs identified at various threshold edgeR P-values for all the DMRs, and those having multiple 1 kb windows, are presented in Fig. 1. The majority of the DMRs had 1 significant 1 kb window at P < 1e-04, and this significance level was selected for all subsequent analyses. At a statistical threshold of P < 1e-04, there were 190 DMR associated with prostate disease, 216 DMR associated with kidney disease, 180 DMR associated with obesity, and 404 DMR associated with multiple ≥ 2 disease (Fig. 1). The lists of DMRs, chromosomal sites, and genomic features are presented in Supplementary Tables S2–S5. The log-fold change in DNA methylation is presented and an increase in DNA methylation is associated with 42% of the prostate disease DMRs, 44% of the kidney disease DMRs, 52% of the obesity DMRs, and 57% of the multiple disease DMRs. The chromosomal locations of prostate, kidney, obesity and multiple-disease specific DMRs are presented in Fig. 2. DMR are located on all chromosomes, except for the Y-chromosome and mitochondrial DNA. The genomic features of the DMRs initially examined the CpG density, Fig. 3A, C, E, and G. CpG density of 1–3 CpGs per 100 bp is predominant. These low CpG density regions of the genome are considered CpG deserts, and have previously been shown to be associated with transgenerational DMRs [20]. The DMR length was similar across the different disease specific DMRs, and was predominantly 1 kb in length. (Fig. 3B, D, F, and H). A principal components analysis (PCA) of the DMRs of the diseased and non-diseased animals within the methoxychlor lineage was performed for each disease set (prostate, kidney, obesity, multiple disease), Fig. 4. These results show that diseased animal DMRs clustered separately from the non-diseased DMR for each disease DMR set when using only DMR sites for the PCA analysis.
Figure 1:
DMR identification and numbers. The number of DMRs found using different P-value cutoff thresholds. The All Window column shows all DMRs. The Multiple Window column shows the number of DMRs containing at ≥2 significant windows (1 kb each). Also shown is the number of DMRs with the number of significant windows (1 kb per window) at a P-value threshold P < 1e-04 for DMR. (A) Prostate disease DMRs; (B) Kidney disease DMRs; (C) Obesity disease DMRs; and (D) Multiple disease DMRs.
Figure 2:
DMR chromosomal locations. The DMR locations on the individual chromosomes are represented with an arrowhead and a cluster of DMRs with a black box. All DMRs containing at least one significant window at P < 1e-04 threshold are shown. The chromosome number and size of the chromosome (megabases) are presented. (A) Prostate disease DMRs; (B) Kidney disease DMRs; (C) Obesity disease DMRs; and (D) Multiple disease DMRs.
Figure 3:
DMR genomic features. The number of DMRs at different CpG densities and DMR lengths. All DMRs at a P-value threshold of P < 1e-04 are shown. (A) Prostate disease DMR CpG density; (B) Prostate disease DMR length; (C) Kidney disease DMR CpG density; (D) Kidney disease DMR length; (E) Obesity disease DMR CpG density; (F) Obesity disease DMR length; (G) Multiple disease DMR CpG density; (H) Multiple disease DMR length.
Figure 4:
DMR principal component analysis (PCA). The first two principal components are shown. The underlying data is the RPKM read depth for DMR only genomic windows. (A) Prostate disease DMRs PCA; (B) Kidney disease DMRs PCA; (C) Obesity disease DMRs PCA; (D) Multiple disease DMRs PCA.
A relatively stringent edgeR P-value of P < 1e-04 was used to determine the disease specific DMRs. The number of DMR in common between disease sets at this P-value is negligible, ranging from 2 to 16 DMRs in common with multiple disease having the most overlap (Fig. 5A). Only two DMR were in common among all four disease DMR sets. The DMR identification of the first overlap is DMR7:109145001 in all analyses with an associated gene Zfat. The second overlap has the DMR7:109259001 in the prostate and multiple analyses and DMR7:109261001 in the kidney and obesity analyses. An extended overlap between DMR sets at a relaxed P-value of P < 0.05 and the P < 1e-04 disease DMRs was performed to assess if greater overlap was present. As observed, between 30 and 60% of the DMRs overlapped between the different diseases, Fig. 5B. For example, the 190 prostate disease DMRs at P < 1e-04, had an extended overlap of 93 DMRs (49%) that are shared with the P < 0.05 obesity DMR set. An overlap of the disease specific DMRs with a P < 0.05 is shown in Fig. 5C. The total number of DMRs is dramatically increased at this less stringent P-value cut off P < 0.05. A comparison of all diseases showed that there were 943 DMRs in common, Fig. 5C. A comparison of these overlapping 943 DMRs in common with all diseases at P < 0.05 with the P < 1e-04 DMRs showed no overlap, other than the 2 DMRs previously observed above, Fig. 5D. Therefore, no overlapping group of DMRs for all diseases was identified. The relaxed P-value comparisons demonstrated the disease specific DMRs were predominantly distinct with only two common between all the different diseases.
Figure 5:
overlap of specific disease epimutations. (A) Venn diagram of P < 1e-04 analysis for specific disease associated DMRs. The overlap of each specific disease DMR set is presented. (B) Extended overlap disease DMRs. Specific disease DMR sets P < 1e-04 are compared to DMR sets at P < 0.05 to identify potential overlap between the different pathologies with DMR number and perpage of the total presented. The gray highlight is the expanded 100% overlap. (C) Venn overlap disease DMRs at P < 0.05. Increased number of DMRs to generate the all disease common 943 DMRs. (D) Venn overlap of disease DMRs P < 1e-04 with the 943 DMRs common to all diseases at P < 0.05.
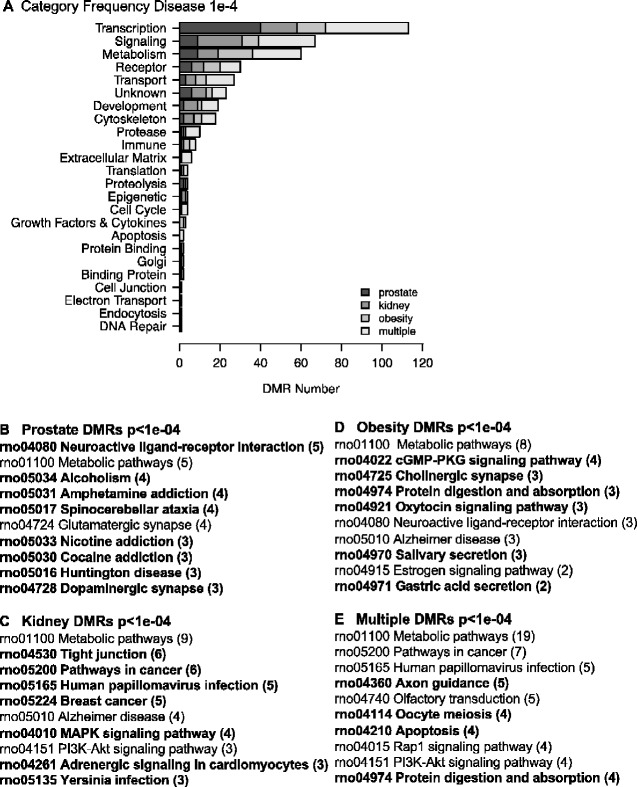
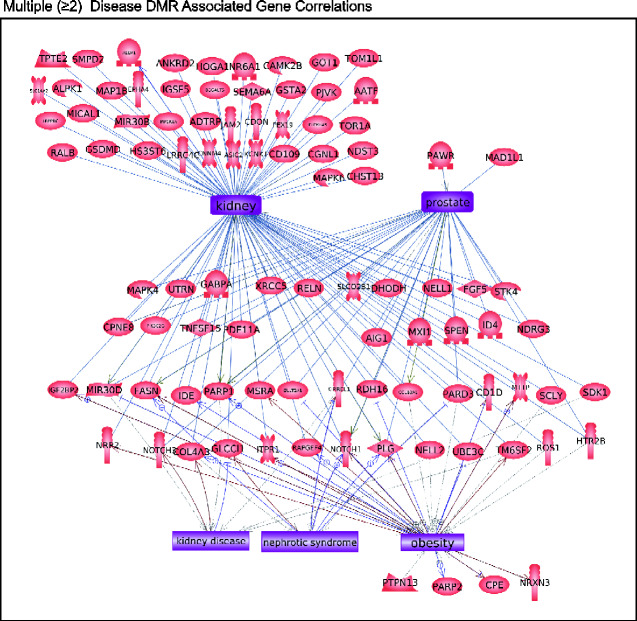
The disease specific DMR-associated genes are listed in Supplementary Tables S2–S5, and demonstrate 55–64% of the DMRs have associated genes within 10 kb. This 10 kb annotation window was chosen so as to include the gene promoters. A gene functional categorization demonstrates the highest numbers of genes fall into the known highly populated transcription, signaling, metabolism and receptor categories. Other functional categories represented include cytoskeletal elements, developmental process, and epigenetics (Fig. 6A). Further insights into the potential functions of the DMR-associated genes were investigated by determining which physiological pathways have DMR-associated genes using the KEGG pathway database (Kyoto Encyclopedia of Genes and Genomes) (Fig. 6B–E). Those pathways with a statistically over-represented number of DMR-associated genes are indicated (Fig. 6B–E bold). The prostate disease DMR set contains genes in pathways that include the neuroactive ligand–receptor interaction pathway. The kidney disease DMR set contains genes in pathways that include those for tight junction and cancer. The obesity DMR set contains genes in pathways that include cGMP–PKG signaling and digestion-related pathways. The multiple disease DMR set contains genes in pathways including those for cancer, axon guidance, and apoptosis, Fig. 6E. Other than metabolic pathways, limited overlap was observed between the different disease correlated pathways. A final analysis of the potential functions of genes associated with disease specific DMRs investigated links in the published literature with known correlated genes and the specific disease or organ. Pathway Studio software (Elsevier, Inc.) was used for this analysis of associated tissue disease and pathology. The prostate disease DMR-associated genes had a large number of previously identified prostate and prostate cancer associated genes, Fig. 7A. The kidney disease DMR-associated genes had a large number of kidney and associated pathologies correlated genes, Fig. 7B. The obesity DMR-associated genes also had a large number of obesity and related pathology associated genes previously identified in the literature, Fig. 7C. The multiple disease DMRs had the highest number of associated genes previously identified in the literature with disease links, Fig. 8. Interestingly, the different genes identified were associated with each of the individual different diseases analysed. The prostate disease, kidney disease, and obesity were all represented in the multiple disease DMR-associated genes.
Figure 6:
DMR-associated gene categories. (A) DMR-associated gene categories. The different gene categories and number disease specific DMR is presented. (B) DMR-associated prostate disease KEGG gene pathways. (C) DMR-associated kidney disease KEGG gene pathways. (D) DMR-associated obesity KEGG gene pathways. (E) DMR-associated multiple disease KEGG gene pathways. KEGG pathways with a statistically significant over-representation of DMR-associated genes are indicated in bold.
Figure 7:
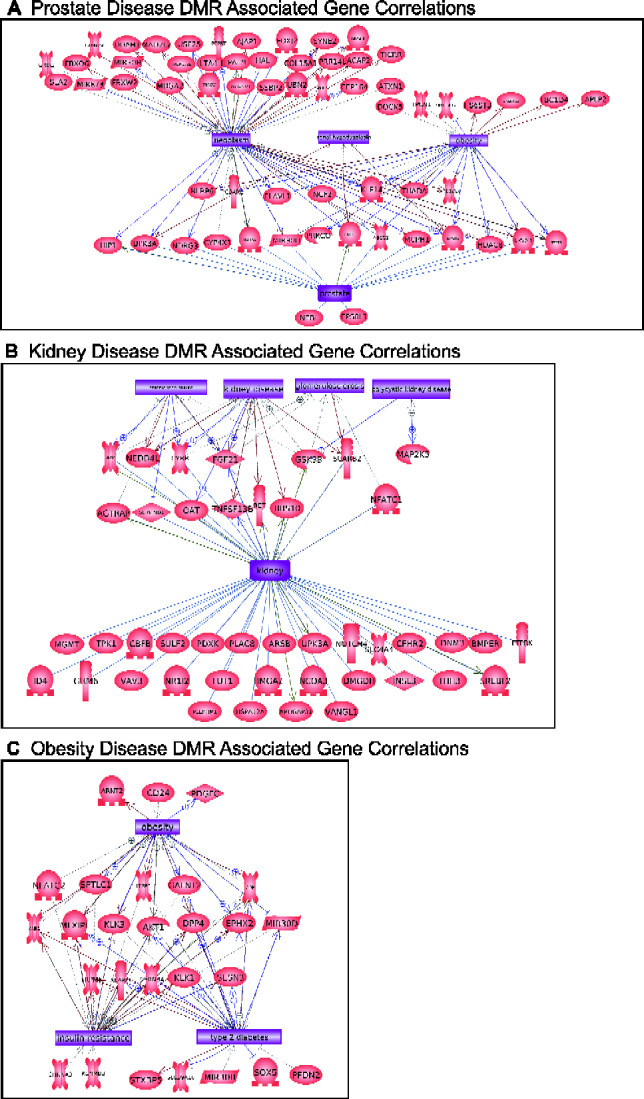
DMR-associated genes within the pathology biomarker DMR set for each individual pathology. Direct gene links to pathologies and physiologic processes are shown. (A) Prostate disease, (B) Kidney disease, and (C) Obesity.
Figure 8:
DMR-associated genes within the pathology biomarker DMR set for multiple disease pathology. Direct gene links to pathologies and physiologic processes are shown.
Discussion
Previously, we have demonstrated exposure to methoxychlor during gestation resulted in the epigenetic transgenerational inheritance of disease susceptibility in the F3 generation great-grand offspring rats [13]. Diseases observed included kidney disease, ovarian disease, obesity, and an increased rate of animals with multiple diseases. Transgenerational alterations in sperm DNA methylation were observed following ancestral methoxychlor exposure [13]. This is an example of generational toxicology, and it appears to be mediated by transgenerational inheritance of epimutations present in sperm or eggs [1, 21]. In the current study, sperm samples from these same male rats are re-analysed to potentially identify disease specific DMRs within the methoxychlor lineage. Comparisons of DNA methylation in rats with a specific disease (prostate, kidney, obesity, or multiple diseases) were made to those with no disease. Potential disease specific DMR patterns that could act as biomarkers of specific disease were investigated. The current analysis used an updated pathology analysis and MeDIP-seq procedure (methylated DNA immunoprecipitation (MeDIP) followed by next-generation sequencing), rather than the microarray-based MeDIP-Array procedure used previously [13]. The advantage of this updated procedure is that DNA methylation can be detected in in the majority (>90%) of the genome, rather than being limited to those sites present on the microarray.
Results demonstrate that distinct sets of DMRs may be associated with kidney disease, prostate disease, obesity, and the presence of multiple diseases; however, high levels of noise should be considered. Observations suggest DMR signatures could potentially be used as biomarkers of disease susceptibility [15–17]. Prostate disease is prevalent in the human population, affecting 50% of males over the age of 50 and 100% of males over the age of 70 in the USA [22]. Obesity is also an increasing health care concern in the human population, and affects more than 46% of males in the United States and Europe [23].
The EWAS identified disease associated DMR sets that are predominantly specific to each disease investigated at the statistical threshold of P < 1e-04 (Fig. 5A). The largest overlaps occur, as might be expected, between the multiple disease category and each individual disease. Overlaps between disease DMR sets were also evaluated at a more relaxed statistical threshold, in which each DMR set at P < 1e-04 was compared to larger DMR sets for every other disease at the more relaxed P-value of P < 0.05 (Fig. 5B). There was considerable (30–50%) overlap at this lower stringency extended overlap between two different diseases. To address the question of whether a group of DMRs may be common between all the different diseases, an overlap DMR set at P < 0.05 across all diseases was obtained (Fig. 5C) and then compared to the higher stringency P < 1e-04 DMRs (Fig. 5D). No additional common DMRs were identified. Therefore, observations did not identify a common set of DMRs that may unbalance the physiology of animals and predispose them to disease in general, but instead suggest high-stringency DMRs are more tightly associated with specific diseases. Further analysis of this possibility with a wider variety of transgenerational exposures and both rodent and human studies is required. However, this novel observation provides insights into the epigenomic and molecular basis of disease etiology.
Epigenetic modification such as DMRs has the potential to alter gene expression and genome activity. DMR changes in germ cells have been shown to result in increased disease susceptibility in subsequent offspring. Many of the DMRs characterized in this and other studies were not co-localized with known genes. This does not exclude them from affecting gene expression distally through mechanisms such as non-coding RNA expression and changes in chromosome conformation [1–4]. Future studies are required to better understand the specific downstream impacts of epimutations in intergenic regions. In the current study, the functional links of DMR-associated genes were investigated in order to provide insights into how alterations of these DMRs might promote disease. Overall, it was common for DMR-associated genes to be involved in cell signaling and transcription processes (Fig. 6A), in part due to the size of these gene categories. Disease specific DMR sets had DMR-associated genes that were previously shown to be associated with the specific disease, or with the specific organ function (Figs. 7 and 8). For example, the kidney disease DMR set included 43 DMR-associated genes that were known to have links to either kidney disease or kidney function. These results provide possible mechanisms by which epigenetic changes can be passed transgenerationally, and therefore alter gene expression and potentially promote disease susceptibility.
Disease specific DMR sets were determined by comparing DNA methylation in animals with a particular disease to animals having no disease, within the F3 generation methoxychlor-exposed lineage (Table 1). There were four animals with prostate disease, three with kidney disease, four with obesity and eight with multiple disease that were compared with five animals with no disease. Higher numbers of diseased and non-diseased animals to evaluate would result in more robust epigenetic biomarkers of disease, but the current study provides a proof of concept that such epigenetic biomarkers can be identified and potentially used as diagnostics for disease susceptibility. Future larger studies should use increased numbers of diseased and non-diseased samples, and test whether a disease specific epigenetic biomarker signature can predict future development of disease.
Therefore, a limitation of the current study was the low numbers of animals with a specific individual disease. Although an edgeR P-value was used to identify and analyse the disease biomarker DMRs, analysis for multiple testing error for false discovery rate (FDR) only provided FDR values for the disease biomarkers at P < 0.1 for a reduced number of DMRs (data not shown). Previous studies have demonstrated a limitation in FDR analysis for low numbers of samples due to the presumptions in the multiple testing parameters [24–29]. Therefore, the low sample number is a limitation in the current analysis. Potential higher variability in the data needs to be considered even though stringent edgeR P-values were used, but this does not address multiple testing correction concerns. Future studies will need to use higher n-values and/or corrected FDR analysis to reduce this analysis limitation [24–29].
In summary, previous work showed that ancestral exposure to methoxychlor resulted in the epigenetic transgenerational inheritance of increased susceptibility to disease in rats. The current study determined through an EWAS that disease specific signatures (i.e. patterns) of DMRs exist for these transgenerational rats, which may serve as potential epigenetic biomarkers for prostate disease, kidney disease, obesity, and the presence of multiple disease. In the future, similar epigenetic biomarkers could potentially be developed and validated for humans as another tool to inform health decisions and allow for preventative medicine and the improved management of disease.
Methods
Animal Studies and Breeding Summary
As previously described, outbred Sprague Dawley SD male and female rats were fed and watered under standard conditions and mated at 3–5 months of age [13]. Gestating female rats were treated with 200 mg/kg body weight methoxychlor (treated group) or with DMSO vehicle (control group) from days 8–14 of pregnancy. The gestating female rats treated were designated as the F0 generation. The offspring of the F0 generation rats were the F1 generation. Non-littermate females and males aged 70–90 days from F1 generation of methoxychlor or control lineages were bred to obtain F2 generation offspring. The F2 generation rats were bred to obtain F3 generation offspring. Only the F0 generation received treatments. Onset of puberty was assessed in males starting at 35 days of age by the presence of balano-preputial separation. The F3 generation was aged to 1 year and pathologies were assessed, as described below. Sperm were isolated, and DNA was used for epigenetic analysis then correlated to each individual’s disease state, as described below. All experimental protocols for the procedures with rats were pre-approved by the Washington State University Animal Care and Use Committee (protocol IACUC # 2568), and all methods were performed in accordance with the relevant guidelines and regulations.
Tissue Harvest and Histological Processing
Rats were euthanized at 12 months of age by CO2 inhalation and cervical dislocation for tissue harvest. Upon dissection, a brief examination of abdominal and thoracic organs was performed to look for obvious abnormalities. Testis, prostate, and kidney were fixed in Bouin’s solution (Sigma) followed by 70% ethanol, then processed for paraffin embedding and sectioning. Paraffin five micrometer sections were processed and stained with hematoxylin and eosin (H & E) using standard procedures for histopathological examination. Tissue embedding, sectioning, and staining were performed by Nationwide Histology, Spokane WA, USA.
Digital Image Histopathology Examination and Disease Classification
Stained testis, prostate, and kidney slides were imaged through a microscope using 4× objective lenses (testis and prostate) or 10× objective lenses (kidney). Tiled images were captured using a digital camera. Tiled images for each tissue were photo-merged into a single image using Adobe Photoshop (ver. 21.1.2, Adobe, Inc.). Images were evaluated and pathology features digitally marked using Photoshop software. Histopathology readers were trained to recognize the specific abnormalities evaluated in rat testis, ventral prostate, and kidney (see below). Two individuals blinded to the exposure evaluated each tissue image for abnormalities. If there was disagreement about the disease status, then a third individual blinded to the exposure evaluated the tissue. A set of quality control (QC) slides was generated for each tissue and was read by each reader prior to evaluating any set of experimental slides. These QC slide results are monitored for reader accuracy and concordance.
As previously described [13], testis histopathology criteria included the presence of vacuoles in the seminiferous tubules, azoospermic atretic seminiferous tubules, and ‘other’ abnormalities including sloughed spermatogenic cells in center of the tubule and a lack of a tubule lumen. Prostate histopathology criteria included the presence of vacuoles in the glandular epithelium, atrophic glandular epithelium, and hyperplasia of prostatic gland epithelium. Kidney histopathology criteria included reduced size of glomerulus, thickened Bowman’s capsule, and the presence of proteinaceous fluid-filled cysts >50µm in diameter. A cut-off was established to declare a tissue ‘diseased’ based on the mean number of histopathological abnormalities plus 1.5 standard deviations from the mean of control group tissues. This number (i.e. greater than 1.5 standard deviations) was used to classify rats into those with and without testis, prostate, or kidney disease in each lineage.
Epididymal Sperm Collection, Purification and DNA Isolation
As previously described [30], the epididymis was dissected free of fat and connective tissue, the cauda incised, and placed into 6 ml of phosphate buffer saline (PBS) for 20 min at room temperature. The tissue was then minced, the released sperm pelleted at 4°C 3000 × g for 10 min, then resuspended in NIM buffer and stored at −80°C for further processing.
Sperm nuclei are resistant to sonication, while somatic cell contamination is destroyed by sonication. Upon thawing sperm, somatic cells were destroyed and debris removed from the sperm suspension by brief sonication (Fisher Sonic Dismembrator, model 300, power 25), then centrifugation and washing 1–2 times in 1×PBS. The resulting pellet was resuspended in 820 µL DNA extraction buffer [31], 80 µl 0.1 M DTT added, then incubated at 65°C for 15 min. Eighty µl proteinase K (20 mg/ml) was added and the sample was incubated at 55°C for 2–4 h under constant rotation. Protein was removed by addition of protein precipitation solution (300 µl, Promega A795A), incubation for 15 min on ice, then centrifugation at 13 500 rpm for 30 min at 4°C. DNA was precipitated from one ml of the supernatant with 2 µl of glycoblue (Invitrogen, AM9516) and 1 ml of cold 100% isopropanol. The sample was centrifuged at 13 500 × g for 30 min at 4°C, then washed with 70% cold ethanol. The pellet was air-dried for about 5 min then resuspended in 100 µl of nuclease free water.
Methylated DNA Immunoprecipitation (MeDIP)
As previously described [30], genomic DNA was sonicated and an aliquot electrophoresed on a 1.5% agarose gel for fragment size verification. The sonicated DNA was then diluted with TE buffer, heat-denatured for 10 min at 95°C, and immediately cooled on ice for 10 min to create single-stranded DNA fragments. Then 100 μl of 5× IP buffer and 5 μg of antibody (monoclonal mouse anti 5-methyl cytidine; Diagenode #C15200006) were added, and the mixture was incubated overnight with rotation at 4°C. The following day, magnetic beads (Dynabeads M-280 Sheep anti-Mouse IgG; Life Technologies 11201 D) were pre-washed per manufacturer’s instructions, and 50 μl of beads were added to the DNA–antibody mixture and incubated for 2 h with rotation at 4°C. The samples were then washed three times with 1× IP buffer using a magnetic rack. The washed samples were then resuspended in 250 μl digestion buffer (5 mM Tris PH 8, 10 mM EDTA, 0.5% SDS) with 3.5 μl Proteinase K (20 mg/ml), and incubated for 2–3 h with rotation at 55°. DNA clean-up was performed using a Phenol–Chloroform–Isoamyalcohol extraction, and the supernatant precipitated with 2 μl of Glycoblue (20 mg/ml), 20 μl of 5 M NaCl, and 500 μl ethanol at −20°C for one to several hours. The DNA precipitate was pelleted, washed with 70% ethanol, then dried and resuspended in 20 μl H2O or TE. DNA concentration was measured in Qubit (Life Technologies) with the ssDNA kit (Molecular Probes Q10212).
MeDIP-Seq Analysis
MeDIP DNA was used to create libraries for next-generation sequencing (NGS) using the NEBNext Ultra RNA Library Prep Kit for Illumina (San Diego, CA) starting at step 1.4 of the manufacturer’s protocol to generate double stranded DNA from the single-stranded DNA resulting from MeDIP. After this step, the manufacturer’s protocol was followed indexing each sample individually with NEBNext Multiplex Oligos for Illumina. The WSU Spokane Genomics Core sequenced the samples on the Illumina HiSeq 2500 at PE50, with a read size of approximately 50 bp and approximately 20 million reads per pool.
Statistics and Bioinformatics
The DMR identification and annotation methods are similar to those previously reported [15, 31]. Data quality was assessed using the FastQC program (https://www.bioinformatics.babraham.ac.uk/projects/fastqc/), and reads were cleaned and filtered to remove adapters and low quality bases using Trimmomatic [32]. The reads for each MeDIP sample were mapped to the Rnor 6.0 rat genome using Bowtie2 [33] with default parameter options. The mapped read files were then converted to sorted BAM files using SAMtools [34]. The MEDIPS R package [35] was used to calculate differential coverage between control and disease sample groups. The edgeR P-value [36] was used to determine the relative difference between the two groups for each 1000 bp genomic window. Windows with an edgeR P-value less than an arbitrarily selected threshold were considered DMRs. The DMR edges were extended until no genomic window with an edgeR P-value less than 0.1 remained within 1000 bp of the DMR.
DMRs were annotated using the biomaRt R package [37] to access the Ensembl database [38]. The genes that associated with DMR were then input into the KEGG pathway search [39, 40] to identify associated pathways. The DMR-associated genes were then automatically sorted into functional groups using information provided by the DAVID [41] and Panther [42] databases incorporated into an internal curated database (www.skinner.wsu.edu under genomic data). All molecular data has been deposited into the public database at NCBI (GEO # GSE158086) and R code computational tools available at GitHub (https://github.com/skinnerlab/MeDIP-seq) and www.skinner.wsu.edu.
Over-representation of DMR-associated genes in KEGG pathways was determined by Fisher’s Exact Test using the following online calculator: https://www.socscistatistics.com/tests/fisher/default2.aspx. Test parameters were (i) Number of transcribed genes in rat genome equal to approximately 30 000. (ii) Number of DMR-associated genes for each disease group (Supplementary Tables S2–S5). (iii) Number of genes in each KEGG pathway. Number of DMR-associated genes which overlapped with those of each KEGG pathway (Fig. 6B–E).
Supplementary data
Supplementary data are available at EnvEpig online.
Supplementary Material
Acknowledgements
We acknowledge Ms. Michelle Pappalardo, Mr. Ryan Thompson, Ms. Skylar Shea Davidson, Ms. Makena Horne, Ms. Emma Impala, and Ms. Rachel LaRosa for technical assistance. We acknowledge Ms. Amanda Quilty for editing and Ms. Heather Johnson for assistance in preparation of the manuscript. We thank the Genomics Core laboratory at WSU Spokane for sequencing data.
Funding
This study was supported by John Templeton Foundation (50183 and 61174) (https://templeton.org/) grants to M.K.S. and NIH (ES012974) (https://www.nih.gov/) grant to M.K.S.
Conflict of interest statement. None declared.
Data availability
All molecular data has been deposited into the public database at NCBI (GEO # GSE158086), and R code computational tools are available at GitHub (https://github.com/skinnerlab/MeDIP-seq) and www.skinner.wsu.edu.
References
- 1. Nilsson E, Sadler-Riggleman I, Skinner MK.. Environmentally induced epigenetic transgenerational inheritance of disease. Environ Epigenet 2018;4:dvy016. [DOI] [PMC free article] [PubMed] [Google Scholar]
- 2. Soubry A. Epigenetic inheritance and evolution: a paternal perspective on dietary influences. Prog Biophys Mol Biol 2015;118:79–85. [DOI] [PubMed] [Google Scholar]
- 3. Vaiserman AM, Koliada AK, Jirtle RL.. Non-genomic transmission of longevity between generations: potential mechanisms and evidence across species. Epigenetics Chromatin 2017;10:38. [DOI] [PMC free article] [PubMed] [Google Scholar]
- 4. Legoff L, D’Cruz SC, Tevosian S, Primig M, Smagulova F.. Transgenerational inheritance of environmentally induced epigenetic alterations during mammalian development. Cells 2019;8:1559. [DOI] [PMC free article] [PubMed] [Google Scholar]
- 5. Waterland RA. Epigenetic mechanisms and gastrointestinal development. J Pediatr 2006;149:S137–42. [DOI] [PubMed] [Google Scholar]
- 6. Skinner MK, G.-B C.. Environmental signals and transgenerational epigenetics. Epigenomics 2009;1:111–7. [DOI] [PMC free article] [PubMed] [Google Scholar]
- 7. Skinner MK. What is an epigenetic transgenerational phenotype? F3 or F2. Reprod Toxicol 2008;25: 2–6. [DOI] [PMC free article] [PubMed] [Google Scholar]
- 8. Skinner MK. Environmental epigenetic transgenerational inheritance and somatic epigenetic mitotic stability. Epigenetics 2011;6:838–42. [DOI] [PMC free article] [PubMed] [Google Scholar]
- 9. Methoxychlor. IARC Monogr Eval Carcinog Risk Chem Hum 1979;20:259–81. [PubMed] [Google Scholar]
- 10. Cummings AM. Methoxychlor as a model for environmental estrogens. Crit Rev Toxicol 1997;27:367–79. [DOI] [PubMed] [Google Scholar]
- 11. EPA. Methoxychlor Reregistration Eligibility Decision (RED), Publication No. EPA 738-R-04-010 2004. https://archive.epa.gov/pesticides/reregistration/web/html/methoxychlor_red.html (11 May 2020, date last accessed)
- 12. Duggan RE, Corneliussen PE, Duggan MB, McMahon BM, Martin RJ.. Pesticide residue levels in foods in the United States from July 1, 1969, to June 30, 1976: summary. J Assoc Off Anal Chem 1983;66:1534–5. [PubMed] [Google Scholar]
- 13. Manikkam M, Haque MM, Guerrero-Bosagna C, Nilsson E, Skinner MK.. Pesticide methoxychlor promotes the epigenetic transgenerational inheritance of adult onset disease through the female germline. PLoS One 2014;9:e102091. [DOI] [PMC free article] [PubMed] [Google Scholar]
- 14. Manikkam M, Guerrero-Bosagna C, Tracey R, Haque MM, Skinner MK.. Transgenerational actions of environmental compounds on reproductive disease and identification of epigenetic biomarkers of ancestral exposures. PLoS One 2012;7:e31901. [DOI] [PMC free article] [PubMed] [Google Scholar]
- 15. McBirney M, King SE, Pappalardo M, Houser E, Unkefer M, Nilsson E, Sadler-Riggleman I, Beck D, Winchester P, Skinner MK.. Atrazine induced epigenetic transgenerational inheritance of disease, lean phenotype and sperm epimutation pathology biomarkers. PLoS One 2017;12:e0184306. [DOI] [PMC free article] [PubMed] [Google Scholar]
- 16. Nilsson E, King SE, McBirney M, Kubsad D, Pappalardo M, Beck D, Sadler-Riggleman I, Skinner MK.. Vinclozolin induced epigenetic transgenerational inheritance of pathologies and sperm epimutation biomarkers for specific diseases. PLoS One 2018;13:e0202662. [DOI] [PMC free article] [PubMed] [Google Scholar]
- 17. King SE, McBirney M, Beck D, Sadler-Riggleman I, Nilsson E, Skinner MK.. Sperm epimutation biomarkers of obesity and pathologies following DDT induced epigenetic transgenerational inheritance of disease. Environ Epigenet 2019;5:dvz008. [DOI] [PMC free article] [PubMed] [Google Scholar]
- 18. Palanza P, Morellini F, Parmigiani S, vom Saal FS.. Ethological methods to study the effects of maternal exposure to estrogenic endocrine disrupters: a study with methoxychlor. Neurotoxicol Teratol 2002;24:55–69. [DOI] [PubMed] [Google Scholar]
- 19. Toxicological Profile for Methoxychlor 2002. https://www.atsdr.cdc.gov/toxprofiles/tp47.pdf (11 May 2020, date last accessed). [PubMed]
- 20. Skinner MK, Guerrero-Bosagna C.. Role of CpG Deserts in the Epigenetic Transgenerational Inheritance of Differential DNA Methylation Regions. BMC Genomics 2014;15: 692. [DOI] [PMC free article] [PubMed] [Google Scholar]
- 21. Ben Maamar M, King SE, Nilsson E, Beck D, Skinner MK.. Epigenetic transgenerational inheritance of parent-of-origin allelic transmission of outcross pathology and sperm epimutations. Dev Biol 2020;458:106–19. [DOI] [PMC free article] [PubMed] [Google Scholar]
- 22. Rawla P. Epidemiology of prostate cancer. World J Oncol 2019;10: 63–89. [DOI] [PMC free article] [PubMed] [Google Scholar]
- 23. Hales CM, Carroll MD, Fryar CD, Ogden CL.. Prevalence of obesity among adults and youth: United States, 2015-2016. NCHS Data Brief 2017;288:1–8. [PubMed] [Google Scholar]
- 24. Devlin B, Roeder K, Wasserman L.. Analysis of multilocus models of association. Genet Epidemiol 2003;25:36–47. [DOI] [PubMed] [Google Scholar]
- 25. Higdon R, van Belle G, Kolker E.. A note on the false discovery rate and inconsistent comparisons between experiments. Bioinformatics 2008;24:1225–8. [DOI] [PubMed] [Google Scholar]
- 26. Yang H, Churchill G.. Estimating p-values in small microarray experiments. Bioinformatics 2007;23:38–43. [DOI] [PubMed] [Google Scholar]
- 27. Bretz F, Landgrebe J, Brunner E.. Multiplicity issues in microarray experiments. Methods Inf Med 2005;44:431–7. [PubMed] [Google Scholar]
- 28. Jung SH. Sample size and power calculation for molecular biology studies. Methods Mol Biol 2010;620:203–18. [DOI] [PubMed] [Google Scholar]
- 29. Nilsson R, Bjorkegren J, Tegner J.. On reliable discovery of molecular signatures. BMC Bioinformatics 2009;10:38. [DOI] [PMC free article] [PubMed] [Google Scholar]
- 30. Kubsad D, Nilsson EE, King SE, Sadler-Riggleman I, Beck D, Skinner MK.. Assessment of glyphosate induced epigenetic transgenerational inheritance of pathologies and sperm epimutations: generational toxicology. Sci Rep 2019;9:6372. [DOI] [PMC free article] [PubMed] [Google Scholar]
- 31. Ben Maamar M, Sadler-Riggleman I, Beck D, McBirney M, Nilsson E, Klukovich R, Xie Y, Tang C, Yan W, Skinner MK.. Alterations in sperm DNA methylation, non-coding RNA expression, and histone retention mediate vinclozolin-induced epigenetic transgenerational inheritance of disease. Environ Epigenet 2018;4:dvy010. [DOI] [PMC free article] [PubMed] [Google Scholar]
- 32. Bolger AM, Lohse M, Usadel B.. Trimmomatic: a flexible trimmer for Illumina sequence data. Bioinformatics 2014;30:2114–20. [DOI] [PMC free article] [PubMed] [Google Scholar]
- 33. Langmead B, Salzberg SL.. Fast gapped-read alignment with Bowtie 2. Nat Methods 2012;9:357–9. [DOI] [PMC free article] [PubMed] [Google Scholar]
- 34. Li H, Handsaker B, Wysoker A, Fennell T, Ruan J, Homer N, Marth G, Abecasis G, Durbin R, Genome S, 1000 Genome Project Data Processing. The Sequence Alignment/Map format and SAMtools. Bioinformatics 2009;25:2078–9. [DOI] [PMC free article] [PubMed] [Google Scholar]
- 35. Lienhard M, Grimm C, Morkel M, Herwig R, Chavez L.. MEDIPS: genome-wide differential coverage analysis of sequencing data derived from DNA enrichment experiments. Bioinformatics 2014;30:284–6. [DOI] [PMC free article] [PubMed] [Google Scholar]
- 36. Robinson MD, McCarthy DJ, Smyth GK.. edgeR: a Bioconductor package for differential expression analysis of digital gene expression data. Bioinformatics 2010;26:139–40. [DOI] [PMC free article] [PubMed] [Google Scholar]
- 37. Durinck S, Spellman PT, Birney E, Huber W.. Mapping identifiers for the integration of genomic datasets with the R/Bioconductor package biomaRt. Nat Protoc 2009;4:1184–91. [DOI] [PMC free article] [PubMed] [Google Scholar]
- 38. Cunningham F, Amode MR, Barrell D, Beal K, Billis K, Brent S, Carvalho-Silva D, Clapham P, Coates G, Fitzgerald S, Gil L, Giron CG, Gordon L, Hourlier T, Hunt SE, Janacek SH, Johnson N, Juettemann T, Kahari AK, Keenan S, Martin FJ, Maurel T, McLaren W, Murphy DN, Nag R, Overduin B, Parker A, Patricio M, Perry E, Pignatelli M, Riat HS, Sheppard D, Taylor K, Thormann A, Vullo A, Wilder SP, Zadissa A, Aken BL, Birney E, Harrow J, Kinsella R, Muffato M, Ruffier M, Searle SM, Spudich G, Trevanion SJ, Yates A, Zerbino DR, Flicek P.. Ensembl 2015. Nucleic Acids Res 2015;43:D662–9. [DOI] [PMC free article] [PubMed] [Google Scholar]
- 39. Kanehisa M, Goto S.. KEGG: Kyoto encyclopedia of genes and genomes. Nucleic Acids Res 2000;28:27–30. [DOI] [PMC free article] [PubMed] [Google Scholar]
- 40. Kanehisa M, Goto S, Sato Y, Kawashima M, Furumichi M, Tanabe M.. Data, information, knowledge and principle: back to metabolism in KEGG. Nucl Acids Res 2014;42:D199–205. [DOI] [PMC free article] [PubMed] [Google Scholar]
- 41. Huang da W, Sherman BT, Lempicki RA.. Systematic and integrative analysis of large gene lists using DAVID bioinformatics resources. Nat Protoc 2009;4:44–57. [DOI] [PubMed] [Google Scholar]
- 42. Mi H, Muruganujan A, Casagrande JT, Thomas PD.. Large-scale gene function analysis with the PANTHER classification system. Nat Protoc 2013;8:1551–66. [DOI] [PMC free article] [PubMed] [Google Scholar]
Associated Data
This section collects any data citations, data availability statements, or supplementary materials included in this article.
Supplementary Materials
Data Availability Statement
All molecular data has been deposited into the public database at NCBI (GEO # GSE158086), and R code computational tools are available at GitHub (https://github.com/skinnerlab/MeDIP-seq) and www.skinner.wsu.edu.


