Abstract
Although quantitative MRI can be instrumental in the diagnosis and assessment of disease progression in orbital diseases involving the extra‐ocular muscles (EOM), acquisition can be challenging as EOM are small and prone to eye‐motion artefacts. We explored the feasibility of assessing fat fractions (FF), muscle volumes and water T2 (T2water) of EOM in healthy controls (HC), myasthenia gravis (MG) and Graves' orbitopathy (GO) patients. FF, EOM volumes and T2water values were determined in 12 HC (aged 22‐65 years), 11 MG (aged 28‐71 years) and six GO (aged 28‐64 years) patients at 7 T using Dixon and multi‐echo spin‐echo sequences. The EOM were semi‐automatically 3D‐segmented by two independent observers. MANOVA and t‐tests were used to assess differences in FF, T2water and volume of EOM between groups (P < .05). Bland–Altman limits of agreement (LoA) were used to assess the reproducibility of segmentations and Dixon scans. The scans were well tolerated by all subjects. The bias in FF between the repeated Dixon scans was −0.7% (LoA: ±2.1%) for the different observers; the bias in FF was −0.3% (LoA: ±2.8%) and 0.03 cm3 (LoA: ± 0.36 cm3) for volume. Mean FF of EOM in MG (14.1% ± 1.6%) was higher than in HC (10.4% ± 2.5%). Mean muscle volume was higher in both GO (1.2 ± 0.4 cm3) and MG (0.8 ± 0.2 cm3) compared with HC (0.6 ± 0.2 cm3). The average T2water for all EOM was 24.6 ± 4.0 ms for HC, 24.0 ± 4.7 ms for MG patients and 27.4 ± 4.2 ms for the GO patient. Quantitative MRI at 7 T is feasible for measuring FF and muscle volumes of EOM in HC, MG and GO patients. The measured T2water was on average comparable with skeletal muscle, although with higher variation between subjects. The increased FF in the EOM in MG patients suggests that EOM involvement in MG is accompanied by fat replacement. The unexpected EOM volume increase in MG may provide novel insights into underlying pathophysiological processes.
Keywords: extra‐ocular muscles, eye diseases, eye muscles, Graves' orbitopathy, muscle MRI, myasthenia gravis, quantitative MRI
MRI can play a role in the diagnosis and assessment of disease progression in orbital disease involving the extra‐ocular muscles. We explored the feasibility of quantitative MRI in extra‐ocular muscles in healthy controls, myasthenia gravis and Graves' orbitopathy patients. We found increases in muscle volume and fat fraction in these patients.
Abbreviations used
- AChR
acetylcholine receptor
- EOM
extra‐ocular muscles
- EPG
extended phase graphs
- FF
fat fraction
- GO
Graves' orbitopathy
- HMS
hereditary motor and sensory neuropathy
- IR
inferior rectus muscle
- LP
levator palpebrae muscle
- LR
lateral rectus muscle
- MG
myasthenia gravis
- MR
medial rectus muscle
- MSE
multi‐echo spin‐echo
- MuSK
muscle‐specific tyrosine kinase
- NO
optic nerve
- SR
superior rectus muscle
- SR+LP
superior rectus and levator palpebrae muscle complex
- TM
temporalis muscle
- TSH‐R
thyroid‐stimulating hormone receptor
1. INTRODUCTION
In diseases that involve the extra‐ocular muscles (EOM), local muscle weakness or muscle swelling results in complaints such as double vision and ptosis. The auto‐immune disease myasthenia gravis (MG) is characterized by fatigable muscles. Auto‐antibodies, targeting the acetylcholine receptor (AChR) or muscle‐specific tyrosine kinase (MuSK), disturb transmission at the neuromuscular junction. In 85% of patients, MG starts with diplopia and ptosis, which are both caused by EOM weakness. 1 , 2 Currently, MG is diagnosed by either the presence of auto‐antibodies in serum, or abnormal findings during neurophysiological testing. 3 However, in patients with pure ocular symptoms, the sensitivity of these tests is low (0.44 for testing antibodies, 0.34 for repetitive nerve stimulation and variable between 0.66 and 0.98 for single‐fiber electromyography). 4 Consequently, diagnosis is challenging and more sensitive diagnostic tests are required. 5 Moreover, there is a need for prognostic markers to predict disease progression in ocular MG 6 and refractory MG. 7
Graves' orbitopathy (GO) is an orbital disease caused by auto‐antibodies acting against thyroid proteins, including the thyroid‐stimulating hormone receptor (TSH‐R). 8 , 9 , 10 Due to inflammation and swelling of the EOM, symptoms of GO include upper eyelid retraction, proptosis and diplopia. 11 At a later stage of the disease, fibrosis appears in the EOM as a result of the longstanding inflammation. There is an unmet clinical need to categorize patients, since immunosuppressant medication and radiotherapy are only effective in the active stage of GO. 12
Quantitative MRI can be used to assess disease progression and to study the pathophysiology of skeletal muscle in neuromuscular disease by assessing fat replacement, muscle size and T2 relaxation time changes. 13 Assessment of such structural changes in individual EOM by quantitative MRI may therefore also contribute to understanding the pathophysiology and pattern of muscle involvement of the EOM in orbital disease. 14 , 15 As such, it could contribute to identifying diagnostically challenging subgroups in GO and aid in the follow‐up of therapeutic response in MG.
In the current study we explored the feasibility and value of quantitative MRI of the EOM in MG and GO patients and healthy controls. These specific patient groups were chosen because distinct structural changes are expected in both diseases and additional diagnostic tests could directly improve clinical care. In MG there is histological evidence for fat replacement, fibrosis and atrophy of the EOM, 16 while in GO the EOM are known to be swollen and inflamed at an early stage, and fat‐replaced and fibrotic at a later stage of the disease. 17 However, the EOM are challenging to assess with quantitative MRI. Since they are small, the high resolution needed for MRI of these muscles results in a poor signal‐to‐noise ratio (SNR). In addition, MRI of the EOM is prone to eye‐motion artefacts, which reduce the image quality. Moreover, the surrounding bone from the orbit and air from the nasal sinuses results in an inhomogeneous B0 field. However, recent studies have shown that the increased SNR at 7 T, combined with a cued blinking paradigm to reduce eye‐motion artefacts and localized shimming to minimize B0 artefacts, enables high resolution imaging of the eyes. 18 , 19 Based on these protocols we therefore developed a dedicated protocol for anatomical and functional imaging of the EOM.
2. METHODS
2.1. Participants
All patients were recruited from the outpatient clinics of the neurology and the ophthalmology departments of the Leiden University Medical Center. The diagnosis of MG was confirmed by a neurologist, based on a combination of clinically confirmed fluctuating muscle weakness and the presence of AChR antibodies or abnormal decrement by repetitive nerve stimulation. The diagnosis of GO was confirmed by an ophthalmologist, based on the presence of the characteristic orbital abnormalities (eyelid retraction, redness/swelling of the eyelids/conjunctiva and enlarged EOM or orbital fat) and the presence of anti‐TSH‐R antibodies. For MG and GO patients, both acute (diagnosis less than 3 months ago) and chronic (diagnosis more than 1 year ago) stages of the disease were included, to assess a wide variety of structural changes to study the sensitivity of the dedicated MRI protocol. Healthy controls were recruited from the radiology database for healthy controls.
The local medical ethics committee approved the study and all study participants gave written informed consent prior to MR scanning.
2.2. MR examination
We performed chemical shift‐based water fat separation using the Dixon method to quantify fat replacement and muscle volume and multi‐echo spin‐echo (MSE) to assess the T2 relaxation time of water (T2water) as an indicator of disease activity. 20 All subjects were scanned in supine position on a 7 T Philips Achieva MRI (Philips Healthcare, Best, the Netherlands) using a cued blinking paradigm 3 with the upper 16 elements of a 32‐channel head‐coil (Nova Medical). Patients were asked to blink upon visual cues provided on a screen; the MRI acquisition was halted during blinking. A three‐point multi‐acquisition 3D Dixon scan was acquired (resolution: 0.8 x 0.8 x 0.8 mm3, first time to echo [TE]/ΔTE/repetition time [TR]/flip angle [FA]/scan time: 2.4 ms/0.33 ms/10 ms/3°/3 minutes 50 seconds). The 3D volumetric Dixon scan was planned with the frequency encoding in the left‐right direction and was angulated in the coronal plane if necessary, to include both orbits in the field of view. In a subset of seven MG patients and five healthy controls, a second Dixon scan was acquired (resolution: 0.7 x 1.0 x 0.7 mm3, first TE/ΔTE/TR/FA/scan time: 2.4 ms/0.33 ms/10 ms/3°/3 minutes 50 seconds) to study the value of a higher resolution in the coronal plane, while maintaining the same voxel volume. These Dixon scans with a higher resolution in the coronal plane were used to study the reproducibility of the fat fraction (FF) measurement by comparing them with the isotopic Dixon scan. In another subset of participants, containing five MG patients, one GO patient and seven healthy controls, a MSE scan was acquired per orbit (resolution: 1.2 x 1.2 x 3.0 mm3, first TE/ΔTE/TR: 12 ms/12 ms/4000 ms, 24 echoes, three slices per eye, scan time: 2 minutes 44 seconds). This coronal scan was planned with one orbit in the field of view perpendicular to the medial rectus muscle (MR) and lateral rectus muscle (LR). The scan times were kept under 4 minutes, as previous experience shows this minimizes movement artefacts. Higher order shimming was performed for all scans, to minimize the susceptibility artefacts caused by the bony structures of the orbit and the nasal cavities.
2.3. Data analysis and segmentation
Dixon scans were reconstructed with seven‐peak reconstruction using the manufacturer's software to yield water and fat images. No T2* correction was performed, given the short echo spacing of 0.33 ms. To minimize eye movement artefacts, the scan time was minimized by using a relatively low TR of 10 ms. Correction for the resulting T1‐weighting in the water and fat images was incorporated in the FF calculation, assuming T1 values of 1400 ms (correction factor: 1.22) and 365 ms (correction factor: 1.08) for water and fat, respectively 21 :
Scans were excluded if there were obvious motion artifacts. For the Dixon scans, the four rectus EOM (LR, MR, inferior rectus muscle [IR] and the superior rectus and levator palpebrae muscle complex [SR+LP]) were semi‐automatically 3D‐segmented on the water image, using a seed‐growing algorithm with a manually set threshold for each subject in ITK‐SNAP 22 (Figure 1) by one observer (KRK). After automatic segmentation, the regions of interest (ROIs) were manually corrected to remove blood vessels, regions of orbital fat and regions of other eye muscles. The superior rectus muscle (SR) was segmented together with the levator palpebrae muscle (LP) as one complex, as their proximity hindered accurate separation in some cases. The segmentation was eroded with one acquisition voxel to account for partial volume effects in the FF calculation. To assess the segmentation reproducibility, an independent physician (NMvdV) repeated the segmentation process for the muscles of the right eye of all subjects. The average FFs of the EOM were determined using an inhouse‐developed Matlab script (Matlab 2016a; Mathworks, Natick, MA, USA) by averaging the voxels in the ROIs after exclusion of the eroded voxels and correction of the water‐fat‐shift between the fat and water image. The EOM volumes were determined by multiplying the number of voxels in the uneroded ROI with the voxel volume.
FIGURE 1.
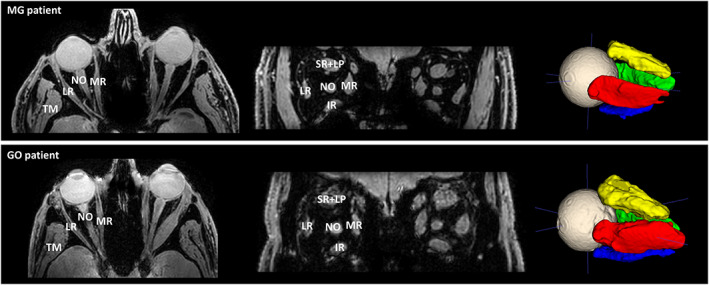
Transverse slice and a coronal slice of the Dixon water image (left) depicting a myasthenia gravis (MG) patient (top) and Graves' orbitopathy (GO) patient (bottom), showing the lateral rectus muscle (LR), the medial rectus muscle (MR), the inferior rectus muscle (IR) and the superior rectus and levator palpebrae muscle complex (SR+LP). The temporalis muscle (TM) and the optic nerve (NO) are also labeled in the figures. On the right, the 3D ROIs are shown after automatic segmentation using ITK‐SNAP. Notice the enlarged extra‐ocular muscles in the GO patient
The MSE scans were analyzed using a two‐component extended phase graphs (EPG) model consisting of a water and a fat component, as previously described. 23 In this model the main scan parameters, such as FA and slice profile, were incorporated, and the same fixed T1 for the water and fat compartments was used as described above for T1 correction of the Dixon scans. The difference in water‐fat shift in the slice direction between the excitation and refocusing pulses, due to different slice selection gradients for both pulses, was also incorporated in the model. This is especially important at high field strengths, as the shift scales linearly with the magnetic field strength and is 1.2 mm for the performed MSE scan. A dictionary‐matching algorithm was used to obtain the T2 of the water component, the B1 map and FF for each voxel. 24 , 25 This dictionary was created using T2water values from 10 to 60 ms, T2fat values from 120 to 200 ms, FF values from 0% to 100% and B1 values from 50% to 140%. To obtain a T2fat value for the match, the T2fat is conventionally calibrated on the subcutaneous fat, assuming it consists only of fat tissue and has a similar T2 as the fat replacement in skeletal muscles. 26 However, in this work the T2fat was calibrated on the orbital fat, since subcutaneous fat was not present in the field of view. For the MSE scans, the EOM were segmented by drawing ROIs per slice using the FF map as an anatomical reference by one observer (KRK).
2.4. Statistics
The Bland–Altman bias and limits of agreement between the FFs of the two Dixon scans were calculated for all participants together, and separately for the healthy controls and MG patients. The FFs and muscle volumes from the segmentation performed by the two independent observers were compared using Bland–Altman analysis. Mean FF and muscle volumes were compared using MANOVA with post hoc tests with Bonferroni multiple‐testing correction on the patient average and on the individual muscles after averaging the EOM of the left and right eye per patient. Mean T2water values were compared using a two‐tailed t‐test between healthy controls and MG patients, but not for the GO patient, since only one observation was present. The correlation between age and FF was tested using Pearson correlations for all three groups separately. The correlation between FF and volume was tested for healthy controls for all EOM. Significance level for all tests was set at .05.
3. RESULTS
3.1. Subject characteristics
Twelve healthy subjects (aged 41.0 ± 15.9 years, 42% male), eleven MG patients (aged 52.5 ± 15.9 years, 64% male) and six GO patients with active disease (aged 47.7 ± 14.0 years, 50% male, clinical activity score 27 ≥3) were included in this pilot study (Table 1).
TABLE 1.
Baseline characteristics of the three groups
| Healthy control (n = 12) | Myasthenia gravis (n = 11) | Graves' orbitopathy (n = 6) | |
|---|---|---|---|
| Age, years | 41.0 ± 15.9 | 52.5 ± 15.9 | 46.7 ± 14.0 |
| Gender | |||
| Male | 5 (42%) | 7 (64%) | 3 (50%) |
| Female | 7 (58%) | 4 (36%) | 3 (50%) |
| Disease onset | |||
| <3 months | ‐ | 5 (45%) | 3 (50%) |
| >1 year | ‐ | 6 (55%) | 3 (50%) |
| Medication | |||
| Pyridostigmine | ‐ | 10 (91%) | ‐ |
| Prednisone | ‐ | 6 (55%) | 2 (33%) |
| Other immunosuppressants | ‐ | 1 (9%) | ‐ |
| MG phenotype | |||
| Ocular | ‐ | 7 (64%) | ‐ |
| Generalized | ‐ | 4 (36%) | ‐ |
| Anti‐TSH‐R antibodies | ‐ | ‐ | 6 (100%) |
| Anti‐AChR antibodies | ‐ | 10 (91%) | ‐ |
3.2. Data quality
All scans, except for one Dixon scan with higher resolution in the coronal plane from an MG patient, were free from visible motion artefacts. This scan was excluded from the analysis. Reconstructed water, FF and T2water maps and the first and last echo of the MSE scan are shown in Figure 2.
FIGURE 2.
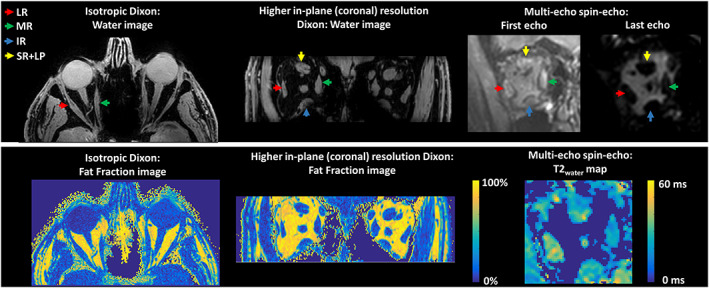
Examples of water images and fat fraction maps of the isotopic Dixon scan and the Dixon scan with a higher resolution in the coronal plane on the left. On the right, the first echo, the last echo and the T2water map are shown for the multi‐echo spin‐echo scan. The colored arrows point out the lateral rectus muscle (LR; red), the medial rectus muscle (MR; green), the inferior rectus muscle (IR; blue) and the superior rectus and levator palpebrae muscle complex (SR+LP; yellow)
3.3. Agreement on semi‐automatic segmentation
The EOM were semi‐automatically segmented by two independent observers separately. Figure 3 shows Bland–Altman plots depicting the bias and limits of agreement between the two independent observers for FF (A) and volume (B). The mean bias and limits of agreement in FFs and volume were −0.3% ([95% CI]: −3.1%; 2.6%) and 0.03 cm3 ([95% CI]: −0.33 cm3; 0.39 cm3), respectively.
FIGURE 3.

Bland–Altman plots depicting the agreement between two independent observers who separately semi‐automatically segmented the extra‐ocular muscles of the right orbits. The four extra‐ocular muscles are shown in separate colors: the lateral rectus (LR) muscle, the medial rectus muscle (MR), the inferior rectus muscle (IR) and the superior rectus and levator palpebrae muscle complex (SR+LP). Groups are shown in different shapes: Graves' ophthalmopathy (GO) patients, myasthenia gravis (MG) patients and healthy controls (HC). A shows the agreement in muscle volume (bias and limits of agreement: 0.03 cm3 ([95% CI]: −0.33 cm3; 0.39 cm3)). B shows the agreement in fat fractions (FF) (bias and limits of agreement: −0.3% ([95% CI]: −3.1%; 2.6%)). C shows the agreement between the isotropic Dixon scan and the scan with a higher resolution in the coronal plane (bias and limits of agreement: −0.7% ([95% CI]: −3.4%; 1.8%))
3.4. Reproducibility of FF measurement by Dixon scans
In one patient the second Dixon scan was excluded from the analysis due to severe motion artefacts. On visual inspection, the isotropic Dixon scan was of a higher quality compared with the Dixon scan with a higher resolution in the coronal plane. The gain of resolution in the coronal plane was accompanied by a loss of resolution in the transversal plane to maintain sufficient SNR and therefore unwanted partial volume effects were present. The Bland–Altman bias and limits of agreement between the two Dixon scans were −0.7% ([95% CI]: −3.4%; 1.8%) for all participants, with the Dixon scan with a higher resolution in the coronal plane giving, on average, lower FFs. In the MG patient group the bias and limits of agreement were −1.0% ([95% CI]: −3.7%; 1.7%), and in healthy controls the level of agreement was −0.4% ([95% CI]: −2.6%; 1.7%) (Figure 3C).
3.5. Muscle volume
The mean muscle volumes of the four recti muscles were higher in GO patients (1.2 ± 0.4 cm3) than in healthy controls (0.6 ± 0.2 cm3; P < .001) (Figure 4). The mean EOM volume was also higher in MG patients (0.8 ± 0.2 cm3) than in healthy controls (P = .007). Assessing all four muscles separately, the volumes of all four rectus EOM differed significantly between GO patients and healthy controls (LR: P = .033; MR: P = .001; IR: P < .001; and SR+LP: P = .001). No significant differences were observed comparing individual EOM between healthy controls and MG patients. A difference between GO and MG patients was present in the MR (P = .035) and the IR (P = .001) (Figure 5).
FIGURE 4.
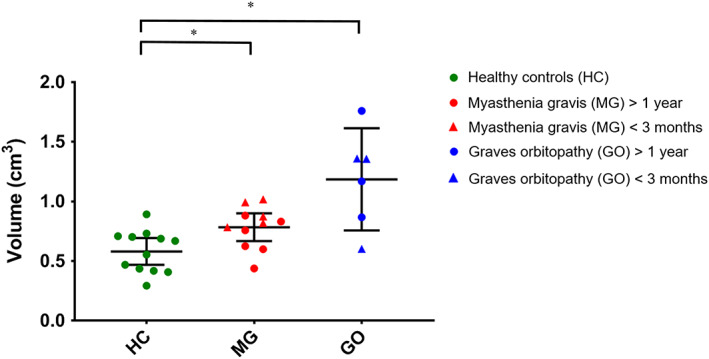
Mean muscle volumes of the four recti muscles per subject. Data are shown as mean and standard deviation for healthy controls (HC; green), myasthenia gravis (MG) (red) and Graves' orbitopathy (GO) patients (blue). The mean volume was 0.6 ± 0.2 cm3 in HC, 0.8 ± 0.2 cm3 in MG patients and 1.2 ± 0.4 cm3 in GO patients. The MG and GO patients had significantly higher muscle volume compared with muscle controls (P = .007 and P < .001, respectively). Statistical significance is indicated by asterisks
FIGURE 5.
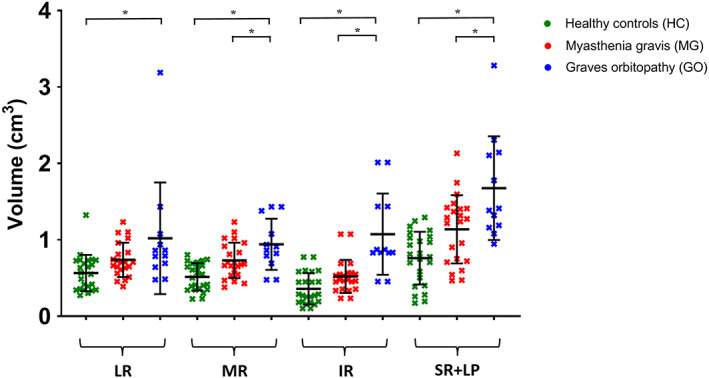
Muscle volumes for individual extra‐ocular muscles of both eyes are shown as mean and standard deviation for healthy controls (HC; green), myasthenia gravis (MG; red) and Graves' orbitopathy (GO; blue) patients. All four rectus EOM differed significantly between GO patients and HC (lateral rectus muscle [LR]: P = .033, medial rectus muscle [MR]: P = .001, inferior rectus muscle [IR]: P < .001 and superior rectus and levator palpebrae muscle complex [SR+ LP]: P = .001, left and right averaged). The difference between GO and MG patients was present in the MR (P = .035) and the IR (P = .001). Statistical significance is indicated by asterisks
3.6. FFs
The mean FFs of the EOM were higher in MG patients (14.1% ± 1.6%) compared with those of healthy controls (10.4% ± 2.5%; P = .008) (Figure 6) and similar between MG and GO patients (13.9% ± 4.4%). The variability in FFs appeared higher in GO patients than in MG patients and healthy controls. When analyzed individually, all four rectus EOM differed between MG patients and healthy controls (LR: P = .011; MR: P = .048; IR: P < .033; and SR+LP: P = .003). A difference between healthy controls and GO patients was observed in the LR (P = .029) and the SR+LP (P = .003) (Figure 7). For each group, Pearson correlations did not indicate a relationship between FF and age (r = 0.006 and P = .86 for healthy controls; r = −0.21 and P = .69 for GO patients; and r = 0.31 and P = .38 for MG patients). No dependence of FF on volume was observed in healthy controls (slope: −2.1%/cm3 [95% CI: −4.3 to 0.1], r = 0.19 and P = .06).
FIGURE 6.
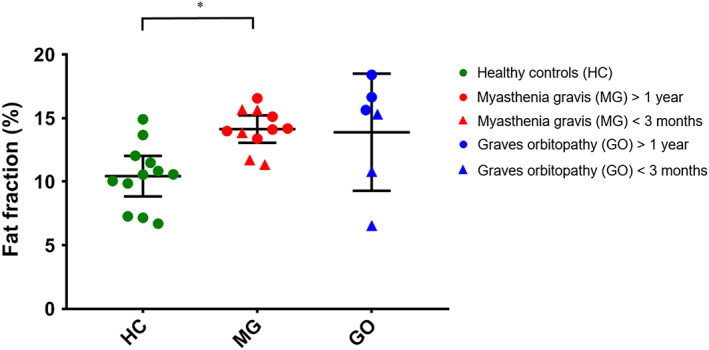
Mean muscle fat fractions of the four recti muscles per subject, divided per group. Data are shown as mean and standard deviation for healthy controls (HC; green), myasthenia gravis (MG; red) and Graves' orbitopathy (GO; blue) patients. The mean fat fraction was 10.4% ± 2.5% in HC, 14.1% ± 1.6% in MG patients and 13.9% ± 4.4% in GO patients. MG patients had a significantly higher fat fraction compared with controls (P = .008). Notable is the high variability between muscles in the GO patient group. Statistical significance is indicated by asterisks
FIGURE 7.
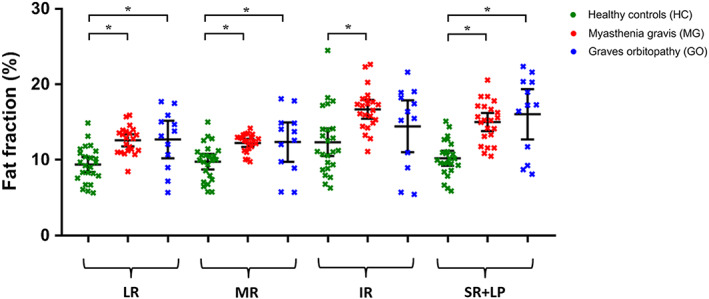
Fat fractions of individual extra‐ocular muscle of both eyes are shown as mean and standard deviation for healthy controls (HC; green), myasthenia gravis (MG; red) and Graves' orbitopathy (GO; blue) patients. All four rectus EOM differed significantly between MG patients and HC (lateral rectus muscle [LR]: P = .011, medial rectus muscle [MR]: P = .048, inferior rectus muscle [IR]: P < .033 and superior rectus and levator palpebrae muscle complex [SR+LP]: P = .003, left and right averaged). The difference between HC and GO patients was present in the lateral rectus muscle (LR; P = .029) and the superior rectus muscle (SR; P = .003). Statistical significance is indicated by asterisks
3.7. Water T2
The average T2water for all EOM was 24.6 ± 4.0 ms for healthy controls, 24.0 ± 4.7 ms for MG patients and 27.4 ± 4.2 ms for the GO patient. No significant differences between healthy controls and MG patients were found. T2water values for individual EOM are depicted in Figure 8.
FIGURE 8.
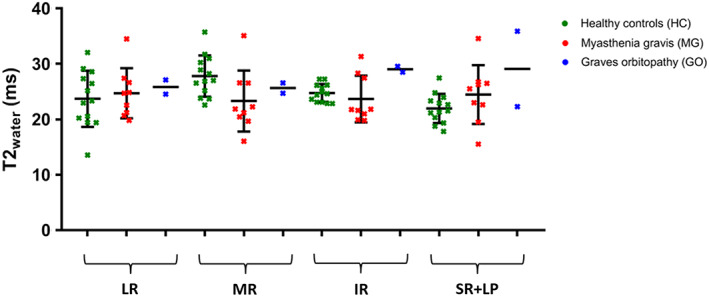
T2water values of individual extra‐ocular muscle of both eyes are shown as mean and standard deviation for healthy controls (HC; green), myasthenia gravis (MG; red) and Graves' orbitopathy (GO; blue) patients. For one HC and one MG patient, only the EOM from one eye is included. The average T2water for all EOM was 24.6 ± 4.0 ms for the HC, 24.0 ± 4.7 ms for the MG patients and 27.4 ± 4.1 ms for the GO patient
4. DISCUSSION
The current study aimed to study the feasibility of quantitative MRI of EOM in diseases that affect the eye muscles. We showed that the EOM could be reproducibly segmented semi‐automatically with a small inter‐observer variation and that FFs could be reproducibly measured in healthy controls and MG and GO patients between different scans. Thus we were able to detect small differences in muscle volume and FF between healthy controls and two patient cohorts, as well as T2water values similar to spectroscopy‐measured values in skeletal muscles, although small differences cannot be excluded as the study was not powered to detect them.
All scans except one were free from visible motion artefacts, indicating that all subjects could adhere to the protocol. The mean bias in FF between the segmentations of two independent observers was low (0.3%) and the limits of agreement were within ±3% in FF, which is in the same range as previously reported values in segmentation of the vastus lateralis in patients with Duchenne muscular dystrophy (bias: 0.1%, limits of agreement: ±1.1%), 28 in healthy controls and patients with type 2 diabetes in all leg muscle compartments (bias: −0.2, limits of agreement: ±2.6%), 29 and in patients with myotonic dystrophy type 1 in lower leg muscles (limits of agreement: ±2.5%). 30 The scan‐to‐scan reproducibility between the two Dixon scans with different resolutions showed a low average bias in FF (−0.7%) and narrow limits of agreement (−3.4% to 1.8%), which is lower than the difference found between the patients and the healthy controls (ie, ~4%), indicating the feasibility of assessing FFs using this method to detect affected muscles. For comparison, Dixon measurements in skeletal muscles have been reported to have a reproducibility (limits of agreements) of ±1% for water‐fat phantoms, 31 ±1.1% for thigh muscles in healthy controls 32 and ±2.5% for the leg muscles in patients with Duchenne muscular dystrophy. 33 These techniques could be used in future longitudinal studies to study the disease progression in conditions affecting the EOM and to relate time‐varying clinical observations such as painful eyes to the current condition of the EOM in terms of fat replacement and inflammation.
We found FFs of ~10% in the EOM, which is higher than the 2%‐5% commonly observed in skeletal muscles of healthy volunteers. 32 , 34 , 35 Although the high FF could be an intrinsic property of EOM, it could also be the result of noise bias. Earlier studies in skeletal muscles have shown that low SNR could result in an overestimation of the FF in the low FF ranges. 36 Although the strong contrast between the orbital fat and the muscles and globe suggests more than sufficient SNR for anatomical evaluation of the images, some noise can be observed in the temporalis muscle (TM), a large skeletal muscle close to the orbit. In a representative healthy subject, this TM also showed a relatively high FF of 9.3% (data not shown). A Dixon reconstruction of 4‐fold downsampled source images of the same subject, which increased the SNR 2‐fold, resulted in a reduction in FF from 9.3% to 5.1%, showing that the protocol used is susceptible to noise bias in the low FF ranges. This could explain the relatively high FF observed in the EOM. Therefore, we recommend that future studies use a higher SNR for the Dixon acquisition, for example, by using a higher FA or a two FA approach. 36 Additionally, the overestimation of the FF could have been caused by partial volume effects of the EOM with the surrounding orbital fat, due to the small size of these muscles (~1cm3).
Muscle volumes were measured using 3D segmentation on the water image from the Dixon scans. The limits of agreement for the muscle volumes segmented by the two independent observers ranged between −0.33 and 0.39 cm3. These limits do not reach the 0.6 cm3 difference observed between GO patients and healthy controls, but are higher than the difference of 0.2 cm3 observed between the MG patients and healthy controls. On visual inspection (Figure 3), the highest differences between observers were found in the SR+LP, which is the hardest to delineate because the complex contains two separate muscles. An overall dependence of volume difference between observers on mean volume was observed (Figure 3A), but there was virtually no mean bias (0.03 cm3). Moreover, as no dependence of FF on the volume was present in healthy controls, the segmentation was not likely to have influenced the observed FF differences between groups.
Using MSE and EPG analysis, we found T2 values of the myocytic compartment (T2water) for EOM to be comparable with the T2water in healthy skeletal muscle, as measured with MR spectroscopy. 37 , 38 , 39 The standard deviation of T2water between the EOM (4.0, 4.7 and 4.2 ms for healthy controls, MG patients and GO patients, respectively) was higher than previously measured using an EPG model in leg muscles between subjects (1.4‐2.1 ms). 24 , 34 This variation between T2water of muscles was expected as different patients have different patterns of muscle involvement. For example, in GO the IR is usually affected earlier in the disease, followed later by the other EOM. 14 In the healthy controls, however, a smaller variation, comparable with other skeletal muscles, was expected. Two assumptions in the analysis may have contributed to this higher variation. Firstly, the calibration of the T2fat was performed on the orbital fat, under the assumption that its composition is similar to intra‐muscular fat. 40 Orbital fat is, however, known to be involved in inflammatory conditions, such as GO. 41 This variation in orbital fat T2, which is not necessarily also present in the T2 of intra‐muscular fat, might result in an erroneous variation in intra‐muscular T2fat. Secondly, our model assumes that the ROI to calibrate the T2fat only contains orbital fat. However, in reality there is vascularization in the orbital fat that will result in a small, patient‐specific inaccuracy in the measured orbital T2fat, which will subsequently influence the obtained T2water. A high variation between individual EOM in patients is to be expected, as MG and GO are known to selectively affect specific EOM. 42 , 43 Due to the high variation, the power was limited to detect mean differences in T2water between groups. For future studies, we recommend establishing baseline values per EOM and using Z‐scores to detect EOM with an abnormal T2water.
Although the patient cohorts were small in size, clear differences were found between them. The measured FFs of the EOM were higher in MG and GO patients compared with healthy controls and muscle volumes were higher in GO patients. Edematous EOM are a common finding in GO patients 11 and fat replacement of EOM has been described in late‐stage GO patients. 8 The variability in muscle volume was high in GO patients, possibly due to the inclusion of patients with varying disease severity and the inflammation of only a portion of the EOM in individual patients.
The increase in FF in the EOM in MG has been described in histological studies, 16 but the increase in muscle volume in the EOM of MG patients was unexpected. In MG, AChR or MuSK, antibodies can result in structural damage of the muscle membrane at the neuromuscular synapse, which is usually located at the middle of the muscle fiber, but this is not a dystrophic process. 5 In dystrophic muscle diseases fat replacement of muscle tissue is commonly observed, and can almost completely replace normal muscle tissue. 44 , 45 In neuropathic diseases, like hereditary motor and sensory neuropathy (HMSN) or hereditary neuropathy with liability to pressure palsies, FFs of up to 15% have been observed in calf muscle, 46 which represents a relatively small increase (of up to 10%) in FF, and is comparable with the increase in FF (of up to 8%) that we observed in the EOM in MG. In a recent case report, histological findings in a seronegative MG patient also included adipocyte replacement of muscle fiber, 47 and fat replacement has been seen in the bulbar muscles of MuSK‐positive MG patients. 48 Our results agree with these observations and indicate that involvement of EOM in MG patients is accompanied by fat replacement. Interestingly, our results to date suggest that the FFs of MG patients with a disease onset of less than 3 months before the scan did not appear to differ from those of chronic MG patients.
Severe MG can induce chronic denervation and therefore might behave as a neuropathic condition. Muscular atrophy in skeletal muscle is observed in 10% of AChR‐positive MG patients with longstanding disease. 49 In MuSK‐positive MG patients, early atrophy is seen in the bulbar muscles. 48 , 50 , 51 In other neurogenic muscle diseases, like HMSN, a decrease in muscle volume has also been observed. 46 However, in this work we observed an increase in EOM volume in MG patients, which is not consistent with the expected atrophy. This unexpected increase in muscle volume raises questions about its pathophysiology. Firstly, it is possible that inflammatory processes in the EOM result in swollen muscles. In MG, complement activation is observed, resulting in activation of the membrane attack complex and destruction of the neuromuscular endplate. 52 To what extent this inflammatory process affects the EOM is unknown. Secondly, (pseudo)hypertrophy may provide an explanation of the increase in EOM volume that has been observed in some muscular dystrophies. 53
A limitation of this work was that the groups in this pilot study were not fully age‐matched, as the maximum age of healthy volunteers was limited to 65 years, based on the inclusion criteria of our institutional review board approval. This upper age limit did not apply to both patient groups. However, an earlier study showed that the EOM do not change in muscle thickness, size and fatty tissue volume between age groups. 54 In addition, when analyzing all three groups in this study separately, we did not see any effects of age on EOM FFs. Therefore, age does not appear to be a major confounder in our study. Secondly, due to the exploratory nature of this pilot study with ongoing sequence development, not all sequences were applied to all patients. Consequently, the second Dixon scan for reproducibility and the MSE sequence were only performed in a subgroup of patients, and T2 relaxometry was only applied to one GO patient. Finally, this study was performed on a 7 T MR scanner to increase the SNR at the high resolution required for imaging the EOM. 18 However, the disadvantages of scanning at 7 T are the increase in susceptibility differences, B0 inhomogeneities and chemical shift artefacts. These challenges were successfully solved using higher order shimming and the in‐plane chemical shift displacement was set at 1.0 acquisition pixels and corrected for during postprocessing. Future studies can determine if the same results can be achieved at clinical field strengths such as 3 T.
In conclusion, despite the challenges of size and movement, quantitative MRI is feasible for measuring FFs and muscle volumes of individual EOM in healthy controls, MG and GO patients at 7 T. We recorded water T2 relaxation times that were comparable with values measured in skeletal muscle, but found high variability between individuals and between different EOM. Detection of group differences for this parameter will therefore only be possible when large differences between groups are present, only affected EOM are included in the analyses, or when using large sample sizes. We found an increase in EOM volume and FF in MG and GO patients. The unexpected increase in EOM volume in MG may provide novel insights into underlying pathophysiological processes. The diagnostic value of these findings and their value when following up disease progression should be the subject of future prospective studies.
ACKNOWLEDGEMENTS
The authors are members of the European Reference Network for Rare Neuromuscular Diseases.
Keene KR, van Vught L, van de Velde NM, et al. The feasibility of quantitative MRI of extra‐ocular muscles in myasthenia gravis and Graves' orbitopathy. NMR in Biomedicine. 2021;34:e4407 10.1002/nbm.4407
DATA AVAILABILITY STATEMENT
The used Matlab scripts and one sample dataset presented in this article will be made available at the request of a qualified investigator. Requests should be made to K. R. Keene (k.r.keene@lumc.nl).
REFERENCES
- 1. Grob D, Brunner N, Namba T, Pagala M. Lifetime course of myasthenia gravis. Muscle Nerve. 2008;37(2):141‐149. [DOI] [PubMed] [Google Scholar]
- 2. Beekman R, Kuks JBM, Oosterhuis HJGH. Myasthenia gravis: Diagnosis and follow‐up of 100 consecutive patients. J Neurol. 1997;244(2):112‐118. [DOI] [PubMed] [Google Scholar]
- 3. Gilhus NE, Verschuuren JJ. Myasthenia gravis: Subgroup classification and therapeutic strategies. Lancet Neurol. 2015;14(10):1023‐1036. [DOI] [PubMed] [Google Scholar]
- 4. Benatar M. A systematic review of diagnostic studies in myasthenia gravis. Neuromuscul Disord. 2006;16(7):459‐467. [DOI] [PubMed] [Google Scholar]
- 5. Gilhus NE, Tzartos S, Evoli A, Palace J, Burns TM, Verschuuren JJGM. Myasthenia gravis. Nat Rev Dis Primers. 2019;5(1):30. [DOI] [PubMed] [Google Scholar]
- 6. Mazzoli M, Ariatti A, Valzania F, et al. Factors affecting outcome in ocular myasthenia gravis. Int J Neurosci. 2018;128(1):15‐24. [DOI] [PubMed] [Google Scholar]
- 7. Mantegazza R, Antozzi C. When myasthenia gravis is deemed refractory: clinical signposts and treatment strategies. Ther Adv Neurol Diso. 2018;11:1756285617749134. [DOI] [PMC free article] [PubMed] [Google Scholar]
- 8. Parmar H, Ibrahim M. Extrathyroidal manifestations of thyroid disease: thyroid ophthalmopathy. Neuroimaging Clin N Am. 2008;18(3):527‐536. [DOI] [PubMed] [Google Scholar]
- 9. Smith TJ. TSHR as a therapeutic target in Graves' disease. Expert Opin Ther Targets. 2017;21(4):427‐432. [DOI] [PMC free article] [PubMed] [Google Scholar]
- 10. Bahn RS. Graves' ophthalmopathy. N Engl J Med. 2010;362(8):726‐738. [DOI] [PMC free article] [PubMed] [Google Scholar]
- 11. Nagy EV, Toth J, Kaldi I, et al. Graves' ophthalmopathy: Eye muscle involvement in patients with diplopia. Eur J Endocrinol. 2000;142(6):591‐597. [DOI] [PubMed] [Google Scholar]
- 12. Melcescu E, Horton WB, Kim D, et al. Graves orbitopathy: update on diagnosis and therapy. South Med J. 2014;107(1):34‐43. [DOI] [PubMed] [Google Scholar]
- 13. Strijkers GJ, Araujo ECA, Azzabou N, et al. Exploration of new contrasts, targets, and MR imaging and spectroscopy techniques for neuromuscular disease‐A workshop report of working group 3 of the biomedicine and molecular biosciences COST action BM1304 MYO‐MRI. J Neuromuscul Dis. 2019;6(1):1‐30. [DOI] [PMC free article] [PubMed] [Google Scholar]
- 14. Ferreira TA, Saraiva P, Genders SW, Buchem MV, Luyten GPM, Beenakker JW. CT and MR imaging of orbital inflammation. Neuroradiology. 2018;60(12):1253‐1266. [DOI] [PMC free article] [PubMed] [Google Scholar]
- 15. De Abreu MR, Chung CB, Biswal S, Haghighi P, Hesselink J, Resnick D. Erdheim‐Chester disease: MR imaging, anatomic, and histopathologic correlation of orbital involvement. Am J Neuroradiol. 2004;25(4):627‐630. [PMC free article] [PubMed] [Google Scholar]
- 16. Europa TA, Nel M, Heckmann JM. A review of the histopathological findings in myasthenia gravis: Clues to the pathogenesis of treatment‐resistance in extraocular muscles. Neuromuscul Disord. 2019;29(5):381‐387. [DOI] [PubMed] [Google Scholar]
- 17. Das T, Roos JCP, Patterson AJ, Graves MJ, Murthy R. T2‐relaxation mapping and fat fraction assessment to objectively quantify clinical activity in thyroid eye disease: an initial feasibility study. Eye. 2019;33(2):235‐243. [DOI] [PMC free article] [PubMed] [Google Scholar]
- 18. Lindner T, Langner S, Graessl A, et al. High spatial resolution invivo magnetic resonance imaging of the human eye, orbit, nervus opticus and optic nerve sheath at 7.0 Tesla. Exp Eye Res. 2014;125:89‐94. [DOI] [PubMed] [Google Scholar]
- 19. Beenakker JWM, van Rijn GA, Luyten GPM, Webb AG. High‐resolution MRI of uveal melanoma using a microcoil phased array at 7 T. NMR Biomed. 2013;26(12):1864‐1869. [DOI] [PubMed] [Google Scholar]
- 20. Carlier PG. Global T2 versus water T2 in NMR imaging of fatty infiltrated muscles: Different methodology, different information and different implications. Neuromuscul Disord. 2014;24(5):390‐392. [DOI] [PubMed] [Google Scholar]
- 21. Han E, Gold G, Stainsby J, Beaulieu J, Brittain J. In‐vivo T1 and T2 measurements of muskoloskeletal tissue at 3T and 1.5T. Proc Intl Soc Mag Reson Med. 2003;166:450. [Google Scholar]
- 22. Yushkevich PA, Piven J, Hazlett HC, et al. User‐guided 3D active contour segmentation of anatomical structures: Significantly improved efficiency and reliability. Neuroimage. 2006;31(3):1116‐1128. [DOI] [PubMed] [Google Scholar]
- 23. Keene KR, Beenakker JWM, Hooijmans MT, et al. T2 relaxation time mapping in healthy and diseased skeletal muscle using extended phase graph algorithms. Magn Reson Med. 2020;84(5):2656‐2670. [DOI] [PMC free article] [PubMed] [Google Scholar]
- 24. Marty B, Baudin PY, Reyngoudt H, et al. Simultaneous muscle water T2 and fat fraction mapping using transverse relaxometry with stimulated echo compensation. NMR Biomed. 2016;29(4):431‐443. [DOI] [PubMed] [Google Scholar]
- 25. Weigel M. Extended phase graphs: dephasing, RF pulses, and echoes ‐ pure and simple. J Magn Reson Imaging. 2015;41(2):266‐295. [DOI] [PubMed] [Google Scholar]
- 26. Azzabou N, De Sousa PL, Caldas E, Carlier PG. Validation of a generic approach to muscle water T2 determination at 3T in fat‐infiltrated skeletal muscle. J Magn Reson Imaging. 2015;41(3):645‐653. [DOI] [PubMed] [Google Scholar]
- 27. Mourits MP, Prummel MF, Wiersinga WM, Koornneef L. Clinical activity score as a guide in the management of patients with Graves' ophthalmopathy. Clin Endocrinol. 1997;47(1):9‐14. [DOI] [PubMed] [Google Scholar]
- 28. Naarding KJ, Reyngoudt H, van Zwet EW, et al. MRI vastus lateralis fat fraction predicts loss of ambulation in Duchenne muscular dystrophy. Neurology. 2020;94(13):e1386‐e1394. [DOI] [PMC free article] [PubMed] [Google Scholar]
- 29. Kiefer LS, Fabian J, Lorbeer R, et al. Inter‐ and intra‐observer variability of an anatomical landmark‐based, manual segmentation method by MRI for the assessment of skeletal muscle fat content and area in subjects from the general population. Br J Radiol. 2018;91(1089):20180019. [DOI] [PMC free article] [PubMed] [Google Scholar]
- 30. Hiba B, Richard N, Hébert LJ, et al. Quantitative assessment of skeletal muscle degeneration in patients with myotonic dystrophy type 1 using MRI. J Magn Reson Imaging. 2012;35(3):678‐685. [DOI] [PubMed] [Google Scholar]
- 31. Hernando D, Sharma SD, Aliyari Ghasabeh M, et al. Multisite, multivendor validation of the accuracy and reproducibility of proton‐density fat‐fraction quantification at 1.5T and 3T using a fat–water phantom. Magn Reson Med. 2017;77(4):1516‐1524. [DOI] [PMC free article] [PubMed] [Google Scholar]
- 32. Morrow JM, Sinclair CDJ, Fischmann A, et al. Reproducibility, and age, body‐weight and gender dependency of candidate skeletal muscle MRI outcome measures in healthy volunteers. Eur Radiol. 2014;24(7):1610‐1620. [DOI] [PMC free article] [PubMed] [Google Scholar]
- 33. Forbes SC, Walter GA, Rooney WD, et al. Skeletal muscles of ambulant children with Duchenne muscular dystrophy: validation of multicenter study of evaluation with MR imaging and MR spectroscopy. Radiology. 2013;269(1):198‐207. [DOI] [PMC free article] [PubMed] [Google Scholar]
- 34. Schlaffke L, Rehmann R, Rohm M, et al. Multi‐center evaluation of stability and reproducibility of quantitative MRI measures in healthy calf muscles. NMR Biomed. 2019;32(9):e4119. [DOI] [PubMed] [Google Scholar]
- 35. Hu HH, Kan HE. Quantitative proton MR techniques for measuring fat. NMR Biomed. 2013;26(12):1609‐1629. [DOI] [PMC free article] [PubMed] [Google Scholar]
- 36. Liu CY, McKenzie CA, Yu H, Brittain JH, Reeder SB. Fat quantification with IDEAL gradient echo imaging: Correction of bias from T1 and noise. Magn Reson Med. 2007;58(2):354‐364. [DOI] [PubMed] [Google Scholar]
- 37. Schlaeger S, Weidlich D, Klupp E, et al. Decreased water T2 in fatty infiltrated skeletal muscles of patients with neuromuscular diseases. NMR Biomed. 2019;32(8):e4111. [DOI] [PubMed] [Google Scholar]
- 38. Forbes SC, Arora H, Willcocks RJ, et al. Upper and lower extremities in Duchenne muscular dystrophy evaluated with quantitative MRI and proton MR spectroscopy in a multicenter cohort. Radiology. 2020;295(3):616‐625, 192210. [DOI] [PMC free article] [PubMed] [Google Scholar]
- 39. Carlier PG, Marty B, Scheidegger O, et al. Skeletal muscle quantitative nuclear magnetic resonance imaging and spectroscopy as an outcome measure for clinical trials. J Neuromuscul Dis. 2016;3(1):1‐28. [DOI] [PMC free article] [PubMed] [Google Scholar]
- 40. Ren J, Dimitrov I, Sherry AD, Malloy CR. Composition of adipose tissue and marrow fat in humans by 1H NMR at 7 Tesla. J Lipid Res. 2008;49(9):2055‐2062. [DOI] [PMC free article] [PubMed] [Google Scholar]
- 41. Higashiyama T, Iwasa M, Ohji M. Quantitative analysis of inflammation in orbital fat of thyroid‐associated ophthalmopathy using MRI signal intensity. Sci Rep. 2017;7(1):16874. [DOI] [PMC free article] [PubMed] [Google Scholar]
- 42. Nair AG, Patil‐Chhablani P, Venkatramani DV, Gandhi RA. Ocular myasthenia gravis: A review. Indian J Ophthalmol. 2014;62(10):985‐991. [DOI] [PMC free article] [PubMed] [Google Scholar]
- 43. Garau LM, Guerrieri D, De Cristofaro F, Bruscolini A, Panzironi G. Extraocular muscle sampled volume in Graves' orbitopathy using 3‐T fast spin‐echo MRI with iterative decomposition of water and fat sequences. Acta Radiol Open. 2018;7(6):2058460118780892. [DOI] [PMC free article] [PubMed] [Google Scholar]
- 44. Burakiewicz J, Sinclair CDJ, Fischer D, Walter GA, Kan HE, Hollingsworth KG. Quantifying fat replacement of muscle by quantitative MRI in muscular dystrophy. J Neurol. 2017;264(10):2053‐2067. [DOI] [PMC free article] [PubMed] [Google Scholar]
- 45. Cros D, Harnden P, Pellissier JF, Serratrice G. Muscle hypertrophy in Duchenne muscular dystrophy ‐ A pathological and morphometric study. J Neurol. 1989;236(1):43‐47. [DOI] [PubMed] [Google Scholar]
- 46. Morrow JM, Sinclair CDJ, Fischmann A, et al. MRI biomarker assessment of neuromuscular disease progression: A prospective observational cohort study. Lancet Neurol. 2016;15(1):65‐77. [DOI] [PMC free article] [PubMed] [Google Scholar]
- 47. Rautenbach RM, Pillay K, Murray ADN, Heckmann JM. Extraocular muscle findings in myasthenia gravis associated treatment‐resistant ophthalmoplegia. J Neuro‐Ophthalmology. 2017;37(4):414‐417. [DOI] [PubMed] [Google Scholar]
- 48. Farrugia ME, Robson MD, Clover L, et al. MRI and clinical studies of facial and bulbar muscle involvement in MuSK antibody‐associated myasthenia gravis. Brain. 2006;129(6):1481‐1492. [DOI] [PubMed] [Google Scholar]
- 49. Oosterhuis H, Bethlem J. Neurogenic muscle involvement in myasthenia gravis. A clinical and histopathological study. J Neurol Neurosurg Psychiatry. 1973;36(2):244‐254. [DOI] [PMC free article] [PubMed] [Google Scholar]
- 50. Moon SY, Lee SS, Hong YH. Muscle atrophy in muscle‐specific tyrosine kinase (MuSK)‐related myasthenia gravis. J Clin Neurosci. 2011;18(9):1274‐1275. [DOI] [PubMed] [Google Scholar]
- 51. Nikolić AV, Bačić GG, Daković M, et al. Myopathy, muscle atrophy and tongue lipid composition in MuSK myasthenia gravis. Acta Neurol Belg. 2015;115(3):361‐365. [DOI] [PubMed] [Google Scholar]
- 52. Paz ML, Barrantes FJ. Autoimmune attack of the neuromuscular junction in myasthenia gravis: nicotinic acetylcholine receptors and other targets. ACS Chem Nerosci. 2019;10(5):2186‐2194. [DOI] [PubMed] [Google Scholar]
- 53. Walters J. Muscle hypertrophy and pseudohypertrophy. Pract Neurol. 2017;17(5):369‐379. [DOI] [PubMed] [Google Scholar]
- 54. Tian S, Nishida Y, Isberg B, Lennerstrand G. MRI measurements of normal extraocular muscles and other orbital structures. Graefes Arch Clin Exp Ophthalmol. 2000;238(5):393‐404. [DOI] [PubMed] [Google Scholar]
Associated Data
This section collects any data citations, data availability statements, or supplementary materials included in this article.
Data Availability Statement
The used Matlab scripts and one sample dataset presented in this article will be made available at the request of a qualified investigator. Requests should be made to K. R. Keene (k.r.keene@lumc.nl).


