Abstract
Scope
The apical sodium‐dependent bile acid transporter (ASBT, SLC10A2) is important in the enterohepatic cycling of bile acids and thereby in the intestinal absorption of lipids. ASBT inhibition has been shown to improve aspects of the metabolic syndrome, but the underlying mechanisms have remained unclear. Here, the effect of ASBT inhibition on the uptake of specific fatty acids and its consequences for diet‐induced obesity and non‐alcoholic fatty liver disease (NAFLD) are investigated.
Methods
Intestinal fat absorption is determined in mice receiving an ASBT inhibitor and in Asbt−/− mice. Metabolic disease development is determined in Asbt−/− mice receiving a low‐fat control diet (LFD) or high‐fat diet (HFD) rich in saturated fatty acids (SFAs) or PUFAs.
Results
Both ASBT inhibition and Asbt gene inactivation reduce total fat absorption, particularly of SFAs. Asbt gene inactivation lowers bodyweight gain, improves insulin sensitivity, and decreases the NAFLD activity score upon feeding a HFD rich in SFAs, but not in PUFAs.
Conclusions
The beneficial metabolic effects of ASBT inactivation on diet‐induced obesity depend on decreased intestinal absorption of SFAs, and thus on the dietary fatty acid composition. These findings highlight the importance of dietary fatty acid composition in the therapeutic effects of ASBT inhibition.
Keywords: bile acid, enterohepatic circulation, fat absorption, obesity, steatosis
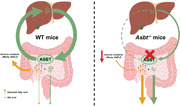
Inactivation of the apical sodium bile acid transporter (ASBT) results in interruption of the enterohepatic circulation of bile acids. Low intestinal concentrations of bile acids impair solubilization and subsequent absorption of lipids, protecting Asbt−/− mice from obesity, insulin resistance, and non‐alcoholic fatty liver (NAFLD) disease induced by a diet rich in saturated fatty acids compared to wildtype (WT) mice.
1. Introduction
Obesity is an important risk factor for the development of type 2 diabetes mellitus (T2DM) and non‐alcoholic fatty liver disease (NAFLD) also known as metabolic (dysfunction) associated fatty liver disease (MAFLD).[ 1 , 2 ] Recently, bile acids (BAs) and their receptors have emerged as important regulators of glucose and lipid metabolism and as potential targets for the treatment of obesity and related metabolic disorders.[ 3 , 4 ] BAs play an important role in the absorption and digestion of dietary lipids. This process starts in the stomach and intestinal lumen where triglycerides (TGs) are hydrolyzed by gastric and pancreatic lipases into glycerol, monoacylglycerols, and free fatty acids (FFAs). FFAs, cholesterol and fat‐soluble vitamins are solubilized as mixed micelles by BAs, a process that facilitates the transport of these hydrophobic compounds across the aqueous phase of the small intestinal lumen and the unstirred water layer overlying the intestinal epithelium, for subsequent translocation into the enterocyte.[ 5 ] BAs must be present above their critical micelle concentration (CMC) to promote efficient lipid absorption. Reported values for the CMCs vary for different BA species and depend on the analytic methods and conditions used.[ 6 ]
Under physiological conditions, BA homeostasis is tightly regulated by the BA‐activated nuclear receptor, farnesoid x receptor (FXR), in the liver and intestine. The enterohepatic circulation of BAs is highly efficient and results in intestinal reabsorption of ≈95% of BAs per cycle. Under intestinal bile‐deficient conditions, lipolysis of TGs continues but fat absorption is slower and less efficient, and consequently extended into more distal segments of the intestine.[ 7 ] The most important BA‐activated receptors involved in their metabolic effects are FXR and the G‐protein coupled BA receptor 1 (GPBAR1, synonyms GPCR19 or TGR5).[ 8 ] These receptors can be modulated directly via receptor (ant)agonism or indirectly via altering the enterohepatic circulation of BAs.
Interruption of the enterohepatic circulation of BAs by inhibition or genetic inactivation of the apical sodium‐dependent BA transporter (ASBT, SLC10A2) in mice decreased intestinal lipid absorption.[ 9 , 10 , 11 ] Micellar solubilization is most important for hydrophobic lipids such as cholesterol, fat‐soluble vitamins, and (long‐chain) saturated fatty acids (SFAs). Studies using cholestatic and bile‐deficient rat models showed more pronounced effects on absorption of long chain SFAs than on long chain PUFAs.[ 12 , 13 ] ASBT deficiency, however, not only decreases total BA concentrations, but also shifts the BA composition towards a more hydrophobic profile containing more cholic acid (CA) and less muri‐cholic acid (MCA).[ 9 , 11 , 14 ] Hydrophobic BAs have a lower CMC and are more efficient in micellar solubilization.[ 15 , 16 ] Therefore, it was hypothesized that the increase in biliary hydrophobicity relatively preserves lipid absorption in Asbt−/− mice.[ 9 ] However, we recently demonstrated that fractional cholesterol absorption is nearly abrogated (<5%) in Asbt−/− mice despite having more hydrophobic bile compared to control mice.[ 11 ]
In various in vivo models, ASBT inhibition improves obesity‐related disorders such as NAFLD and hyperglycemia.[ 10 , 14 , 17 , 18 , 19 , 20 ] The mechanism underlying these changes has remained unclear.[ 21 ] Conversely, two studies using an ASBT inhibitor treatment for non‐alcoholic steatohepatitis (NASH) did not show improvements in hepatic outcomes.[ 10 , 22 ] The intestinal specific ASBT inhibitor (ASBTi) SC‐435 reduced hepatic fat accumulation and improved glucose tolerance in mice on a Western type diet.[ 14 ] Recently, we showed that the beneficial effects of SC‐435 on NAFLD/NASH were attenuated when feeding a choline‐deficient amino acid defined (CDAA) diet.[ 10 ] Interestingly, the CDAA diet also abolished the effects of SC‐435 on fat absorption suggesting a potential relationship between the two effects. In the current study, we examined the effect of ASBT inhibition on the absorption of different fatty acids from the diet and the effect of genetic ASBT inactivation on high fat diet (HFD) induced obesity and NAFLD. Modulation of the dietary fatty acid composition in combination with genetic ASBT inactivation allowed us to assess the effects of specific fatty acid absorption on the development of metabolic disease.
2. Results
2.1. ASBT Inhibition Differentially Affects the Absorption of Fatty Acid Species
To determine the role of ASBT in the absorption of different fatty acids, we first examined the effect of the ASBTi. There were no differences in food intake, bodyweight, liver weight, or hepatic TG levels between the two groups (Table S2, Supporting Information). Total hepatic cholesterol content, however, was decreased by the ASBTi (Table S2, Supporting Information). Overall, intestinal fat absorption was reduced by about 8% with ASBTi treatment (Figure 1A, 92.4 vs 84.7%, p < 0.001). Absorption of MUFAs was reduced in ASBTi treated mice, by 1.8% for vaccenic acid (C18:1ω7) and by 4.0% for oleic acid (C18:1ω9) (Figure 1B). Absorption of the trans‐fatty acid (TFA), elaidic acid (C18:1t9), was reduced by 5.9% in the ASBTi‐treated mice (Figure 1B). ASBTi treatment did not affect the absorption of the PUFA linoleic acid (C18:2ω6) (Figure 1B, 97.6 vs 97.5%, p = 0.9). In contrast, the absorption of SFAs was more strongly reduced, by 6.5% for myristic acid (C14:0), by 14.8% for palmitic acid (C16:0), and by 19.3% for stearic acid (C18:0) (Figure 1C). In agreement with their higher BA‐dependency for absorption, the absorption of long chain SFAs was least efficient. This is illustrated in Figure 1D where the absorption of the major SFA species is plotted in relation to their reverse phase high‐performance liquid chromatography (HPLC) retention time, a reflection of hydrophobicity.[ 34 , 35 ] Even at similar HPLC retention times SFA absorption was more affected by ASBT inhibition than PUFA/MUFA absorption (Figure 1D–E). However, the pattern for fatty acid absorption follows that for previously published efficiency of micellar solubilization in the presence of BAs and is aside from fatty acid hydrophobicity also dependent on other factors such as the presence of phospholipids.[ 25 ]
Figure 1.
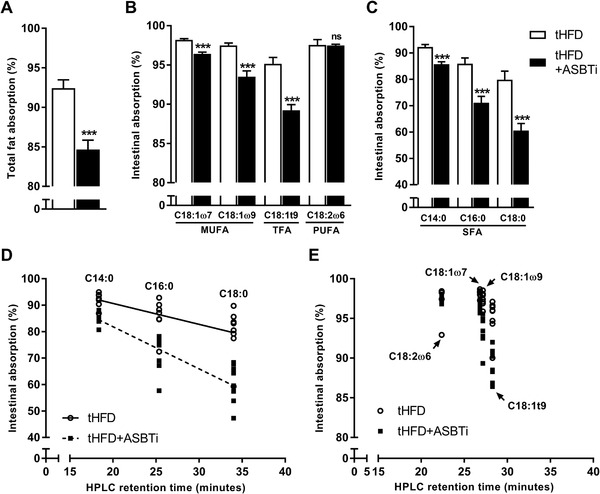
The effect of ASBT inhibition on intestinal absorption of fatty acids. A) Total fat absorption, B) fat absorption of the main dietary MUFA and PUFA species, and C) fat absorption of different SFA species in WT mice fed a tHFD with and without ASBT inhibitor (ASBTi); D) fat absorption of the three major SFA and E) four major MUFA/PUFA plotted against their reverse phase HPLC retention time for WT mice fed a tHFD with and without an ASBTi (n = 8). TFA, trans‐fatty acid; *p < 0.05, **p < 0.01, ***p < 0.001.
2.2. ASBT Deficiency Reduces Diet‐Induced Obesity and Metabolic Disease Development
To assess the consequences of ASBT deficiency on diet‐induced obesity we fed mice with Asbt−/− mice a HFD enriched in saturated fats (sHFD) and a matched low‐fat control diet (sLFD). Asbt−/− mice displayed less weight gain in response to sHFD as compared to WT littermates, resulting in a significantly lower body weight after 11 weeks of diet (Figure 2A,B, 36 vs 44 g, p = 0.001). In contrast, no significant difference in weight gain was observed for the sLFD between genotypes (Figure 2A).
Figure 2.
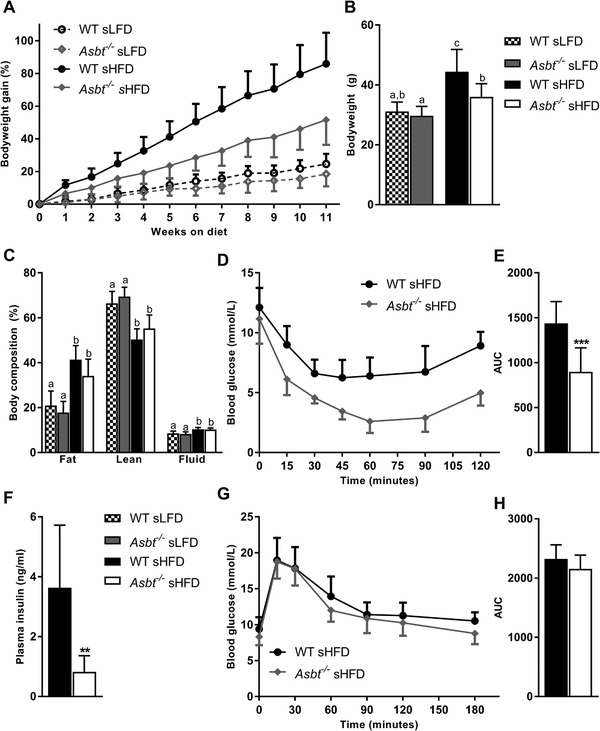
The effect of ASBT deficiency on diet‐induced obesity and related glucose homeostasis. A) Time course of bodyweight gain expressed as percentage of starting bodyweight, B) bodyweight at week 11 of WT and Asbt−/− mice on sLFD and sHFD, C) body composition after 12 weeks of sLFD and sHFD diet, D) intraperitoneal ITT and E) area under the curve (AUC), F) plasma insulin levels in WT and Asbt−/‐ mice fed a sHFD G) OGTT and H) AUC; n = 9 to 10. Different lowercase letters indicate statistically significant differences (p < 0.05) between four groups. Between two groups statistical difference is indicated as *p < 0.05, **p < 0.01, ***p < 0.001.
Caloric intake and energy expenditure were not different between WT and Asbt−/− mice on either diet (Figure S1A,B, Supporting Information). There was a trend toward a lower fat mass (Figure 2C, 34 vs 41%, p = 0.07) and a higher lean mass (Figure 2C, 56 vs 51%, pP = 0.16) in Asbt−/− mice compared to WT mice on a sHFD as determined by magnetic resonance imaging (MRI). Omental, subcutaneous (inguinal) and brown, but not visceral (epididymal) adipose tissue was significantly reduced in Asbt−/− mice as compared to WT mice on a sHFD (Figure S1C, Supporting Information). Histological examination of epididymal adipose tissue of sHFD fed mice further revealed a reduction in crown‐like structures in Asbt−/− mice as compared to WT mice, indicative of a reduction in adipocyte death and inflammation[ 26 ] (Figure S2A–C, Supporting Information). Together these data show that Asbt−/− mice are partially protected from diet‐induced on a sHFD.
To assess the effect of ASBT deficiency on glucose homeostasis, we performed an ITT, OGTT and measured fasting insulin levels. sLFD feeding for 12 weeks did not induce differences in ITT, OGTT and plasma insulin between Asbt−/− and WT mice (Figure S3A–E, Supporting Information). Asbt−/− mice, fed a sHFD for 12 weeks, showed a pronounced improvement on insulin sensitivity (Figure 2D,E, AUC 1438 vs 898, p < 0.001). This was accompanied by a lower plasma insulin levels after a 4 h fast in Asbt−/− compared to WT mice on the sHFD (Figure 2F, 0.7 vs 3.6 ng mL−1, p = 0.001). However, there was no difference in glucose tolerance of Asbt−/− mice compared to WT controls (Figure 2D,E, AUC 2324 vs 2155, p = 0.1).
2.3. ASBT Deficiency Prevents Development of High‐Fat Diet‐Induced NAFLD
To determine whether previously observed effects on NAFLD with an ASBTi are also present in Asbt−/‐ mice, we measured hepatic lipid content.[ 14 ] Both absolute liver weight and liver to bodyweight ratio were similar in Asbt−/− compared to WT mice fed a sLFD, but significantly lower in Asbt−/− compared to WT mice on a sHFD (Figure S4, Supporting Information, Figure 3A, 0.044 vs 0.032, p = 0.03). Hepatic TG levels after 16 weeks of sHFD feeding were markedly higher in WT compared to Asbt−/− mice (Figure 3B, 221 vs 46 μmol g−1, p < 0.001) and not different when fed a sLFD (Figure 3B). Asbt knockout was effective in preventing hepatic cholesterol accumulation, both in sLFD and sHFD fed mice (Figure 3C, 4.1 vs 6.1 μmol g−1, p = 0.05; 4.2 vs 9.5 μmol g−1, p < 0.001; in Asbt−/− and WT mice, respectively). Liver histology showed a significantly lower NAS in Asbt−/− mice compared to WT mice fed a sHFD (Figure 3D–F).
Figure 3.
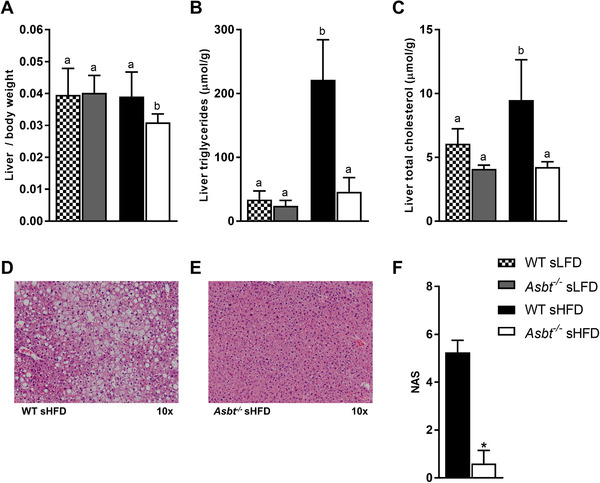
Non‐alcoholic fatty liver disease (NAFLD) in Asbt−/− and WT mice fed a sHFD. A) Liver weight to body weight ratio; B) hepatic TG and C) hepatic total cholesterol in mice fed the sLFD and sHFD, n = 8 to 10; D) H&E staining of WT mouse liver after sHFD feeding, E) H&E staining of Asbt−/− mouse liver after sHFD feeding, representative samples; F) NAFLD activity score (NAS) based on histology, n = 4 to 5. Different lowercase letters indicate statistically significant differences (p < 0.05) between four groups. Between two groups statistical difference is indicated as *p < 0.05, **p < 0.01, ***p < 0.001.
2.4. Fecal Fatty Acid Excretion is Increased and Biliary Bile Acid Secretion Decreased in Asbt−/− Mice Fed an SFA‐Rich HFD
We hypothesized that the reduced fat absorption observed upon ASBT inhibition is the result of less efficient micellar solubilization due to lower intestinal BA concentrations. Indeed, biliary BA secretion in Asbt−/− mice was 47% lower compared to WT mice fed a sHFD (Figure 4A, 70 vs 132 μmol per 24 h per 100 g BW, p = 0.03). The bile of Asbt−/− mice contained relatively more tauro‐deoxycholic acid (T‐DCA) and less tauro‐beta‐muricholic acid (T‐βMCA) as compared to WT mice, which resulted in a more hydrophobic BA composition[ 27 ] (Figure S5A,B, Supporting Information). Fecal excretion of BAs was significantly increased in Asbt−/− mice on the sLFD and further increased on the sHFD (Figure S5C, Supporting Information). Total fecal fat excretion was significantly higher in Asbt−/− mice compared to WT mice fed a sHFD (Figure 4B, 79 vs 24 μmol per 24 h, p < 0.001). Fecal excretion of SFAs was significantly increased by 2.2‐fold for myristic acid (C14:0), 3.3‐fold for palmitic acid (C16:0), and 3.4‐fold for stearic acid (C18:0) (Figure 4C) in Asbt−/− compared to WT mice on a sHFD). Absolute fatty acid excretion was higher for the MUFAs, vaccenic (C18:1ω7), and oleic acid (C18:1ω9) and lower for the PUFAs, linoleic (C18:2ω6), and alpha linoleic acid (C18:3ω3) (Figure 4D). Fecal excretion of all unsaturated fatty acids was increased by ≈threefold in Asbt−/− compared to WT mice. However, the absorption of SFAs was more affected than that of the PUFAs, as indicated by an increased fecal SFA:PUFA ratio of Asbt−/− mice (Figure 4E). Fecal neutral sterol excretion was also increased in Asbt−/− mice on the sHFD (Figure S5D, Supporting Information). On the sLFD diet, biliary BA secretion was also lower and total fecal fatty acid excretion higher in Asbt−/− mice compared to WT mice (Figure S6A,B, Supporting Information). The increase in fecal fatty acid excretion could be mainly attributed to higher SFA excretion, especially C18:0 (Figure S6C–E, Supporting Information).
Figure 4.
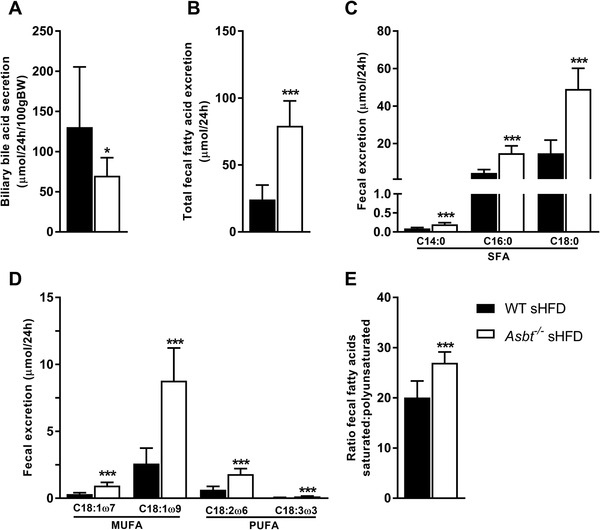
Biliary bile acid secretion and fecal fatty acid excretion in Asbt−/‐ mice fed a sHFD. Biliary BA secretion of WT and Asbt−/− mice A) after 16 weeks of sHFD; B) total fecal fat excretion, C) fecal excretion of the main SFAs, and D) of the main MUFAs/PUFAs; E) the ratio of fecal excretion of SFAs to PUFAs in WT and Asbt−/− mice on the sHFD, n = 9 to 10. Statistical differences are indicated as *p < 0.05, **p < 0.01, ***p < 0.001.
Altogether these data indicate a reduced intestinal lipid absorption, particularly of SFAs in Asbt−/− mice.
2.5. Dietary Fat Composition Modulates Some of the Effects of Diet‐Induced Obesity in Asbt−/− Mice
We next determined whether the effects on specific fatty acid absorption had an impact on diet‐induced obesity by modulating dietary fatty acid composition. To this end we compared the lard based sHFD with a diet with similar fat content but based on soybean and canola oil (pHFD) (Table S1, Supporting Information). The caloric intake on the pHFD was lower, but this did not reach statistical significance (Figure S7, Supporting Information). After 11 weeks on diet, Asbt−/− mice had a significantly lower body weight than WT mice on a sHFD (Figure 5A,B, 40 vs 45 g, p = 0.04) but not on the pHFD. Both WT and Asbt−/− mice on the pHFD had less fat mass and more lean mass compared to their respective sHFD controls (Figure 5C). ASBT inactivation had no additional effect on body composition on either diet. Insulin tolerance was significantly improved in Asbt−/‐ mice on a sHFD after 12 weeks (AUC 1123 vs 1543, p = 0.004, Figure 5D,E). Plasma insulin levels were impacted by both modulating diet (p = 0.02) and genotype (p = 0.002) without interaction (Figure 5F). Post‐hoc analysis showed no significant differences between groups. However, there was a trend of lower insulin levels in Asbt−/− compared to WT mice on the sHFD (3.7 vs 5.1 ng mL−1, p = 0.05) which was less pronounced on the pHFD (3.0 vs 4.0, p = 0.2). Neither modulating the dietary fat composition nor ASBT inactivation affected glucose tolerance (Figure 5G,H).
Figure 5.
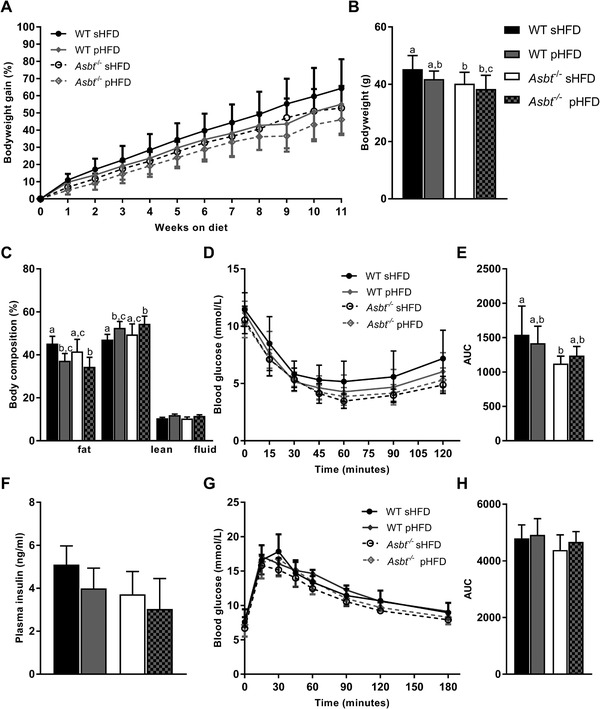
Bodyweight gain and glucose homeostasis in Asbt−/− and WT mice fed a sHFD and pHFD. A) Time course of bodyweight gain expressed as percentage of starting bodyweight, B) bodyweight at week 11 of WT and Asbt−/− mice on sHFD and pHFD, C) body composition after 12 weeks of sLFD and sHFD diet, D) intraperitoneal ITT and E) AUC, F) OGTT, and G) area under the curve (AUC), H) plasma insulin levels in WT and Asbt−/‐ mice fed a sHFD and pHFD; n = 10. Different lowercase letters indicate statistically significant differences (p < 0.05) between groups.
Altogether, compared to WT mice on the same diet, Asbt−/− mice only displayed a significant reduction in bodyweight gain on the sHFD and not the pHFD.
2.6. Intestinal Fat Absorption is Higher on a Diet Rich in Polyunsaturated Fatty Acids Compared to Saturated Fatty Acids in both WT and Asbt−/− Mice
We next examined whether modulating dietary fat composition affected BA homeostasis and lipid absorption. In WT mice fecal BA and neutral sterol excretion were unaffected by dietary fatty acid composition (Figure S8A,B, Supporting Information). Asbt−/− mice had strongly increased fecal BA and neutral sterol excretion compared to their respective controls. Interestingly, Asbt−/− mice on the pHFD had slightly lower fecal BA excretion compared to the sHFD (Figure S8A, Supporting Information). Biliary BA excretion was about 45% lower for both Asbt−/− groups compared to WT, and was unaffected by dietary composition (Figure 6A). Both Asbt−/− groups had higher concentrations of T‐DCA compared to WT, resulting in a higher hydrophobicity index (Figure S8C, Supporting Information).
Figure 6.
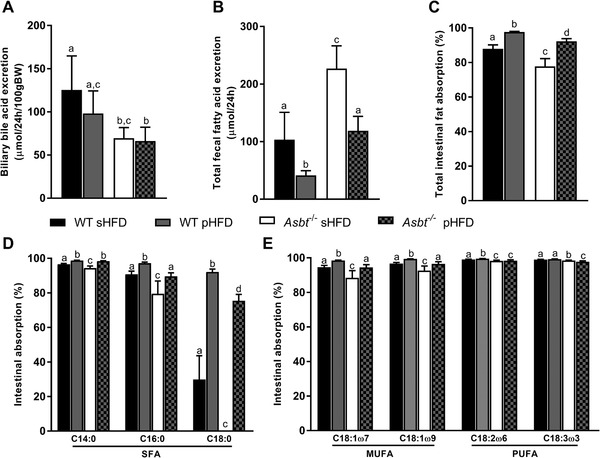
Biliary bile acid secretion and fecal fatty acid excretion in Asbt−/‐ mice fed a sHFD and pHFD. A) biliary BA secretion, B) total fecal fatty acid excretion, and C) total intestinal fatty acid absorption on the sHFD and pHFD, n = 8 to 10. Intestinal absorption of D) the main SFA and E) the PUFAs/MUFAs of WT and Asbt−/− mice on the sHFD and pHFD, n = 10. Different lowercase letters indicate statistically significant differences (p < 0.05) between groups.
Total fecal fat excretion was ≈60% lower in WT mice on a pHFD compared to the sHFD (p < 0.001, Figure 6B). Total fat excretion in Asbt−/−mice was also lower on the pHFD compared to the sHFD (p < 0.001, Figure 6B). This observation was reflected in total fatty acid absorption, which was higher in both pHFD groups compared to the sHFD groups (Figure 6C). The decrease in total fatty acid absorption was ≈10% for Asbt−/− mice compared to WT mice on the sHFD (p < 0.001, Figure 6C) and was ≈5% on the pHFD (p < 0.001, Figure 6C). SFA absorption was overall decreased on the sHFD but most pronounced for C16:0 and C18:0 with absorption for C18:0 being as low as 0% for Asbt−/− mice on the sHFD (Figure 6D). The absorption of MUFAs was higher on the pHFD than on the sHFD (Figure 6E). For the main dietary PUFA, linoleic acid (C18:2ω6), Asbt−/− mice showed a similar reduction on either diet compared to their respective controls (98.3% vs 99.1% for sHFD, p < 0.001, 98.3% vs 99.5% for pHFD, p < 0.001, Figure 6E).
These data show that absorption of fatty acids was generally more efficient on the pHFD compared to the sHFD. In line with greater BA dependency, SFA absorption was most profoundly affected in Asbt−/− mice, especially on the sHFD.
2.7. Asbt−/− Mice Are Protected against Diet‐Induced NAFLD on a Diet Rich in Saturated Compared to Polyunsaturated Fatty Acids
Previously, it has been shown that ASBT inhibition robustly prevents hepatic lipid accumulation in mice.[ 14 , 18 ] In our current experiment, liver‐to‐bodyweight ratio was not different in WT mice fed a sHFD or pHFD (Figure 7A). Asbt−/− mice on either diet had a decreased liver‐to‐bodyweight ratio compared to their respective controls but this difference was more pronounced on the sHFD. Hepatic TG content (Figure 7B) was 55% lower in Asbt−/− compared to WT mice on the sHFD (75 vs 168 μmol g−1 liver, p = 0.004) and 40% lower on the pHFD (124 vs 205 μmol g−1, p = 0.01). In Asbt−/‐ mice, both total fat absorption and the absorption of C16:0 were positively correlated to hepatic TG level (Spearman r = 0.55, p = 0.01, Figure S9A,B, Supporting Information). Hepatic total cholesterol levels were similarly lower by ≈30% in Asbt−/− mice on either diet compared with WT (Figure 7C). Histological analysis showed a significantly lower NAS in Asbt−/− compared to WT mice fed a sHFD (1.6 vs 4.3, p = 0.02, Figure 7D,E,H). NAS was not significantly lower in Asbt−/− compared to WT mice on the pHFD (2.3 vs 3.3, p = 0.65, Figure 7F–H). The higher absolute uptake of PUFAs on the pHFD was associated with elevated concentrations of both linoleic (C18:2ω6) and alpha‐linoleic acid (C18:3ω3) in the hepatic fatty acid profile (Figure 8 ).
Figure 7.
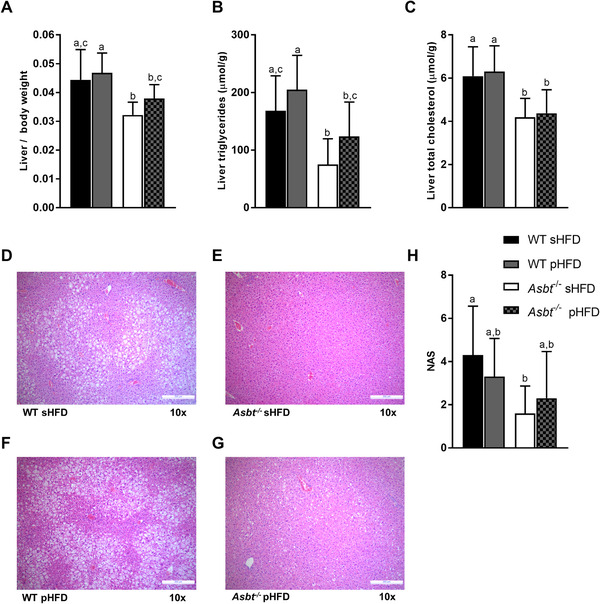
Non‐alcoholic fatty liver disease (NAFLD) development in WT and Asbt−/− mice fed different HFDs. A) Liver weight to body weight ratio; B) liver TGs and C) hepatic total cholesterol in mice fed a sHFD and pHFD, n = 10; H&E staining of D) WT mouse liver and E) Asbt−/− mouse liver after sHFD feeding, and F) WT mouse liver and G) Asbt−/− mouse liver after pHFD feeding, representative samples; H) NAS, n = 10. Different lowercase letters indicate statistically significant differences (p < 0.05) between groups.
Figure 8.
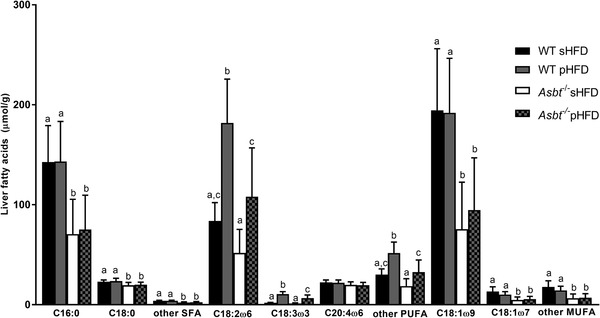
Liver fatty acid profile in WT and Asbt−/− mice fed the sHFD or pHFD, n = 10. Different lowercase letters indicate statistically significant differences (p < 0.05) between groups.
These data demonstrate that modulating dietary fatty acid composition did not significantly affect NAFLD outcomes in WT mice. While Asbt−/− mice displayed reduced hepatic lipid accumulation on either diet, the NAS was only lower in Asbt−/− mice on the sHFD and not on the pHFD, indicating that Asbt knockout was more effective in the prevention of NAFLD on the sHFD.
3. Discussion
We determined the effects of inhibiting ASBT‐mediated intestinal BA absorption on the intestinal absorption of fatty acids, and on diet‐induced metabolic dysfunction. Cholesterol and long‐chain SFAs are more dependent on micellar solubilization by BAs for their absorption from the intestinal lumen than PUFAs or short‐chain fatty acids.[ 7 , 38 , 39 ] Here, we show that inhibition of ASBT in mice decreased total intestinal absorption of fatty acids and the effect was most prominent for SFA species. While the reduction in specific fatty acid absorption was correlated to literature values of their HPLC retention time, a surrogate measure for hydrophobicity, and in turn BA‐dependency, other factors affecting solubilization are likely to be involved as well. The physiological solubilization in the intestinal lumen varies greatly for different fatty acid species and is influenced by the CMC of intestinal BAs, the other components of mixed micelles (such as phospholipids and cholesterol), and the pH level.[ 35 , 36 , 40 ] Interestingly, significant beneficial effects on obesity and insulin resistance were only observed in a SFA‐rich HFD, indicating that dietary fat composition and specific reduction of SFA absorption modulated these effects. While Asbt−/− mice were (partially) protected from hepatic TG accumulation irrespective of dietary fatty acid composition, the NAS was only lower in Asbt−/− mice on a SFA‐rich HFD. Together these results demonstrate that several of the beneficial metabolic effects of ASBT inhibition correspond with its differential inhibitory effect on dietary fatty acid absorption.
Total fat absorption in Asbt−/− mice was reduced to a greater extent on the sHFD (−10%) than on the soybean and pHFD (−5%), when compared to WT controls. This is in line with the sHFD higher content of SFAs, which are more dependent on BAs for absorption. Asbt−/− mice fed a sHFD but not a pHFD gained less weight and had reduced insulin resistance compared to WT littermates fed the same diet. This could be explained either by a direct effect of absorbing fewer calories from fat or by an indirect effect (e.g., hormonal or microbial). An indirect effect is in line with a previous suggestion that when more fatty acids reach the distal intestine, they increase glucagon‐like peptide‐1 (GLP‐1) release, resulting in improved glucose homeostasis.[ 31 ] Unfortunately, we were unable to assess GLP‐1 secretion in our current study.
Dietary fat composition also impacted fatty acid absorption in WT mice. Total fat absorption in WT mice was lower on a sHFD (88%) than on a pHFD (98%). Generally, SFA absorption was less efficient than MUFA or PUFA absorption (Figure 1). Increasing dietary SFA content lowered total intestinal fat absorption, even in WT mice. However, not only total but also fractional SFA absorption in mice fed the sHFD was lower than on the pHFD (Figure 6). Under physiological conditions, intestinal fatty acid absorption is highly efficient (>95%) and adapts to dietary concentrations.[ 32 ] However, chronic HFD feeding by itself has been shown to decrease intestinal fat absorption in mice, which could be differentially affected depending on the dietary fatty acid profile.[ 33 ]
Previous studies have reported a robust prevention of hepatic TG accumulation upon ASBT inhibition or genetic inactivation in mice.[ 14 , 18 ] We also found strongly decreased hepatic lipid accumulation in Asbt−/− mice irrespective of dietary fatty acid composition. However, the preventative effect of ASBT inactivation on hepatic TG accumulation was more pronounced on the sHFD compared to the pHFD. Additionally, the NAS was only reduced in Asbt−/− mice fed the sHFD and not the pHFD. The reduction in fat absorption correlated to the lowering of hepatic TG accumulation suggesting a relationship between the two. This is in line with a previous study where the beneficial effects of ASBT inhibition on NAFLD development were lost on a CDAA diet that also normalized the inhibitory effects on fat absorption.[ 10 ] Although the reduction in fat absorption can partially explain the effects on NAFLD, other changes such as reduced activation of FXR, increased activation of TGR5, or shifts in microbiota composition likely contribute. The shift towards more DCA in the BA pool of Asbt−/− mice could have an effect independent of fat absorption, for example via TGR5 or hepatic FXR activation.[ 14 ] A recent study demonstrated that intraduodenal injections of TCA and especially DCA, lowered postprandial plasma lipids, suggesting an additional (receptor‐mediated) effect of these BAs on intestinal lipid handling.[ 34 ]
We noted that there were differences in metabolic improvements between the different experiments using the same sHFD. A potential explanation for this difference is that the age and the bodyweight of mice used in the second experiment were higher compared to the first experiment (10.9 vs 8.5 weeks; and, 26.8 vs 24.2 g, respectively). Furthermore, both the sHFD and pHFD were administrated as paste instead of pellets during the second experiment. Dietary form has been shown to alter food intake and bodyweight gain in mice and could have affected the different outcomes.[ 35 ]
Together, our data show that ASBT deficiency impairs intestinal fatty acid absorption, particularly of SFAs, which is largely responsible for the beneficial effects observed on diet‐induced obesity and NAFLD in Asbt−/− mice. Changing the dietary composition to a more PUFA based diet increased total fat absorption and decreased the beneficial effects on diet‐induced obesity observed in Asbt−/− mice compared to WT mice on the same diet. Additionally, a higher intestinal (saturated) fatty acid absorption in Asbt−/− mice correlated to a higher hepatic triglyceride content. The differences in metabolic outcomes using distinct HFDs highlight the importance of dietary fat composition in metabolic research interpretation and design in mice, and perhaps also in humans. The implications of this study for human physiology and therapy require further investigation as human BA profiles are different (i.e., the absence of hydrophilic MCAs) and fat absorption might be affected differently by ASBT inhibition. Nevertheless, based on these preclinical findings, the effectiveness of ASBT inhibition on metabolic outcomes is likely dependent on dietary fatty acid content and profile. Therefore, diet composition should be taken into consideration when designing new experiments and assessing the therapeutic efficacy of ASBT inhibition and other therapies related to the manipulation of the enterohepatic circulation of BAs.
4. Experimental Section
Animals
For the experiment with the ASBT inhibitor (ASBTi), male C57Bl/6J mice aged 8 weeks were obtained from Jackson Laboratories. Animals were initially group‐housed and then individually housed for 1 week during the fat absorption measurements at 23 °C and a 12‐h light/dark cycle. Mice received a 45% trans‐fat HFD (tHFD, Harlan Teklad TD130885, ALIOS custom diet with 0.2% added cholesterol) plus 0.006% w/w of an ASBT inhibitor (ASBTi, SC‐435, Lumena Pharmaceuticals/Shire, MA, USA) ad libitum for 2 weeks. The Emory University Institutional Animal Care and Use Committee approved these experiments (protocol #4000003).
Asbt−/− mice and wild type littermates on a >99% C57BL/6 background were generated by P.A. Dawson and bred at the animal facility of the University Medical Center Groningen. Males aged 8–15 weeks were conventionally housed in a temperature‐ and light‐controlled facility with a 12‐h light/dark cycle. Mice had ad libitum access to water and a 60% SFA rich high‐fat diet (sHFD, Research Diets Inc., NJ, USA, #D12492) or PUFA rich high‐fat diet (pHFD, Research Diets Inc., NJ, USA, #D17122702Mi) or matched SFA based low fat control diet (sLFD, Research Diets Inc., NJ, USA, #D12450J). Table S1, Supporting Information shows the fatty acid compositions of the different diets used. Mice were individually housed and received the experimental diet for a total of 16 weeks. These animal experiments were approved by the Ethics Committee for Animal Experiments of the University of Groningen (protocol #15245‐03‐05/020/036). All experiments were performed in accordance with relevant guidelines and regulations (including laboratory and biosafety regulations).
Dosage Information
Mice received the ASBTi (SC‐435) uniformly mixed in the diet at 0.006% w/w. This equates to 6.7 mg kg−1 bodyweight per day, calculated using average bodyweight and food intake data (Table S2, Supporting Information). This dosage in mice translates to a human equivalent dose (HED) of 0.5 mg kg−1 bodyweight.[ 36 ]
Animal Experiments
Bodyweight was determined biweekly. Body composition was determined by magnetic resonance imaging using a MiniSpec LF90 Body Composition Analysis (Bruker Biospin, Germany). After 16 weeks mice were anesthetized using a mixture of intraperitoneal Hypnorm (fentanyl/fluanisone; 1 mL kg−1) and diazepam (10 mg kg−1). The common bile duct was cannulated as described before.[ 37 ] Bile collected in the first 5 min was discarded and collected for the subsequent 20 min Blood was obtained via cardiac puncture. Livers were excised, weighed and snap frozen in liquid nitrogen.
Fatty Acid Absorption
Mice were individually housed during the second week of the experiment and received powdered tHFD or sHFD/pHFD in paste containing 0.7% sucrose polybehenate w/w (SEFOSE 2275; Proctor and Gamble, Cincinnati, OH) as a nonabsorbable marker.[ 38 ] Chemical hydrolysis of dietary or fecal samples liberates the behenic acid permitting determination of the fatty acid to behenic acid ratios. Feces were collected for the final 3 days of the experiment.
Diet and feces were saponified with methanolic NaOH, extracted with hexane, converted to methyl esters, and analyzed by gas chromatography to quantitate behenic acid (C22:0) and other fatty acids.[ 39 ] The coefficient of absorption for each FA was calculated as {1 − (FA/C22:0)feces / (FA/C22:0)diet} × 100.
Glucose Homeostasis
Oral glucose tolerance tests (OGTT) were performed following oral administration of D‐glucose at 2 g kg−1 body weight after an overnight fast. Insulin tolerance tests (ITT) were performed following intraperitoneal administration of insulin (Novorapid, Novo Nordisk, Denmark) at 0.5 U kg−1 bodyweight for sLFD mice, and 1 U kg−1 body weight for sHFD and pHFD mice after a 6 h fast. Blood glucose was measured using a OneTouch Ultra glucometer (Lifescan Inc, USA) for the sHFD/sLFD experiment and using an Accu‐Chek Performa glucometer (Roche, Switzerland) for the sHFD/pHFD experiment. Plasma insulin concentrations were determined using the ultra‐sensitive rat insulin ELISA kit, with mouse insulin standard from Crystal Chem (Cat. 90010 and 90020, Zaandam, The Netherlands).
Histology
Formalin‐fixed and paraffin‐embedded hematoxylin and eosin (H&E) stained slides of liver and epididymal adipose tissue were used for histopathologic examination. Slides were examined and scored blindly, and findings were reviewed by veterinary pathologists (authors LB, RT, and AdB). H&E liver specimens were evaluated using the modified version of NAFLD activity score (NAS) scoring for as detailed by Kleiner et al.[ 40 ] which combines each component of the NAS; steatosis (0 = <5%; 1 = 5 to 33%; 2 = 33 to 66%; 3 = >66%), lobular inflammation (0–3), ballooning (0–2). Ballooned hepatocytes are recognized as being markedly enlarged with pale vacuolated cytoplasm and a centrally located and compressed nucleus. Lobular inflammation was recognized as small clusters (>5 cells) of mixed inflammatory cells scattered throughout the hepatic parenchyma; in many cases these were characterized by groups of mixed inflammatory cells, mainly lymphocytes and neutrophils (counts were performed over 5 × 200 fields), occasionally associated with single‐cell necrosis. Paraffin‐embedded H&E stained slides of adipose tissue were analyzed using digital image analysis software.[ 41 ] Crown‐like structures, indicative of adipocyte death and macrophage infiltration,[ 26 ] were counted over 5 × 200 fields.
Bile Acid and Neutral Sterol Measurements
Neutral sterols (cholesterol and its bacterial metabolites) were extracted from 50 mg of air‐dried, ground fecal samples as described by Ronda et al.[ 42 ] BAs were extracted from feces with Sep‐Pak C‐18 columns, methylated with methanol/acetyl chloride (20:1) and derivatized with BSTFA‐pyridine‐TMCS (5:5:0.1). Both neutral sterols and BAs were measured by gas chromatography (GC) as previously described.[ 43 ] The total amount of BAs or neutral sterols was calculated as the sum of the individual species.
Biliary BA concentrations were measured using Ultra High Performance Liquid Chromatography coupled to a triple quadrupole mass spectrometer (UPLC‐MS/MS) as previously described.[ 11 ]
Hepatic Lipids
Hepatic lipids for the experiment with the ASBTi were extracted according to the Folch method.[ 44 ] Briefly, lipids were extracted from ≈60 mg liver tissue using 3 mL of chloroform: methanol (2:1) and incubated at 55 °C for at least 2 h. Phases were separated by adding 0.05% v/v sulfuric acid in water and centrifugation at 1500 rpm for 15 min. Part of the bottom layer was transferred, dried down under nitrogen and dissolved in 2% v/v TritonX‐100 in water. Hepatic concentrations of total cholesterol (Pointe Scientific, C7510‐01‐906), free cholesterol (Wako Diagnostics, Cat# 993‐02501), and TG (Wako Diagnostics, Cat#994‐02891 and 990‐02991) were subsequently measured by enzymatic assays.
Livers from the experiments with Asbt−/− mice were mechanically homogenized in liquid nitrogen. Lipids were extracted from 10% to 15% homogenates in PBS according to Bligh and Dyer.[ 45 ] Subsequently, total and free cholesterol and TG levels were determined using commercially available reagents (DiaSys Diagnostic Systems, Holzheim, Germany and Roche Diagnostics, Mannheim, Germany).
Statistical Analyses
Statistical analyses were performed and graphs were created using GraphPad Prism 6 (GraphPad Software, La Jolla, CA, USA). Data are presented as mean ± standard deviation (SD), unless stated otherwise. Differences between 4 groups were assessed by 2‐way ANOVA using Tukey's post‐hoc test. Differences between two groups were determined with a Mann–Whitney U test. Significant differences (p < 0.05) between groups when assessing four groups is indicated by different lowercase letters. Statistical difference between two groups is indicated as *p < 0.05, **p < 0.01, ***p < 0.001.
Conflict of Interest
The authors declare no conflict of interest.
Author Contributions
I.P.P. designed the experiments, acquired data, performed data analysis and interpretation, and wrote the manuscript. A.R. designed experiments, acquired data, and revised the manuscript. M.B.D. acquired data and revised the manuscript. L.B., R.T., and A.B. performed histology analyses and revised the manuscript. S.J.K. and P.A.D. designed experiments and revised the manuscript. H.J.V. and J.W.J. designed the experiments, supervised the study, interpreted the data, and wrote the manuscript.
Supporting information
Supporting Information
Acknowledgements
The authors would like to thank Dicky Struik, Rick Havinga, Martijn Koehorst, Renze Boverhof, Anna Bertolini, Mirjam Koster, Ingrid Martini, and Matthew Davis for excellent technical assistance. The authors also thank Lumena Pharmaceuticals/Shire for the research gift of SC‐435. This study was supported by grants from the The Netherlands Organization for Scientific Research (VICI Grant 016.176.640 to J.W.J.), the European Foundation for the Study of Diabetes (EFSD Award supported by Novo Nordisk to J.W.J.), the De Cock Stichting and the NIH (DK56239 to S.J.K. and DK047987 to P.A.D.).
van de I. P. Peppel, Rao A., Dommerholt M. B., Bongiovanni L., Thomas R., de A. Bruin, Karpen S. J., Dawson P. A., Verkade H. J., Jonker J. W., The Beneficial Effects of Apical Sodium‐Dependent Bile Acid Transporter Inactivation Depend on Dietary Fat Composition. Mol. Nutr. Food Res. 2020, 64, 2000750 10.1002/mnfr.202000750
Contributor Information
Ivo P. van de Peppel, Email: i.p.van.de.peppel@umcg.nl.
Johan W. Jonker, Email: j.w.jonker@umcg.nl.
Data Availabiltiy Statement
The data that support the findings of this study are available from the corresponding author upon reasonable request.
References
- 1. Heymsfield S. B., Wadden T. A., N. Engl. J. Med. 2017, 376, 254. [DOI] [PubMed] [Google Scholar]
- 2. Eslam M., Sanyal A. J., George J., Sanyal A., Neuschwander‐Tetri B., Tiribelli C., Kleiner D. E., Brunt E., Bugianesi E., Yki‐Järvinen H., Grønbæk H., Cortez‐Pinto H., Fan J., Valenti L., Abdelmalek M., Romero‐Gomez M., Rinella M., Arrese M., Bedossa P., Newsome P. N., Anstee Q. M., Jalan R., Bataller R., Loomba R., Sookoian S., Sarin S. K., Harrison S., Kawaguchi T., Wong V. W. S., Ratziu V., et al., Gastroenterology 2020, 158, 1999. [DOI] [PubMed] [Google Scholar]
- 3. Chávez‐Talavera O., Tailleux A., Lefebvre P., Staels B., Gastroenterology 2017, 152, 1679. [DOI] [PubMed] [Google Scholar]
- 4. Kuipers F., Bloks V. W., Groen A. K., Nat. Rev. Endocrinol. 2014, 10, 488. [DOI] [PubMed] [Google Scholar]
- 5. Westergaard H., Dietschy J. M., J. Clin. Invest. 1976, 58, 97. [DOI] [PMC free article] [PubMed] [Google Scholar]
- 6. Reis S., Moutinho C. G., Matos C., De Castro B., Gameiro P., Lima J. L. F. C., Anal. Biochem. 2004, 334, 117. [DOI] [PubMed] [Google Scholar]
- 7. Phan C. T., Tso P., Front. Biosci. 2001, d299. [DOI] [PubMed] [Google Scholar]
- 8. Schaap F. G., Trauner M., Jansen P. L. M., Nat. Rev. Gastroenterol. Hepatol. 2014, 11, 55. [DOI] [PubMed] [Google Scholar]
- 9. Dawson P. A., Haywood J., Craddock A. L., Wilson M., Tietjen M., Kluckman K., Maeda N., Parks J. S., J. Biol. Chem. 2003, 278, 33920. [DOI] [PubMed] [Google Scholar]
- 10. Rao A., van de Peppel I. P., Gumber S., Karpen S., Dawson P. A., Front. Med. 2020, 7, 60. [DOI] [PMC free article] [PubMed] [Google Scholar]
- 11. Van De Peppel I. P., Bertolini A., Van Dijk T. H., Groen A. K., Jonker J. W., Verkade H. J., J. Lipid Res. 2019, 60, 1562. [DOI] [PMC free article] [PubMed] [Google Scholar]
- 12. Minich D. M., Havinga R., Stellaard F., Vonk R. J., Kuipers F., Verkade H. J., Am. J. Physiol. 2000, 279, G1242. [DOI] [PubMed] [Google Scholar]
- 13. Kalivianakis M., Minich D. M., Havinga R., Kuipers F., Stellaard F., Vonk R. J., Verkade H. J., Am. J. Clin. Nutr. 2000, 72, 174. [DOI] [PubMed] [Google Scholar]
- 14. Rao A., Kosters A., Mells J. E., Zhang W., Setchell K. D. R., Amanso A. M., Wynn G. M., Xu T., Keller B. T., Yin H., Banton S., Jones D. P., Wu H., Dawson P. A., Karpen S. J., Sci. Transl. Med. 2016, 8, 357ra122 LP. [DOI] [PMC free article] [PubMed] [Google Scholar]
- 15. Gallo‐Torres H. E., Miller O. N., Hamilton J. G., Arch. Biochem. Biophys. 1971, 143, 22. [DOI] [PubMed] [Google Scholar]
- 16. Wang D. Q.‐H., Tazuma S., Cohen D. E., Carey M. C., Am. J. Physiol. Gastrointest. Liver Physiol. 2003, 285, G494. [DOI] [PubMed] [Google Scholar]
- 17. L T. an, Haywood J., Dawson P. A., Atherosclerosis 2013, 229, 374. [DOI] [PMC free article] [PubMed] [Google Scholar]
- 18. Salic K., Kleemann R., Wilkins‐Port C., McNulty J., Verschuren L., Palmer M., PLoS One 2019, 14, e0218459. [DOI] [PMC free article] [PubMed] [Google Scholar]
- 19. Chen L., Yao X., Young A., McNulty J., Anderson D., Liu Y., Nystrom C., Croom D., Ross S., Collins J., Rajpal D., Hamlet K., Smith C., Gedulin B., AJP Endocrinol. Metab. 2012, 302, E68. [DOI] [PubMed] [Google Scholar]
- 20. Lundåsen T., Andersson E.‐M., Snaith M., Lindmark H., Lundberg J., Östlund‐Lindqvist A.‐M., Angelin B., Rudling M., PLoS One 2012, 7, e37787. [DOI] [PMC free article] [PubMed] [Google Scholar]
- 21. van de Peppel I. P., Verkade H. J., Jonker J. W., Am. J. Physiol. ‐ Gastrointest. Liver Physiol. 2020, 10.1152/ajpgi.00308.2020 [DOI] [PubMed] [Google Scholar]
- 22. Newsome P. N., Palmer M., Freilich B., Sheikh M. Y., Sheikh A., Sarles H., Herring R., Mantry P., Kayali Z., Hassanein T., Lee H.‐M., Aithal G. P., J. Hepatol. 2020, 73, 231. [DOI] [PubMed] [Google Scholar]
- 23. Lin J.‐T., a. McKeon T., Stafford A. E., J. Chromatogr. A 1995, 699, 85. [Google Scholar]
- 24. McKimmie R. L., Easter L., Weinberg R. B., Am. J. Physiol. ‐ Gastrointest. Liver Physiol. 2013, 305, G620. [DOI] [PMC free article] [PubMed] [Google Scholar]
- 25. Smith A., Lough A. K., Br. J. Nutr. 1976, 35, 77. [DOI] [PubMed] [Google Scholar]
- 26. Murano I., Barbatelli G., Parisani V., Latini C., Muzzonigro G., Castellucci M., Cinti S., J. Lipid Res. 2008, 49, 1562. [DOI] [PubMed] [Google Scholar]
- 27. Heuman D. M., J. Lipid Res. 1989, 30, 719. [PubMed] [Google Scholar]
- 28. Sallee V. L., Am. J. Physiol. 1979, 236, 721. [DOI] [PubMed] [Google Scholar]
- 29. Hofmann A. F., Nature 1961, 190, 1106. [DOI] [PubMed] [Google Scholar]
- 30. Holt P. R., Arch. Intern. Med. 1972, 130, 574. [PubMed] [Google Scholar]
- 31. Hofmann A. F., Hepatology 2011, 53, 1784. [DOI] [PubMed] [Google Scholar]
- 32. Niot I., Poirier H., Tran T. T. T., Besnard P., Prog. Lipid Res. 2009, 48, 101. [DOI] [PubMed] [Google Scholar]
- 33. Petit V., Arnould L., Martin P., Monnot M. C., Pineau T., Besnard P., Niot I., J. Lipid Res. 2007, 48, 278. [DOI] [PubMed] [Google Scholar]
- 34. Farr S., Stankovic B., Hoffman S., Masoudpoor H., Baker C., Taher J., Dean A. E., Anakk S., Adeli K., Am. J. Physiol. Gastrointest. Liver Physiol. 2020, 318, G682. [DOI] [PubMed] [Google Scholar]
- 35. Yan L., Combs G. F., DeMars L. C., Johnson L. A. K., J. Am. Assoc. Lab. Anim. Sci. 2011, 50, 488. [PMC free article] [PubMed] [Google Scholar]
- 36. Nair A. B., Jacob S., J. Basic Clin. Pharm. 2016, 7, 27. [DOI] [PMC free article] [PubMed] [Google Scholar]
- 37. Kuipers F., van Ree J. M., Hofker M. H., Wolters H., In't Veld G., Havinga R., Vonk R. J., Princen H. M., Havekes L. M., Hepatology 1996, 24, 241. [DOI] [PubMed] [Google Scholar]
- 38. Jandacek R. J., Heubi J. E., Tso P., Gastroenterology 2004, 127, 139. [DOI] [PubMed] [Google Scholar]
- 39. Muskiet F. A. J., van Doormaal J. J., Martini I. A., Wolthers B. G., van der Slik W., J. Chromatogr. B Biomed. Sci. Appl. 1983, 278, 231. [DOI] [PubMed] [Google Scholar]
- 40. Kleiner D. E., Brunt E. M., Van Natta M., Behling C., Contos M. J., Cummings O. W., Ferrell L. D., Liu Y. C., Torbenson M. S., Unalp‐Arida A., Yeh M., McCullough A. J., Sanyal A. J., Hepatology 2005, 41, 1313. [DOI] [PubMed] [Google Scholar]
- 41. Galarraga M., Campión J., Muñoz‐Barrutia A., Boqué N., Moreno H., Martínez J. A., Milagro F., Ortiz‐de‐Solórzano C., J. Lipid Res. 2012, 53, 2791. [DOI] [PMC free article] [PubMed] [Google Scholar]
- 42. Ronda O. A. H. O., van Dijk T. H., Verkade H. J., Groen A. K., Curr. Protoc. Mouse Biol. 2016, 6, 408. [DOI] [PubMed] [Google Scholar]
- 43. Out C., Patankar J. V., Doktorova M., Boesjes M., Bos T., De Boer S., Havinga R., Wolters H., Boverhof R., Van Dijk T. H., Smoczek A., Bleich A., Sachdev V., Kratky D., Kuipers F., Verkade H. J., Groen A. K., J. Hepatol. 2015, 63, 697. [DOI] [PMC free article] [PubMed] [Google Scholar]
- 44. Folch J., Lees M., Sloane Stanley G. H., J. Biol. Chem. 1957, 226, 497. [PubMed] [Google Scholar]
- 45. Bligh E. G., Dyer W. J., Can. J. Biochem. Physiol. 1959, 37, 911. [DOI] [PubMed] [Google Scholar]
Associated Data
This section collects any data citations, data availability statements, or supplementary materials included in this article.
Supplementary Materials
Supporting Information
Data Availability Statement
The data that support the findings of this study are available from the corresponding author upon reasonable request.


