

Abstract
Background/Introduction: Concurrent electroencephalography and resting-state functional magnetic resonance imaging (rsfMRI) have been widely used for studying the (presumably) awake and alert human brain with high temporal/spatial resolution. Although rsfMRI scans are typically collected while individuals are instructed to focus their eyes on a fixated cross, objective and verified experimental measures to quantify degree of vigilance are not readily available. Electroencephalography (EEG) is the modality extensively used for estimating vigilance, especially during eyes-closed resting state. However, pupil size measured using an eye-tracker device could provide an indirect index of vigilance.
Methods: Three 12-min resting scans (eyes open, fixating on the cross) were collected from 10 healthy control participants. We simultaneously collected EEG, fMRI, physiological, and eye-tracker data and investigated the correlation between EEG features, pupil size, and heart rate. Furthermore, we used pupil size and EEG features as regressors to find their correlations with blood-oxygen-level-dependent fMRI measures.
Results: EEG frontal and occipital beta power (FOBP) correlates with pupil size changes, an indirect index for locus coeruleus activity implicated in vigilance regulation (r = 0.306, p < 0.001). Moreover, FOBP also correlated with heart rate (r = 0.255, p < 0.001), as well as several brain regions in the anticorrelated network, including the bilateral insula and inferior parietal lobule.
Discussion: In this study, we investigated whether simultaneous EEG-fMRI combined with eye-tracker measurements can be used to determine EEG signal feature associated with vigilance measures during eyes-open rsfMRI. Our results support the conclusion that FOBP is an objective measure of vigilance in healthy human subjects.
Impact statement
We revealed an association between electroencephalography frontal and occipital beta power (FOBP) and pupil size changes during an eyes-open resting state, which supports the conclusion that FOBP could serve as an objective measure of vigilance in healthy human subjects. The results were validated by using simultaneously recorded heart rate and functional magnetic resonance imaging (fMRI). Interestingly, independently verified heart rate changes can also provide an easy-to-determine measure of vigilance during resting-state fMRI. These findings have important implications for an analysis and interpretation of dynamic resting-state fMRI connectivity studies in health and disease.
Keywords: EEG, eye tracker, heart rate, resting-state fMRI, pupillometry, vigilance
Introduction
Resting-state functional magnetic resonance imaging (rsfMRI) has become an important tool for studying the human brain due to its simplicity and noninvasiveness, as well as its requisite of least effort from the subjects (Fox and Greicius, 2010; Lee et al., 2013; Smitha et al., 2017). rsfMRI scans are conducted with eyes-closed, eyes-open, or eyes fixating on a cross. Cross fixation is the most often used paradigm and produces the most reliable results (Patriat et al., 2013; Yuan et al., 2013). However, it is unclear how well individuals manage to keep their eyes open and their gaze on the fixated cross over time, using this paradigm.
In addition, an individual's degree of changes in vigilance during rsfMRI may affect functional connectivity results in both the cortical and subcortical brain regions (Falahpour et al., 2018). Therefore, to obtain a measure of vigilance during rsfMRI scans, using another modality, such as eye-tracking or electroencephalography (EEG), is necessary. Notable, vigilance is a term that has been used with various definitions by different groups of scientists (Oken et al., 2006; Sander et al., 2015), such as the ability to sustain attention to a task for a period of time (Davies and Parasuraman, 1982; Foxe et al., 2012) and attention to potential threats or dangers (Mogg et al., 2000). One of the most common definitions for vigilance is tonic alertness (Chang et al., 2016; Posner, 2008; Schneider et al., 2016), which has been used in this study.
Independent and concurrent modality signals such as EEG and eye tracker could be used to continuously characterize one's fluctuations in vigilance, allowing researchers to use this vigilance index to assess fMRI data quality better. Even though the eye-tracker setup might be easier than EEG during fMRI acquisition, EEG is the modality widely used simultaneously with fMRI. The reason for that is, simultaneous EEG-fMRI leverages fMRI's capacity to measure whole-brain hemodynamic activities at the high spatial resolution of fMRI and high temporal resolution of EEG signals, directly reflecting electrophysiological brain activities (Niazy et al., 2005). In other words, unlike eye tracker, EEG recording during fMRI acquisition could provide additional brain information except for the subject's vigilance level.
Indeed, EEG is the modality most extensively used for monitoring vigilance, specifically during eyes-closed resting states (Berry et al., 2012; Hegerl et al., 2008; Horovitz et al., 2008; Olbrich et al., 2009; Sadaghiani et al., 2010; Wong et al., 2013). Slow-wave EEG is mostly studied during sleep (Ferrarelli et al., 2019; Korf et al., 2017), since delta (<4 Hz) and theta (4–7 Hz) waves dominate the EEG signal during drowsiness and sleep (Korf et al., 2017). In contrast, alpha (7–13 Hz) and beta (13–30 Hz) rhythms and the ratio of high- to low-frequency band power have been used to measure vigilance levels during resting states as well as during active tasks (Belyavin and Wright, 1987; Chang et al., 2016; Makeig and Inlow, 1993; Sadaghiani et al., 2010).
For instance, Hegerl et al. (2008) defined three vigilance states based on EEG frequency characteristics during an eyes-closed rsfMRI recording: (1) alertness and relaxed wakefulness, characterized by dominant alpha activity, (2) drowsiness, classified by dissolving alpha activity and theta rhythm dominance; and (3) sleep, marked by slow-wave activity and sleep spindles. Furthermore, they validated the results of the EEG vigilance classification by analyzing the heart rates during the different brain states (Olbrich et al., 2009). When these EEG vigilance states were correlated with simultaneously recorded rsfMRI data, findings demonstrated that decreased vigilance was linked to a higher blood-oxygen-level-dependent (BOLD) signal in the parietal/occipital cortices, as well as in regions of the prefrontal and anterior cingulate cortices (PFC and ACC); in addition, decreased vigilance was associated with reduced BOLD signal within the thalamus as well as in other specific regions of PFC (Olbrich et al., 2009). An additional eyes-closed rsfMRI study recording simultaneous EEG (Sadaghiani et al., 2010) introduced global field power (GFP) of upper alpha band (10–12 Hz) oscillations as the most consistent EEG index of tonic alertness; moreover, the GFP time course of upper alpha band positively correlated with BOLD signal fluctuations within the dorsal ACC, anterior insula, anterior PFC, and thalamus.
A recent study defined an EEG wakefulness index, named as EWI, that relied on both spectral and topographical instantaneous EEG information during eyes-closed resting state (Knaut et al., 2019). Given that eyes-closed and eyes-open conditions provide divergent EEG measures of vigilance with respect to brain topography and power (Barry et al., 2007) as well as differing BOLD signal patterns (Patriat et al., 2013; Zou et al., 2009, 2015a, 2015b), EEG vigilance measures used for eyes-closed resting states may not be easily applied to eyes-open paradigms. More specifically, while several studies showed the higher EEG alpha power is associated with higher vigilance level during eyes closed, it is noted in Oken et al. (2006), during the eyes-open resting state, that a higher EEG alpha power may be associated with lower alertness.
Another potential solution for monitoring vigilance during eyes-open rsfMRI is the use of an eye-tracker device to evaluate pupillometry (DiNuzzo et al., 2019; Murphy et al., 2014; Schneider et al., 2016; Yellin et al., 2015). The mean pupil diameter decreases during drowsiness (Lowenstein et al., 1963; McLaren et al., 1992; Oken et al., 2006), due to low tonic firing rates of the locus coeruleus neurons and dominant parasympathetic nerve system of the pupil (Gilzenrat et al., 2010; Henson and Emuh, 2010).
In this study, we aimed to derive and independently verify vigilance measures obtained from EEG data acquired during rsfMRI. To replicate and extend prior rsfMRI vigilance findings, the present study recorded simultaneous eyes-open rsfMRI, EEG, eye tracking, and heart rate signals from healthy participants. First, we determined EEG features associated with pupil dimension and validated these features by correlating them with heart rate changes associated with arousal. Then, we investigated the relationship between these validated EEG features and BOLD fMRI signals to illustrate the spatial and temporal characteristics of the brain's vigilance response.
Materials and Methods
Data collection
This study was conducted at the Laureate Institute for Brain Research with a research protocol approved by the Western Institutional Review Board (IRB). Although 14 healthy subjects participated in this study, data from 4 volunteers were excluded due to excessive head motion, falling asleep, or closing their eyes during rsfMRI recording. Therefore, data from 10 participants (4 female, age M = 23.0 years, range 19–30 years) were analyzed.
Participants were recruited from the general community through electronic and print advertisements. They were undergoing medical and psychiatric screening evaluations at the Laureate Institute for Brain Research, including Structural Clinical Interview for DSM-IV-TR Axis I Disorders (First et al., 2002). Exclusion criteria included current pregnancy, general MRI exclusions, and any personal major psychiatric or medical disorders. All participants provided written informed consent and received financial compensation for participation. Three 12-min eyes-open rsfMRI runs were collected from each participant. Before each run, participants were instructed to clear their minds, not think about anything in particular, and try to keep their eyes open and fixated on the cross.
A General Electric (GE) Discovery MR750 whole-body 3T MRI scanner (GE Healthcare, Waukesha, WI) and a standard eight-channel, receive-only head coil array were used for imaging.
A single-shot gradient-recalled echoplanar imaging (EPI) sequence with Sensitivity Encoding (SENSE) (Pruessmann et al., 1999) was used for fMRI acquisition with the following parameters: field of view (FOV)/slice thickness/slice gap = 240/2.9/0.5 mm, 41 axial slices per volume, 96 × 96 acquisition matrix, repetition time (TR), echo time (TE) TR/TE = 2000/30 msec, acceleration factor R = 2, flip angle = 90°, sampling bandwidth = 250 kHz. To allow the fMRI signal to reach a steady state, three EPI volumes (6 sec) were excluded from data analysis. For each of the three rsfMRI runs, simultaneous physiological pulse oximetry and respiration waveforms were collected (with 50 Hz sampling, using a photoplethysmograph with an infrared emitter placed under the pad of the subject's left index finger and a pneumatic respiration belt, respectively).
To provide an anatomical reference for the fMRI analysis, a T1-weighted magnetization-prepared rapid gradient-echo (MPRAGE) sequence with SENSE was collected with the following parameters: scan time = 4 min 58 sec, FOV = 240 mm, axial slices per slab = 128, slice thickness = 1.2 mm, image matrix = 256 × 256, TR/TE = 5/1.9 msec, acceleration factor R = 2, flip angle = 10°, delay time = 1400 msec, inversion time = 725 msec, sampling bandwidth = 31.2 kHz.
EEG signals were recorded simultaneously with fMRI via a 32-channel MR-compatible EEG system from Brain Products GmbH (Munich, Germany). The EEG cap consisted of 32 channels, including references, arranged according to the international 10–20 system. One electrode was placed on the subject's back for recording the electrocardiogram (ECG) signal. A Brain Products' SyncBox device was used to synchronize the EEG system clock with the 10 MHz MRI scanner clock. EEG acquisition temporal resolution was 0.2 msec (i.e., 16-bit 5 kS/sec sampling), and measurement resolution was 0.1 μV. EEG signals were hardware-filtered throughout the acquisition in the frequency band between 0.016 and 250 Hz.
Pupil size was recorded in arbitrary units at a sampling rate of 250 samp/sec using an MRC eye-tracker system (MRC Systems GmbH, Heidelberg, Germany). Transmission Control Protocol/Internet Protocol (TCP/IP) connection was used to synchronize the eye-tracker device with the MRI machine clock using the MRC System Dynamic-link library. The pupil size was recorded from the left eye. An example of the eye-tracker interface and a 30-sec pupil size recording are provided in Supplementary Figure S1.
Data analysis
Each of the EEG, fMRI, and eye-tracker modalities requires specific preprocessing to reduce noise and artifacts, as well as to recover missing data. After applying preprocessing steps separately for the data within each modality, we combined the clean data from those three modalities. Figure 1 shows a summary of data analysis steps as a function of modality.
FIG. 1.

The data analysis flowchart. Each of the modalities collected in this study required its own preprocessing steps to remove noise and artifacts and to recover missing data. After preprocessing EEG data, three features were extracted from the channels F3, F4, Fz, O1, O2, and Oz EEG data as follows: (1) power spectral density in the alpha band, (2) power spectral density in the beta band, and (3) alpha power ratio. The associations between these features and pupil size were investigated, and the feature with the highest association was selected for inclusion into further analysis. Next, the associations between that feature and the BOLD signal, as well as heart rate, were investigated. The pupil size was used as a regressor to evaluate the relationship with the BOLD signal. We also investigated the association between those three EEG features extracted from all 31 channels and pupil size and heart rate. BOLD, blood-oxygen-level-dependent; EEG, electroencephalography. Color images are available online.
Preprocessing
EEG is highly sensitive to noise and artifacts. To reduce the artifacts and preprocess EEG data, we adopted the pipeline described by Mayeli et al. (2016) using BrainVision Analyzer 2 software (Brain Products GmbH). Imaging artifacts were reduced using the average artifact subtraction (AAS) method (Allen et al., 2000), and EEG signals were downsampled to 250 Hz. Next, zero-phase Shift Butterworth fourth-order (i.e., slope of 24 dB/octave) band-rejection filters (1 Hz bandwidth) were used to remove fMRI slice selection fundamental frequency (20.5 Hz) and its harmonics, vibration noise (26 Hz), and alternating current power line noise (60 Hz). Then, a bandpass filter from 0.1 to 80 Hz (zero-phase Shift Butterworth filters, slope of 48 dB/octave) was applied to remove signals unrelated to brain activity.
Ballistocardiogram (BCG) artifacts were also removed using the AAS (Allen et al., 1998). The cardiac cycles were first automatically detected using the back-ECG electrode via BrainVision Analyzer 2 software and then were manually inspected and adjusted, if required. For each channel, the BCG artifact template was generated using a moving average over 21 cardiac periods and then subtracted from the data.
After reducing BCG artifacts, the Infomax independent component analysis (ICA) was utilized for independent component (IC) decomposition (Bell and Sejnowski, 1995) over the entire data length with exclusion of intervals that were excessive motion affected. ICA was applied to the data from 31 EEG electrodes and yielded on 31 ICs. The topographic map, power spectrum density, time course signal, and energy of ICs were used for detecting and removing artifactual ICs.
For instance, ocular artifacts are identified by strong spatial projection in the prefrontal area, either by exhibiting high loadings at the most anterior regions for eye blinks or showing as an anterior dipole for saccades, as well as high-energy and low-frequency peaks (between 0.5 and 3 Hz) in the frequency domain. The single-channel ICs were identified using their topographic maps. That kind of artifact affects one or two channels without showing any effects on other channels, either because that channel has poor contact during recording or it is one of the channels (e.g., T7, T8, TP9, and TP10) that are more sensitive to jaw and head movement (Zotev et al., 2018). Residual BCG artifacts normally show in a bipolar topographic map with frequency activity in theta band. Finally, muscle artifacts can be identified by high-frequency activity and peaks in the gamma band (30–60 Hz range).
The topographic map examples of each type of artifacts as well as neural activity are shown in Supplementary Figure S2.
After selecting the artifactual ICs for removal, the EEG signal was reconstructed using inverse ICA after selecting ICs related to neural activities.
Pupil size vector includes both missing data due to eye blinks and noise. In preprocessing the pupil size signal, the “fillmissing” command in MATLAB (MathWorks, Inc., Natick, MA) was used first to interpolate missing numeric data. More specifically, a moving median window with a length of twice the largest gap was used. Then, a zero-phase Butterworth band-pass filter (0.01–0.1 Hz) was applied to correct for very slow drifts and high-frequency oscillations, as suggested in previous works (Schneider et al., 2016; Yellin et al., 2015). The data from subjects with more than one-third of missing data were excluded, resulting in 21 runs from 10 subjects (the percentage of missing data from each run and participant is shown in Supplementary Table S1).
Imaging analyses were carried out using the Analysis of Functional NeuroImages (AFNI) software (http://afni.nimh.nih.gov/afni) (Cox, 1996). The afni_proc.py command was used to preprocess the data using the default parameters. The first three volumes were omitted from the analysis to allow the fMRI signal to reach a steady state. The despike option was adopted to replace outlier time points with interpolation. RETROICOR (Glover et al., 2000) and respiration volume per time (RVT) correction (Birn et al., 2008) were applied to remove cardiac- and respiration-induced noise in the BOLD signal. Slice-timing differences were adjusted by aligning to the first slice, and motion correction was applied by aligning all functional volumes to the volume with low-motion determined by the data.
EPI volumes were acquired using the 3dvolreg AFNI program with two-pass registration. The volume with the minimum outlier fraction of the short EPI data set acquired immediately after the high-resolution anatomical (MPRAGE) brain image was used as the registration base. Linear warping was applied to the MNI space and resampled to 2 mm 3 voxels. Data were spatially smoothed (6 mm full width at half maximum) and scaled to have a mean of 100 and range of [0–200]. The outcome was then used as an input for general linear model (GLM) analysis along with the regressor of interest. To control for the nuisance variables, we used the 12 motion parameters (3 shift and 3 rotation parameters with their temporal derivatives) and three principal components of the ventricle signal from the signal time course as covariates in the GLM.
FreeSurfer 5.3 was used to extract white matter and ventricle masks from the anatomical image of an individual subject and then warped them to the normalized fMRI image space. To investigate the effects of physiological noise correction (i.e., RETROICOR and RVT), we repeated the analysis without including those corrections in the preprocessing step.
The heart rate for each individual run and subject was computed using a custom MATLAB script by dividing 60 with the average interval (in seconds) between 2 R-peaks of the ECG. The values were averaged every 4 sec.
Postprocessing
After removing the EEG artifact, the following features were extracted using a recent open-source EEG feature extraction software (Toole and Boylan, 2017) in MATLAB from the EEG data (channels F3, F4, Fz, O1, O2, and Oz) from each subject and each run: (1) power spectral density in alpha band (alpha power); (2) power spectral density in beta band (beta power); and (3) the ratio between alpha power and the power in the combined delta and theta bands (alpha ratio; as suggested in literature for the vigilance index during an eyes-closed resting state). We selected these six EEG channels because previous research has shown an association between those channels' features and vigilance (Knaut et al., 2019; Olbrich et al., 2009), and also because these channels are less vulnerable to artifacts, especially muscle artifacts, than others across the scalp.
Power spectral density (PSD) was estimated via the periodogram method as follows:
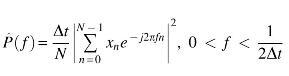
where xn is the EEG time course, and Δt is the sampling interval. After calculating the PSD in each channel, the power in each frequency band was averaged among the six channels of interest.
The value for each of the three EEG features was averaged every 4 sec among the selected channels. Due to the slow pupillary response (Wierda et al., 2012), as well as the missing pupil size data, we selected the 4-sec window to estimate the vigilance level from the eye tracker. Therefore, averaged pupil size was calculated every 4 sec as well, after the aforementioned preprocessing to generate the pupil size vector for all further analyses. Pupil size vector was used as the vigilance stage index (i.e., larger pupil size indicates higher vigilance level). The distribution of pupil size vector and selected EEG features showed a statistically significant deviation from normality (p < 0.05) using the Shapiro–Wilk test. Hence, the nonparametric Spearman's rank correlation coefficient ρ was used to measure the correlations between EEG features and pupil size across time within each run and each subject.
Furthermore, we used a one-sample t-test on the Fisher z-transformed correlation coefficients to investigate the overall positive EEG feature/pupil size correlation among subjects and calculate the effect size. In addition, for each run, after finding the EEG feature mostly associated with pupil size, we investigated the correlation between that EEG feature and heart rate. Again, we used a one-sample t-test on the Fisher z-transformed correlation coefficients to examine the overall positive correlation between those features among subjects (the runs were average for each subject for this analysis) and computed the effect size. The same analysis was carried out with the features extracted from all channels (instead of using only six channels) to confirm the reliability of the EEG feature we selected as the vigilance index.
Next, pupil size and EEG features were applied to fMRI data analysis as separate regressors. Each of these regressors was convolved with a hemodynamic response function and downsampled to 0.5 Hz (to match the TR of 2 sec) if needed. Supplementary Figure S3 represents the steps for the fMRI analysis.
Results
Correlations between EEG features from channels F3, F4, Fz, O1, O2, and Oz (i.e., alpha power, beta power, and the alpha ratio) and pupil size are summarized in Figure 2. Supplementary Figure S4 illustrates the linear regression plots for each participant and each run. We repeated the correlation analyses by extracting EEG features from all channels, and the results are shown in Supplementary Figure S5. The statistical details of correlations between pupil size and EEG features, as well as the one-sample t-test and effect size on the Fisher z-transformed correlation coefficient results, are shown in Table 1.
FIG. 2.

Association between EEG features and pupil size. The correlation between EEG features from frontal (F3, F4, Fz) and occipital (O1, O2, Oz) channels, that is, (A) power spectral density in the alpha band, (B) power spectral density in the beta band (FOBP), and (C) alpha power ratio and pupil size are shown for each run and each subject. The runs with missing data are left empty. The asterisks show significant levels of correlation (corrected for multiple comparisons). FOBP, frontal and occipital beta power. Color images are available online.
Table 1.
The Details of Correlations Between Pupil Size and Electroencephalography Features (Extracted from 6 Selected Channels and All 31 Channels) Among Subjects (for Subjects with More than One Run, the Correlation Coefficients Were Averaged Among Runs, Resulting in One Value for Each Subject)
| Average of correlation coefficient | Standard deviation of correlation coefficient | One-pair t-test on r to z transformed |
Cohen's effect size | |||
|---|---|---|---|---|---|---|
| df | p | t-stat | ||||
| Six selected channels | ||||||
| Alpha power | 0.231 | 0.115 | 9 | 0.001 | 4.739 | 1.499 |
| beta Power | 0.306 | 0.107 | 9 | 2.90e-06 | 10.254 | 3.241 |
| alpha ratio | −0.036 | 0.109 | 9 | 0.338 | −1.01 | −0.319 |
| All 31 channels | ||||||
| Alpha power | 0.233 | 0.155 | 9 | 0.001 | 4.627 | 1.463 |
| Beta power | 0.306 | 0.091 | 9 | 3.80e-06 | 9.922 | 3.136 |
| Alpha ratio | −0.043 | 0.117 | 9 | 0.283 | −1.143 | −0.361 |
The t-test parameters and Cohen's effect size were calculated on the Fisher z-transformed correlation coefficients.
The correlation coefficients in Table 1 show an overall positive correlation between pupil size vector and both alpha power and beta power, which indicates that higher alpha/beta powers represent a larger pupil size (and vigilance level). We further compared the Fisher z-transformed correlation coefficients between alpha power and pupil size, and beta power and pupil size from the selected six EEG channels. The results are as follows: t(18) = −2.162, p = 0.058. The difference between these correlations shows a trend to a significant difference.
Also, the results presented in Figure 2 show that the correlation between pupil size and beta power was not significant for 3 out of 21 runs; however, 9 out of 21 runs were not significant for alpha power association with pupil size. Therefore, we used frontal and occipital beta power (FOBP; as the vigilance level index) as a regressor for the fMRI analysis.
Figure 3 illustrates the raincloud plots comparing the three sets of correlations using 6 EEG channels, as well as 31 channels. The confidence intervals (CI) for the difference of means of the r to z transformed correlation coefficients of pupil size and alpha and beta powers using 1000 sample bootstrapping are 95% CI [−0.032 to 0.183] and 95% CI [−0.040 to 0.186], for having 6 EEG channels and 31 channels, respectively. The bootstrap CI for a difference in mean was done using a freely available online software called StatKey (Morgan et al., 2014).
FIG. 3.
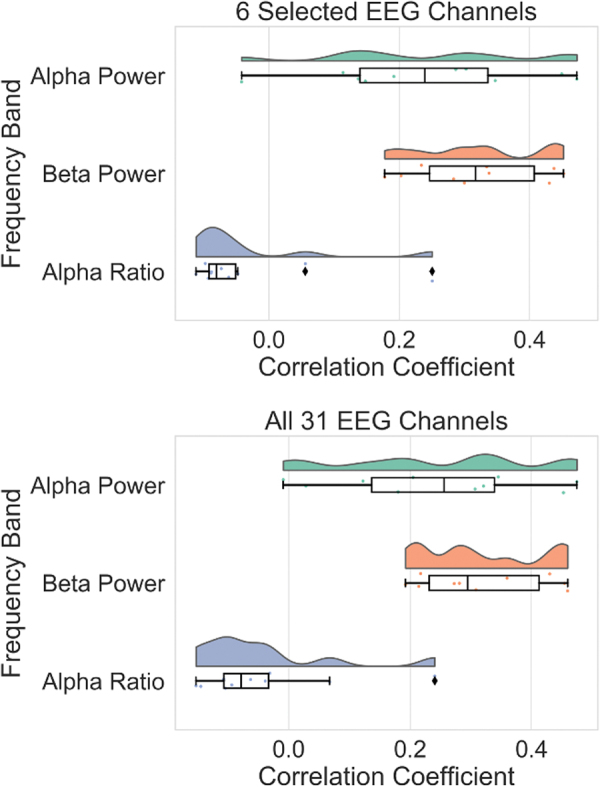
The raincloud plots comparing the three sets of correlations between pupil size and EEG features. The top figure shows the raincloud plot for the r-to-z transformed correlation between pupil size and EEG features using six EEG channels (the runs were average for each subject for this analysis). The bottom plot shows the same analysis using all 31 EEG channels. Color images are available online.
Figure 4 depicts the correlation map between the BOLD signal with correction for physiological noise and FOBP. The analysis was performed for each voxel, and the statistical map was thresholded with voxel-wise p < 0.005 and cluster-size corrected p < 0.05. The cluster-size threshold was evaluated with AFNI's 3dClustSim using an improved spatial autocorrelation function (Cox et al., 2017); a minimum cluster size of 146 voxels was required to have a corrected p ≤ 0.05 while using 2-sided third nearest neighbor clustering (NN3).
FIG. 4.

Power spectral density in FOBP correlation map. The FOBP was used as a regressor in fMRI GLM analysis. The figure shows the cluster survived with sampling at uncorrected p < 0.005 and at cluster-size thresholded with AFNI's 3dClustSim using an improved spatial ACF, with a minimum cluster size of 146. ACF, autocorrelation function; AFNI, Analysis of Functional NeuroImages; fMRI, functional magnetic resonance imaging; GLM, general linear model. Color images are available online.
Table 2 illustrates that higher values of beta power were associated with greater BOLD signal in the precentral gyrus, postcentral gyrus, and insular cortex, as well as temporal gyrus and inferior parietal lobule. Supplementary Figure S6 represents the results without any cluster-size threshold. The results related to the correlation map between BOLD signal without including correction for physiological noise and FOBP are shown in Supplementary Figure S7 and Supplementary Table S2.
Table 2.
Brain Regions Correlated to Power Spectral Density in Frontal and Occipital Beta Power
| Cluster |
|||||
|---|---|---|---|---|---|
| Peak coordinates (Talairach) |
Cluster size (No. of voxels) | ||||
| x | Y | z | t-Score | ||
| Insula (R), claustrum (R), superior temporal gyrus (R), precentral gyrus (R), transverse temporal gyrus (R), postcentral gyrus (R) | 33 | −13 | 12 | 9.416 | 1052 |
| Insula (L), superior temporal gyrus (L), claustrum (L), precentral gyrus (L), postcentral gyrus (L), inferior parietal lobule (L) | −51 | −9 | 18 | 9.719 | 792 |
| Medial frontal gyrus (R), paracentral lobule (R), paracentral lobule (L) | 3 | −23 | 64 | 8.004 | 191 |
| Paracentral gyrus (L), postcentral gyrus (L), inferior parietal lobule (L) | −23 | −39 | 54 | 6.924 | 155 |
Figure 5 illustrates correlations between heart rate and FOBP [one-sample t-test on the Fisher z-transformed correlation coefficient results: t(9) = 4.625, p = 0.001, d = 1.462]. Supplementary Figure S8 illustrates the correlation between heart rate and beta power, including all EEG channels [t(9) = 4.797, p = 9.8e-04, d = 1.517].
FIG. 5.

Association between FOBP and heart rate. The correlations between FOBP and heart rate are shown for each run and each subject. The runs with missing data are left empty. The asterisks show significant levels of the correlation. Color images are available online.
Finally, Figure 6 shows the correlation maps between the BOLD signal with correction for physiological noise and pupil size. Supplementary Figure S9 represents the results without any cluster-size threshold. Table 3 shows the details of the brain regions associated with that regressor, which represents a higher pupil size linked to the lower fronto-occipital BOLD signal. The results for the same analysis without correction for physiological noise are presented in Supplementary Figure S10 and Supplementary Table S3.
FIG. 6.

Pupil size correlation map. Pupil size was used as a regressor in fMRI GLM analysis. The figure shows the clusters survived with sampling at uncorrected p < 0.005 and at cluster-size thresholded with AFNI's 3dClustSim using an improved spatial ACF, with a minimum cluster size of 148. Color images are available online.
Table 3.
Brain Regions Correlated to Pupil Size
| Cluster |
|||||
|---|---|---|---|---|---|
| Peak coordinates (Talairach) |
Cluster size (No. of voxels) | ||||
| X | y | z | t-Score | ||
| Middle frontal gyrus (R), precentral gyrus (R), postcentral gyrus (R), middle cingulate gyrus, paracentral gyrus, medial frontal gyrus | 25 | −27 | 56 | −12.903 | 3494 |
| Declive (R), fusiform gyrus (R), inferior occipital gyrus (R), middle occipital gyrus (R), precuneus (R), lingual gyrus (R) | 35 | −85 | −2 | −10.625 | 684 |
| Superior temporal gyrus (L), postcentral gyrus (L) | −53 | −35 | 10 | −13.792 | 299 |
| Precentral gyrus (L) | −43 | −13 | 52 | −9.921 | 262 |
| Parahippocampal gyrus (L), fusiform gyrus (L), inferior occipital gyrus (L), middle occipital gyrus (L), declive (L) | −33 | −55 | −4 | −7.54 | 205 |
| Cuneus (L), precuneus (L), lingual gyrus (L) | −9 | −79 | 34 | −7.082 | 185 |
Discussion
This study aimed to determine whether EEG features could be used as objective markers of vigilance in healthy human subjects during eyes-open rsfMRI experiments. Three main findings regarding this investigation are as follows: first, frontal (F3, F4, and Fz) and occipital (O1, O2, and Oz) beta power (i.e., FOBP) showed the highest correlation with pupil size; second, FOBP correlated with several brain regions that have been implicated in modulating vigilance; third, FOBP also was positively correlated with heart rate. Taken together, these findings support the conclusion that FOBP is an objective and robust measure of vigilance in healthy human subjects.
As shown in Figure 2 and Table 1, FOBP has the highest correlation with the pupil size among different EEG features. An earlier simultaneous EEG-fMRI study (Laufs et al., 2003) suggested that alpha rhythm signal was associated with “inattention” during rest, while beta rhythms were posited to index spontaneous cognitive operations during conscious rest. Another study is required to generate a template for vigilance estimation using this metric to produce an fMRI-based template for estimating the subject's vigilance. For the rest of our analysis, we considered FOBP as the vigilance index during our eyes-open resting state.
Although we tested the correlation between the ratio of the PSD in the alpha band and the power in the combined delta and theta band (the most common measure of vigilance during eyes-closed resting state) and pupil size, that association was not significant, which could indicate the difference between EEG vigilance measures in eyes-open and eyes-closed conditions. The variability between findings in eyes-closed and eyes-open EEG vigilance measures was reported in previous studies. For instance, Barry et al. (2007) found a significant correlation between mean alpha level across all channels and skin conductance levels as an index for vigilance across the eyes-closed condition. However, no correlations between skin conductance levels and alpha power were reported in that study during their eyes-open condition, and so, it is possible that the alpha ratio-arousal association only holds for eyes-closed data.
A very recent simultaneous EEG-fMRI study (Falahpour et al., 2018) used the ratio of power in the alpha band over the power in delta and theta band as the vigilance index for both eyes-open and eyes-closed conditions. Their results suggested a significant difference between the vigilance index BOLD correlation map in the thalamus and default mode network (DMN) among eyes-open and eyes-closed conditions (Falahpour et al., 2018). As noted in Chang et al. (2016), one of the reasons for lower association between alpha power/ratio and vigilance is the presence of unconstrained eye open/closure, which could interfere with the interpretation of alpha power fluctuations while we asked the subjects to try to keep their eyes open.
Here, with utilizing the eye tracker for measuring the subject's vigilance, we showed that beta power is a better index compared with alpha power for the vigilance level during eyes-open resting state.
After finding EEG features with the highest correlation with pupil size, that feature served as a regressor for fMRI analysis, as illustrated in Figure 4. The correlation map for FOBP shows positive correlations with several brain regions, including the bilateral insula, inferior parietal lobule, and supplementary motor area. Interestingly, these brain regions have been reported in previous studies investigating the correlation maps of EEG vigilance indices during eyes-closed rsfMRI (Falahpour et al., 2018; Olbrich et al., 2009; Sadaghiani et al., 2010). Furthermore, these brain regions are all parts of the anticorrelated network (De Havas et al., 2012; Fox et al., 2005), which have shown anticorrelated activation with the DMN both during the rsfMRI and task.
A previous study (Yuan et al., 2013) showed that using RVT and RETROICOR for physiological correction has fewer effects on EEG (alpha power) correlation map during eyes-open compared with eyes-closed rsfMRI. To investigate the effects of physiological noise correction, we showed the FOBP and pupil correlation maps in the supplement without including physiological noise correction.
The results presented in Table 2 and Supplementary Table S2 show that the same brain regions were found correlated with FOBP regardless of physiological noise correction. It is worth noting, however, that without using physiological noise correction, the BOLD signal in the cerebellum (e.g., declive and culmen) is correlated with FOBP. This is in line with the results presented in Yuan et al. (2013), which found that the RETRICOR and RVT correction has a minimum effect on the EEG correlation map with the BOLD signal during eyes-open rsfMRI. Also, the BOLD activity (after physiological noise correction) from several brain regions found correlated with pupil size was repeated when we do not use the noise correction.
Furthermore, to validate our findings, we looked at the correlation between the selected EEG vigilance features and heart rate. Previous studies such as Olbrich et al. (2009) showed that higher vigilance was associated with a higher heart rate. Figure 5 represents such a positive correlation. Earlier, we found a positive correlation between pupil size and beta power, and that feature has a positive correlation with heart rate. Therefore, heart rates increased with a higher vigilance level.
In addition, to further investigate the association between EEG beta power and vigilance, we repeated the analysis with the extraction of EEG features from all 31 channels (instead of 6 channels). As Table 1 and Supplementary Figure S5 show, the association between pupil size and both alpha and beta powers, as well as the correlation between beta power and heart rate, is still a significantly higher zero using all 31 EEG channels.
However, the results from 6 and all 31 channels are slightly more varied for EEG features related to the beta band compared with the alpha band (e.g., 5 runs out of 21 do not show significant correlation between pupil size and beta power for 31 channels, compared with 3 runs for 6 channels), and that could be because of the residual muscle and imaging artifacts in the beta band, especially in edge electrodes (e.g., TP9 and TP10). We specifically selected those six channels first because they have been used in previous studies for investigating the vigilance level (Hegerl et al., 2008; Olbrich et al., 2009) and second because they are less vulnerable to noise and artifacts.
Finally, pupil size served as a regressor for fMRI. We found negative correlations in the activity between pupil size and visual and sensorimotor cortices of the brain, which is in a great agreement with previous simultaneously eye-tracker-fMRI studies (DiNuzzo et al., 2019; Murphy et al., 2014; Schneider et al., 2016; Yellin et al., 2015). However, there were some variabilities between previous studies regarding the brain regions positively correlated with pupil size. For instance, Yellin et al. (2015) found a positive correlation between pupil size and DMN, and Schneider et al. (2016) found that the thalamus, caudate nucleus, and cerebellum are positively associated with pupil size. Those associations between the BOLD signal and pupil dimension were replicated neither in other studies nor in ours.
It should be noted that in 3 runs out of 21 (i.e., ∼14%), we did not see a significant correlation between pupil size and FOBP. Such variability was expected due to two possible reasons. First, the low vigilance fluctuation within a given scan can reduce the brain activity modulation (Falahpour et al., 2018) and change the EEG power. Therefore, we might see less association between pupil size and EEG beta power. For instance, for one of the runs that we did not observe a significant correlation between FOBP and pupil size (Subject 7 Rest1), the missing pupil size percentage is <4%, which could indicate the low vigilance fluctuation. Another possible explanation for this variability is that, although we carefully preprocessed EEG and eye-tracker data, however, there might be still some residual artifact/noise on each of those data sets.
Furthermore, our initial goal was to investigate the subjects' vigilance variability among different runs. However, we could use all three rsfMRI runs for only three participants, due to missing pupil size information for some of the resting-state runs for the other individuals. Therefore, we did not have enough statistical power to provide such an investigation.
It should be pointed out that, although an eye tracker was used as an indirect measure of vigilance during eyes-open resting state, there is no guarantee that participants will keep their eyes open during the entire scan time. Therefore, it will be necessary to test if FOBP could serve as an appropriate EEG vigilance measure during the eyes-closed resting state. Since an eye-tracker device is not a helpful tool for eyes-closed scans. Instead, skin conductivity and heart rate parameters are suggested as possible indicators.
Conclusion
Simultaneous EEG-fMRI-eye-tracker experiments have been suggested in an effort to determine, verify, and measure participant arousal/vigilance level during rsfMRI. However, such an experimental setup requires specific, and often costly, hardware and software. Furthermore, the analysis of data within each of these modalities requires an expert workforce. Therefore, running this experiment is not feasible for most research centers. In this study, we designed the first multimodal EEG-rsfMRI-eye-tracker experiment in human participants (to the best of our knowledge) to find EEG vigilance metrics during eyes-open resting-state fMRI.
Our results revealed an association between FOBP and degree of vigilance during an eyes-open resting state. This EEG measure could be easier to determine during simultaneous EEG-fMRI and even provide a real-time measure of subject vigilance in resting-state fMRI. We validated the results using simultaneously recorded heart rate and fMRI. Interestingly, independently verified heart rate changes can also provide an easy-to-determine measure of vigilance during rsfMRI.
Availability of Data
The data that support the findings of this study are available from the corresponding author upon reasonable request.
Supplementary Material
Authors' Contributions
J.B. conceived the study; J.B. and H.R. assigned the study to A.M.; A.M. and J.B. developed the study design and J.B. acquired the financial support for the project; A.M., O.A.Z., M.M., S.F., M.G., V.Z., R.P., and J.B. developed and combined the data acquisition infrastructure for conducting simultaneous multimodal data recording; A.M., O.A.Z., M.M., and J.B. developed the data analysis pipelines; A.M., O.A.Z., and R.P. performed the experiments; A.M., O.A.Z., and M.M. analyzed the data; A.M., J.B., and J.L.S. wrote the original article draft; O.A.Z., M.M., V.Z., S.F., M.G., M.P.P., and H.R. provided guidance on analyses and critical review of the article; all authors provided comments on the article.
Author Disclosure Statement
The authors declare no competing financial interests.
Funding Information
This work has been supported by the Laureate Institute for Brain Research, the William K. Warren Foundation, and by the National Institute of General Medical Sciences, National Institutes of Health Award 1P20GM121312. The funding sources have no influence on the study design, data collection, analysis, data interpretations, in the writing of the article, and the decision to submit the article for publication.
Supplementary Material
References
- Allen PJ, Josephs O, Turner R. 2000. A method for removing imaging artifact from continuous EEG recorded during functional MRI. Neuroimage 12:230–239 [DOI] [PubMed] [Google Scholar]
- Allen PJ, Polizzi G, Krakow K, Fish DR, Lemieux L. 1998. Identification of EEG events in the MR scanner: the problem of pulse artifact and a method for its subtraction. Neuroimage 8:229–239 [DOI] [PubMed] [Google Scholar]
- Barry RJ, Clarke AR, Johnstone SJ, Magee CA, Rushby JA. 2007. EEG differences between eyes-closed and eyes-open resting conditions. Clin Neurophysiol 118:2765–2773 [DOI] [PubMed] [Google Scholar]
- Bell AJ, Sejnowski TJ. 1995. An information-maximization approach to blind separation and blind deconvolution. Neural Comput 7:1129–1159 [DOI] [PubMed] [Google Scholar]
- Belyavin A, Wright NA. 1987. Changes in electrical activity of the brain with vigilance. Electroencephalogr Clin Neurophysiol 66:137–144 [DOI] [PubMed] [Google Scholar]
- Berry RB, Brooks R, Gamaldo CE, Harding SM, Marcus CL, Vaughn BV. 2012. The AASM Manual for the Scoring of Sleep and Associated Events. Rules, Terminology and Technical Specifications. Darien, IL: American Academy of Sleep Medicine, p. 176 [Google Scholar]
- Birn RM, Smith MA, Jones TB, Bandettini PA. 2008. The respiration response function: the temporal dynamics of fMRI signal fluctuations related to changes in respiration. Neuroimage 40:644–654 [DOI] [PMC free article] [PubMed] [Google Scholar]
- Chang C, Leopold DA, Schölvinck ML, Mandelkow H, Picchioni D, Liu X, et al. 2016. Tracking brain arousal fluctuations with fMRI. Proc Natl Acad Sci U S A 113:4518–4523 [DOI] [PMC free article] [PubMed] [Google Scholar]
- Cox RW. 1996. AFNI: software for analysis and visualization of functional magnetic resonance neuroimages. Comput Biomed Res 29:162–173 [DOI] [PubMed] [Google Scholar]
- Cox RW, Chen G, Glen DR, Reynolds RC, Taylor PA. 2017. FMRI clustering in AFNI: false-positive rates redux. Brain Connect 7:152–171 [DOI] [PMC free article] [PubMed] [Google Scholar]
- Davies DR, Parasuraman R. 1982. The Psychology of Vigilance. London, UK: Academic Press [Google Scholar]
- De Havas JA, Parimal S, Soon CS, Chee MW. 2012. Sleep deprivation reduces default mode network connectivity and anti-correlation during rest and task performance. Neuroimage 59:1745–1751 [DOI] [PubMed] [Google Scholar]
- DiNuzzo M, Mascali D, Moraschi M, Bussu G, Maugeri L, Mangini F, et al. 2019. Brain networks underlying eye's pupil dynamics. Front Neurosci 13:965. [DOI] [PMC free article] [PubMed] [Google Scholar]
- Falahpour M, Chang C, Wong CW, Liu TT. 2018. Template-based prediction of vigilance fluctuations in resting-state fMRI. Neuroimage 174:317–327 [DOI] [PMC free article] [PubMed] [Google Scholar]
- Ferrarelli F, Kaskie R, Laxminarayan S, Ramakrishnan S, Reifman J, Germain A. 2019. An increase in sleep slow waves predicts better working memory performance in healthy individuals. Neuroimage 191:1–9 [DOI] [PubMed] [Google Scholar]
- First MB, Spitzer RL, Gibbon M, Williams JB. 2002. Structured clinical interview for DSM-IV-TR axis I disorders, research version, patient edition (SCID-I/P). New York, USA: New York State Psychiatric Institute [Google Scholar]
- Fox MD, Greicius M. 2010. Clinical applications of resting state functional connectivity. Front Syst Neurosci 4:19. [DOI] [PMC free article] [PubMed] [Google Scholar]
- Fox MD, Snyder AZ, Vincent JL, Corbetta M, Van Essen DC, Raichle ME. 2005. The human brain is intrinsically organized into dynamic, anticorrelated functional networks. Proc Natl Acad Sci U S A 102:9673–9678 [DOI] [PMC free article] [PubMed] [Google Scholar]
- Foxe JJ, Morie KP, Laud PJ, Rowson MJ, De Bruin EA, Kelly SP. 2012. Assessing the effects of caffeine and theanine on the maintenance of vigilance during a sustained attention task. Neuropharmacology 62:2320–2327 [DOI] [PubMed] [Google Scholar]
- Gilzenrat MS, Nieuwenhuis S, Jepma M, Cohen JD. 2010. Pupil diameter tracks changes in control state predicted by the adaptive gain theory of locus coeruleus function. Cogn Affect Behav Neurosci 10:252–269 [DOI] [PMC free article] [PubMed] [Google Scholar]
- Glover GH, Li TQ, Ress D. 2000. Image-based method for retrospective correction of physiological motion effects in fMRI: RETROICOR. Magn Reson Med 44:162–167 [DOI] [PubMed] [Google Scholar]
- Hegerl U, Stein M, Mulert C, Mergl R, Olbrich S, Dichgans E, et al. 2008. EEG-vigilance differences between patients with borderline personality disorder, patients with obsessive-compulsive disorder and healthy controls. Eur Arch Psychiatry Clin Neurosci 258:137–143 [DOI] [PubMed] [Google Scholar]
- Henson DB, Emuh T. 2010. Monitoring vigilance during perimetry by using pupillography. Invest Ophthalmol Vis Sci 51:3540–3543 [DOI] [PubMed] [Google Scholar]
- Horovitz SG, Fukunaga M, de Zwart JA, van Gelderen P, Fulton SC, Balkin TJ, Duyn JH. 2008. Low frequency BOLD fluctuations during resting wakefulness and light sleep: a simultaneous EEG-fMRI study. Hum Brain Mapp 29:671–682 [DOI] [PMC free article] [PubMed] [Google Scholar]
- Knaut P, von Wegner F, Morzelewski A, Laufs H. 2019. EEG-correlated fMRI of human alpha (de-) synchronization. Clin Neurophysiol 130:1375–1386 [DOI] [PubMed] [Google Scholar]
- Korf EM, Mölle M, Born J, Ngo HVV. 2017. Blindfolding during wakefulness causes decrease in sleep slow wave activity. Physiol Rep 5:e13239. [DOI] [PMC free article] [PubMed] [Google Scholar]
- Laufs H, Krakow K, Sterzer P, Eger E, Beyerle A, Salek-Haddadi A, Kleinschmidt A. 2003. Electroencephalographic signatures of attentional and cognitive default modes in spontaneous brain activity fluctuations at rest. Proc Natl Acad Sci U S A 100:11053–11058 [DOI] [PMC free article] [PubMed] [Google Scholar]
- Lee MH, Smyser CD, Shimony JS. 2013. Resting-state fMRI: a review of methods and clinical applications. Am J Neuroradiol 34:1866–1872 [DOI] [PMC free article] [PubMed] [Google Scholar]
- Lowenstein O, Feinberg R, Loewenfeld IE. 1963. Pupillary movements during acute and chronic fatigue: a new test for the objective evaluation of tiredness. Invest Ophthalmol Vis Sci 2:138–157 [Google Scholar]
- Makeig S, Inlow M. 1993. Lapse in alertness: coherence of fluctuations in performance and EEG spectrum. Electroencephalogr Clin Neurophysiol 86:23–35 [DOI] [PubMed] [Google Scholar]
- Mayeli A, Zotev V, Refai H, Bodurka J. 2016. Real-time EEG artifact correction during fMRI using ICA. J Neurosci Methods 274:27–37 [DOI] [PubMed] [Google Scholar]
- McLaren JW, Erie JC, Brubaker RF. 1992. Computerized analysis of pupillograms in studies of alertness. Invest Ophthalmol Vis Sci 33:671–676 [PubMed] [Google Scholar]
- Mogg K, McNamara J, Powys M, Rawlinson H, Seiffer A, Bradley BP. 2000. Selective attention to threat: a test of two cognitive models of anxiety. Cogn Emot 14:375–399 [Google Scholar]
- Morgan KL, Lock RH, Lock PF, Lock EF, Lock DF. StatKey: online tools for bootstrap intervals and randomization tests. Sustainability in statistics education. In Proceedings of the 9th International Conference on Teaching Statistics, ICOTS9, Arizona, USA, 2014
- Murphy PR, O'Connell RG, O'Sullivan M, Robertson IH, Balsters JH. 2014. Pupil diameter covaries with BOLD activity in human locus coeruleus. Hum Brain Mapp 35:4140–4154 [DOI] [PMC free article] [PubMed] [Google Scholar]
- Niazy RK, Beckmann CF, Iannetti GD, Brady JM, Smith SM. 2005. Removal of FMRI environment artifacts from EEG data using optimal basis sets. Neuroimage 28:720–737 [DOI] [PubMed] [Google Scholar]
- Oken BS, Salinsky MC, Elsas S. 2006. Vigilance, alertness, or sustained attention: physiological basis and measurement. Clin Neurophysiol 117:1885–1901 [DOI] [PMC free article] [PubMed] [Google Scholar]
- Olbrich S, Mulert C, Karch S, Trenner M, Leicht G, Pogarell O, Hegerl U. 2009. EEG-vigilance and BOLD effect during simultaneous EEG/fMRI measurement. Neuroimage 45:319–332 [DOI] [PubMed] [Google Scholar]
- Patriat R, Molloy EK, Meier TB, Kirk GR, Nair VA, Meyerand ME, et al. 2013. The effect of resting condition on resting-state fMRI reliability and consistency: a comparison between resting with eyes open, closed, and fixated. Neuroimage 78:463–473 [DOI] [PMC free article] [PubMed] [Google Scholar]
- Posner MI. 2008. Measuring alertness. Ann N Y Acad Sci 1129:193–199 [DOI] [PubMed] [Google Scholar]
- Pruessmann KP, Weiger M, Scheidegger MB, Boesiger P. 1999. SENSE: sensitivity encoding for fast MRI. Magn Reson Med 42:952–962 [PubMed] [Google Scholar]
- Sadaghiani S, Scheeringa R, Lehongre K, Morillon B, Giraud A-L, Kleinschmidt A. 2010. Intrinsic connectivity networks, alpha oscillations, and tonic alertness: a simultaneous electroencephalography/functional magnetic resonance imaging study. J Neurosci 30:10243–10250 [DOI] [PMC free article] [PubMed] [Google Scholar]
- Sander C, Hensch T, Wittekind DA, Boettger D, Hegerl U. 2015. Assessment of wakefulness and brain arousal regulation in psychiatric research. Neuropsychobiology 72:195–205 [DOI] [PubMed] [Google Scholar]
- Schneider M, Hathway P, Leuchs L, Sämann PG, Czisch M, Spoormaker VI. 2016. Spontaneous pupil dilations during the resting state are associated with activation of the salience network. Neuroimage 139:189–201 [DOI] [PubMed] [Google Scholar]
- Smitha K, Akhil Raja K, Arun K, Rajesh P, Thomas B, Kapilamoorthy T, Kesavadas C. 2017. Resting state fMRI: a review on methods in resting state connectivity analysis and resting state networks. Neuroradiol J 30:305–317 [DOI] [PMC free article] [PubMed] [Google Scholar]
- Toole JM, Boylan GB. 2017. NEURAL: quantitative features for newborn EEG using Matlab. arXiv preprint arXiv:1704.05694
- Wierda SM, van Rijn H, Taatgen NA, Martens S. 2012. Pupil dilation deconvolution reveals the dynamics of attention at high temporal resolution. Proc Natl Acad Sci U S A 109:8456–8460 [DOI] [PMC free article] [PubMed] [Google Scholar]
- Wong CW, Olafsson V, Tal O, Liu TT. 2013. The amplitude of the resting-state fMRI global signal is related to EEG vigilance measures. Neuroimage 83:983–990 [DOI] [PMC free article] [PubMed] [Google Scholar]
- Yellin D, Berkovich-Ohana A, Malach R. 2015. Coupling between pupil fluctuations and resting-state fMRI uncovers a slow build-up of antagonistic responses in the human cortex. Neuroimage 106:414–427 [DOI] [PubMed] [Google Scholar]
- Yuan H, Zotev V, Phillips R, Bodurka J. 2013. Correlated slow fluctuations in respiration, EEG, and BOLD fMRI. Neuroimage 79:81–93 [DOI] [PubMed] [Google Scholar]
- Zotev V, Misaki M, Phillips R, Wong CK, Bodurka J. 2018. Real-time fMRI neurofeedback of the mediodorsal and anterior thalamus enhances correlation between thalamic BOLD activity and alpha EEG rhythm. Hum Brain Mapp 39:1024–1042 [DOI] [PMC free article] [PubMed] [Google Scholar]
- Zou Q, Long X, Zuo X, Yan C, Zhu C, Yang Y, et al. 2009. Functional connectivity between the thalamus and visual cortex under eyes closed and eyes open conditions: a resting-state fMRI study. Hum Brain Mapp 30:3066–3078 [DOI] [PMC free article] [PubMed] [Google Scholar]
- Zou Q, Miao X, Liu D, Wang DJ, Zhuo Y, Gao J-H. 2015a. Reliability comparison of spontaneous brain activities between BOLD and CBF contrasts in eyes-open and eyes-closed resting states. Neuroimage 121:91–105 [DOI] [PubMed] [Google Scholar]
- Zou Q, Yuan B-K, Gu H, Liu D, Wang DJ, Gao J-H, et al. 2015b. Detecting static and dynamic differences between eyes-closed and eyes-open resting states using ASL and BOLD fMRI. PLoS One 10:e0121757. [DOI] [PMC free article] [PubMed] [Google Scholar]
Associated Data
This section collects any data citations, data availability statements, or supplementary materials included in this article.
Supplementary Materials
Data Availability Statement
The data that support the findings of this study are available from the corresponding author upon reasonable request.