

Summary
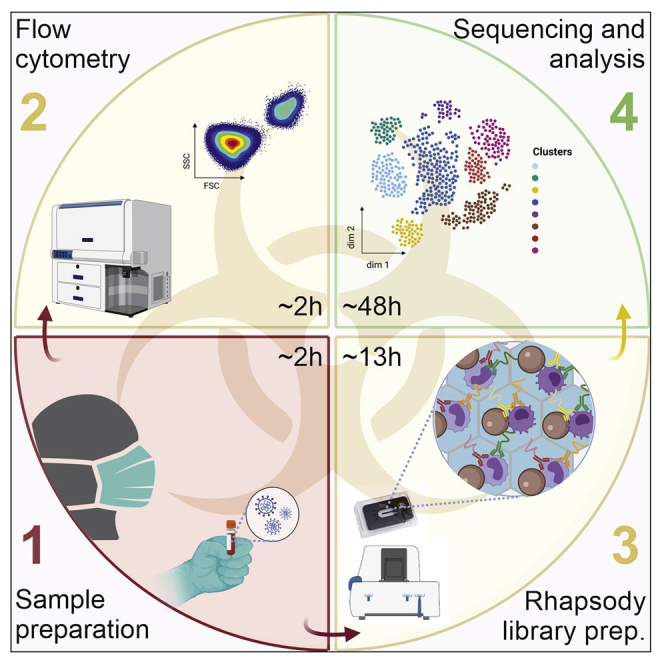
In December 2019, a new coronavirus, SARS-CoV-2, which causes the respiratory illness that led to the COVID-19 pandemic, was reported. In the face of such a new pathogen, special precautions must be taken to examine potentially infectious materials due to the lack of knowledge on disease transmissibility, infectivity, and molecular pathogenicity. Here, we present a complete and safe workflow for performing scRNA-seq experiments on blood samples of infected patients from cell isolation to data analysis using the micro-well based BD Rhapsody platform.
For complete information on the use and execution of this protocol, please refer to Schulte-Schrepping et al. (2020).
Subject Areas: Bioinformatics, Sequence analysis, Flow cytometry/mass cytometry, Clinical protocol, Sequencing, RNA-seq, Immunology, Gene expression, Antibody, Proteomics
Graphical Abstract
Highlights
-
•
Complete, safe protocol for handling potentially infectious blood samples for scRNA-seq
-
•
scRNA-seq application including sample multiplexing and AbSeq protein quantification
-
•
Guidelines for flow cytometry analyses of potentially infectious blood samples
-
•
Recommendations and code for processing and analysis of multiplexed scRNA-seq data
In December 2019, a new coronavirus, SARS-CoV-2, which causes the respiratory illness that led to the COVID-19 pandemic, was reported. In the face of such a new pathogen, special precautions must be taken to examine potentially infectious materials due to the lack of knowledge on disease transmissibility, infectivity, and molecular pathogenicity. Here, we present a complete and safe workflow for performing scRNA-seq experiments on blood samples of infected patients from cell isolation to data analysis using the micro-well based BD Rhapsody platform.
Before you begin
Study subject details and written informed consent
The original study following this protocol, Schulte-Schrepping et al. (2020), was approved by the Institutional Review board of the University Hospital Bonn (073/19 and 134/20). After providing written informed consent, control donors and COVID-19 patients were included in the study. In patients who were not able to consent at the time of study enrollment, consent was obtained after recovery.
Prepare working area
This protocol must be performed in a Biosafety level 2 laboratory. The initial part of the protocol must be done in a laminar flow hood and special precautions must be taken to avoid any potential risk working with samples from COVID-19 patients. It is important to realize that as soon as samples from COVID-19 patients are handled under the hood everything is considered potentially contaminated and should be treated as such. In order to minimize handling of potentially contaminated materials outside of the hood it is critical to organize the working area (Figure 1) and disinfect both hands and materials with Sterillium and Terralin respectively before taking them out of the hood.
Figure 1.

Working area
Prepare cell culture hood and materials
Refer to “Materials and equipment” for the list of materials to be prepared before the experiment.
Prepare solutions
Refer to “Materials and equipment” for the list of buffers and solutions to be prepared before the experiment. Prepare all necessary buffers and working dilutions in advance to avoid possible contaminations of the stock solutions.
General precautions
Up to the cell lyses the samples are considered infected and potentially infectious. Therefore, special precautions need to be taken when steps must be performed outside of the laminar flow hood. In this section we present how to safely perform cell counting and centrifugation steps.
-
1.Spinning samples
-
a.Have a centrifuge bucket and lid ready in the hoodNote: Everything inside the bucket is possibly contaminated. Do not open it outside of the hood. Leave the balance bucket outside the hood to avoid contaminations.
-
b.Close your tube and place it in the centrifuge bucket, close the lid
-
c.Disinfect your hands with Sterillium and wipe the outside of the bucket with Terralin PAA
-
d.You can now spin outside the hood
-
e.Bring closed bucket back under the hood for subsequent sample processing
-
a.
-
2.Counting cells
-
a.Prepare Eppendorf tubes with ready to use Trypan blue solution (0.4%) according to the desired ratio (1:10) outside of the hood beforehand and place them in the hood
-
b.Mix the cell sample with the Trypan blue solution (0.4%) according to the chosen ratio (1:10) under the cell culture hood
-
c.Load cell suspension on a single-use counting chamber
-
d.Place the counting chambers in the 4-well dish
-
e.Close the 4-well dish with its lid and seal the dish with tape (Figure 2)
-
f.Disinfect your hands with Sterillium and wipe the plate with Terralin PAA
-
g.You can now count your cells outside hoodNote: Do not take the counting chamber out of the plate at any time outside of the hood. The cell counting procedure at the microscope can be performed leaving the counting chamber inside the plate (Figure 3).
-
h.After cell counting, bring back the plate under the hood
-
a.
-
3.Clean up
-
a.Disinfect all materials that must be moved out of the hood with Terralin PAA before discarding them
-
b.Prepare a decontamination bath with Terralin PAA for decontaminating the centrifuge buckets and lids for at least 10 min
 CRITICAL: Open bucket under water in the decontamination bath so that the Terralin PAA covers all surfaces.
 -
c.Discard the liquid waste flask in a labeled autoclave bag and close the bag properly for autoclaving
-
d.Leave the 2 liter Terralin PAA cylinder flask with the used serological pipettes under the hood for 24 h. After decontamination, the pipettes can be discarded in a bag for autoclaving and the Terralin PAA can be discarded safely into a sink
-
a.
Figure 2.

Counting chamber in the 4-well dish
Figure 3.

Microscope setup for cell counting
Key resources table
| REAGENT or RESOURCE | SOURCE | IDENTIFIER |
|---|---|---|
| Antibodies | ||
| HLA-DR BV421 (L243) | BioLegend | Cat# 307635; RRID:AB_10897449 |
| CD4 BV510 (OKT4) | BioLegend | Cat# 317444; RRID:AB_2561866 |
| CD16 BV605 (3G8) | BioLegend | Cat# 302039; RRID:AB_2561354 |
| CD45 BV711 (HI30) | BioLegend | Cat# 304050; RRID:AB_2563466 |
| CD8 BV785 (SK1) | BioLegend | Cat# 344740; RRID:AB_2566202 |
| CD66b FITC (G10F5) | BioLegend | Cat# 305104; RRID:AB_314496 |
| CD14 PerCp-Cy5.5 (MϕP9) | Becton Dickinson | Cat# 562692; RRID:AB_2737726 |
| CD56 PE (MY31) | Becton Dickinson | Cat# 345810; RRID:AB_396511 |
| CD3 PE/Dazzle (UCHT1) | BioLegend | Cat# 300450; RRID:AB_2563618 |
| CD11c PE/Cy5 (B-ly6) | Becton Dickinson | Cat# 551077; RRID:AB_394034 |
| Siglec8 PE/Cy7 (7C9) | BioLegend | Cat# 347112; RRID:AB_2629720 |
| CD203c APC (NP4D6) | BioLegend | Cat# 324609; RRID:AB_2099774 |
| CD1c AlexaFluor700 (L161) | BioLegend | Cat# 331530; RRID:AB_2563657 |
| CD19 APC/Fire 750 (HIB19) | BioLegend | Cat# 302258; RRID:AB_2629691 |
| Chemicals, peptides, and recombinant proteins | ||
| BD Horizon brilliant stain buffer | Becton Dickinson | Cat# 563794 |
| RBC lysis buffer 10× | BioLegend | Cat# 420301 |
| Trypan blue | Invitrogen | Cat# T10282 |
| Pierce 16% formaldehyde (w/v), methanol-free | Thermo Fisher | Cat# 28908 |
| RPMI 1640 medium | Gibco | Cat# 11875093 |
| Fetal bovine serum | PAN Biotec | Cat# 3302 |
| Pancoll human, density: 1.077 g/mL | Pan Biotech | Cat# P04-601000 |
| Dulbecco's phosphate buffered saline, MO | Sigma-Aldrich | Cat# D8537 |
| FcR blocking reagent, human | Miltenyi | Cat# 130-059-901 |
| Nuclease-free water | Invitrogen | Cat# AM9937 |
| Sterrilium | PAUL HARTMANN | Cat# 9800081 |
| Terralin PAA 160 mL (2 × 80 mL) | Schülke | Cat# 126203 |
| Critical commercial assays | ||
| Human single-cell multiplexing kit | Becton Dickinson | Cat# 633781 |
| SPRIselect reagent | Beckman Coulter | Cat# B23318 |
| LIVE/DEAD fixable yellow dead cell stain kit, for 405 nm excitation | Invitrogen | Cat# L34959 |
| BD Rhapsody WTA amplification kit | Becton Dickinson | Cat# 633801 |
| BD Rhapsody cartridge kit | Becton Dickinson | Cat# 633733 |
| BD cartridge reagent kit | Becton Dickinson | Cat# 633731 |
| BD Rhapsody cDNA kit | Becton Dickinson | Cat# 633773 |
| High sensitivity D5000 ScreenTape | Agilent | Cat# 5067-5592 |
| Qubit dsDNA HS assay kit | Thermo Fisher | Cat# Q32854 |
| NovaSeq 6000 S1 reagent kit (100 cycle) | Illumina | Cat# 200012865 |
| NovaSeq 6000 S2 reagent kit (100 cycle) | Illumina | Cat# 20012862 |
| NovaSeq 6000 S2 reagent kit (200 cycles) | Illumina | Cat# 20040326 |
| Deposited data | ||
| scRNA-seq raw data | Schulte Schrepping et al., 2020 | EGAS00001004571 |
| Processed scRNA-seq count data and code | Schulte Schrepping et al., 2020 | https://beta.fastgenomics.org/p/schulte-schrepping_covid19 |
| Software and algorithms | ||
| Bcl2fastq2 | Illumina | v2.20 |
| STAR | Dobin et al., 2013 | v2.6.1b |
| Cutadapt | Martin, 2011 | v1.16 |
| Dropseq-tools | https://github.com/broadinstitute/Drop-seq/ | v2.0.0 |
| Picard | https://github.com/broadinstitute/picard | v2.23.7 |
| R | www.cran.r-project.org | v3.6.2 |
| Seurat (R package) | Butler et al., 2018; Stuart et al., 2019 | v3.1.2 (CRAN) |
| Biological samples | ||
| Blood samples from COVID-19 patients | University Hospital Bonn (for details see Schulte Schrepping et al., 2020) | N/A |
| Other | ||
| Falcon tube (50 mL) | Corning | Cat# CLS430290-500EA |
| Falcon tube (15 mL) | Corning | Cat# CLS430053-500EA |
| Improved Neubauer hemocytometer | INCYTO | Cat# DHC-N01-5 |
| Cryovials | Sarstedt | Cat# 72.379.002 |
| 4-well dish | Thermo Fisher Scientific | Cat# 267061 |
| Serological pipettes (5, 10, 25 mL) | Santa Cruz | Cat# sc-200283 sc-200281, sc-200283 |
| Thermo Scientific Megafuge 40R with TX-1000 rotor | Thermo Fisher Scientific | N/A |
| Slide coat TX-1000 buckets with TX-1000 ClickSeal biocontainment lids | Thermo Fisher Scientific | N/A |
| Adapter BIOFlex HC (15 mL/50 mL) | Thermo Fisher Scientific | N/A |
| BD Rhapsody Express Single-Cell Analysis System Package | Becton Dickinson | Cat# 633707 |
| TapeStation 4200 system | Agilent | Cat# G2991AA |
| Invitrogen Qubit fluorometer | Thermo Fisher Scientific | Cat# Q33240 |
| Eppendorf ThermoMixer C | Eppendorf | Cat# 5382000015 |
| Magnetic separation stand (0.2 mL; 5 mL) | V&P Scientific | Cat# VP 772F4-1, VP 772FB-1A, VP 772FB-1 |
| DynaMag-2 magnet | Thermo Fisher Scientific | Cat# 12321D |
| BD LSRII/Symphony | Becton Dickinson | Special order research product |
| Light-transmission microscope | Major supplier | N/A |
| Thermocycler | Major supplier | N/A |
| Minifuge for PCR TubeStrips | Major supplier | N/A |
| Illumina NovaSeq 6000 | Illumina | Cat# 20012850 |
| Illumina NextSeq 500 | Illumina | Cat# SY-415-1001 |
Materials and equipment
Preparation of buffers and solutions
-
•
Complete RPMI: Supplement RPMI1640 medium with 10% FCS (store at 4°C, up to 4 weeks).
-
•
PFA: 16% Methanol-free PFA is diluted to a final concentration of 4% in sterile PBS (prepare freshly if possible or store small aliquots at −20°C).
-
•
RBC lysis Buffer: 10× RBC lysis buffer stock solution (BioLegend) is diluted to a final concentration of 1× in sterile nuclease-free ddH2O (prepare freshly).
Preparation of materials and equipment
Here, a list of required materials and equipment is described:
-
•
Reservoirs filled with Terralin PAA solution to rinse tips before discarding into waste bins
-
•
2 liter Terralin PAA cylinder flask to discard serological pipettes
-
•
Empty waste flask for liquid waste
-
•
Waste bucket with double bag
-
•
Sterillium bottle for disinfection of gloves/hands
-
•
Terralin PAA squeeze bottle to disinfect surfaces and materials
-
•
Stack of dust-free paper towels
-
•
1,000 μL, 200 μL and 10 μL filter tips and pipettes
-
•
50 mL Falcons
-
•
Single-use counting chambers
-
•
Cryovials
-
•
4-well dish
-
•
Pre-cut stripes of tape to seal 4-well dish for counting
-
•
Electric pipette
-
•
25 mL, 10 mL, and 5 mL serological pipettes
-
•Aliquots of the media and buffers needed
-
○cell culture medium (RPMI1640+10%FBS)
-
○PBS
-
○BD stain buffer (on ice)
-
○BD sample tags (on ice)
-
○Trypan blue
-
○
Note: Prepare aliquots before starting to work with the samples to avoid contamination of the stock solutions. Volumes of aliquots should be scaled according to number of samples.
-
•
Thermo Scientific Megafuge 40R with TX-1000 rotor
-
•
Slide coat TX-1000 buckets with TX-1000 ClickSeal biocontainment lids and 50 mL and 15 mL Adapter BIOFlex HC
Alternatives: Any refrigerated centrifuge with swinging bucket rotor and buckets with biocontainment lids can be used.
-
•
BD Rhapsody Express instrument
-
•
BD Rhapsody P1200M and P5000M pipettes
-
•
TapeStation 4200 system
Alternatives: The 2100 Bioanalyzer (Agilent technologies) can alternatively be used for fragment distribution analyses.
-
•
Invitrogen Qubit Fluorometer
-
•
Eppendorf ThermoMixer C
Alternatives: Any programmable thermomixer can be used.
-
•
Magnetic separation stands for 5 mL, 1.5 mL and 0.2 mL
-
•
3-laser flow cytometer (e.g., BD LSRII/Symphony)
-
•
Light-transmission microscope
-
•
Thermocycler
-
•
Minifuge for PCR TubeStrips
-
•
Illumina NovaSeq 6000/NextSeq500
Step-by-step method details
Note: If both peripheral blood mononuclear cells (PBMC) isolation and red blood cell lysis are performed from the same sample in parallel, it is necessary to split the samples in 2 aliquots. The respective volumes depend on the starting material and should be adjusted to the required material for downstream applications.
Red blood cell (RBC) lysis
Timing: 30 min
In this section, the RBC lysis procedure to prepare whole blood samples for scRNA-seq and FACS from blood of COVID-19 patients is described.
-
1.Preparation of the RBC lysis solution
-
a.Dilute 1:9 the 10× RBC lysis buffer (BioLegend) in sterile ddH2O freshly before use
-
a.
-
2.Red blood cell lysis
-
a.Transfer the blood tube in the biological hood and gently transfer 1 mL of blood to a 50 mL Falcon
-
b.Using a serological pipette carefully add 10 mL of 1× RBC lysis buffer
-
c.Shortly vortex the Falcon and incubate for 10 min between 20°C–22°C
-
d.Dilute the cell solution in RBC lysis buffer by adding 40 mL of PBS
-
e.Centrifuge the cell suspension at 300 × g for 10 min, 4°C, following the above-mentioned safety instructions
-
f.Remove the supernatant and resuspend the cell pellet in the desired volume of PBS
-
g.Count the cells following the above-mentioned safety instructions
-
a.
PBMC purification using density-gradient centrifugation
In this section the procedure to purify PBMC from blood of COVID-19 patients is described. Special emphasis will be paid on the necessary steps to avoid contamination of the working area and infection of the experimenter.
-
3.Preparation of the necessary materials
-
a.For each sample prepare and label two 50 mL Falcons, fill one of the tubes with 10 mL of Pancoll pre-warmed to between 20°C–22°C and one with 20 mL PBS
-
b.Label the tubes with all necessary information (PBS, Pancoll, sample ID, etc.)
-
a.
-
4.Pancoll density-gradient centrifugation
-
a.Move the blood tube under the laminar flow hood
-
b.Transfer the content (maximum 20 mL) to a new 50 mL Falcon and add an equal volume of PBS
-
c.Gently overlay the diluted blood onto 10 mL Pancoll (pre-filled tubes) following the manufacturer’s protocol
-
d.Centrifuge at 700 × g 25 min, 20°C, without breaks, following the above-mentioned safety instructions
-
e.After centrifugation, take the Falcon out of the centrifugation bucket under the hood and carefully collect the PBMC fraction into a 50 mL Falcon pre-filled with PBS using a serological pipetteNote: PBS volume should be two volumes of the expected PBMC fraction; final volume should be adjusted accordingly.CRITICAL: Prevent mixing of the density phases to avoid contamination of the PBMC fraction with erythrocytes and granulocytes.
-
f.Centrifuge cells at 300 × g for 10 min, 4°C, following the above-mentioned safety instructions
-
g.Remove supernatant and resuspend the PBMC in the desired volume of complete RPMI
-
h.Count the cells following the above-mentioned safety instructions
-
a.
Cryopreservation of PBMC samples (optional)
In this section we describe how to store PBMC samples for long-term sample acquisition and processing for scRNA-seq. Cells are stored in DMSO-supplemented freezing media in liquid nitrogen.
-
5.Preparation of required media and equipment
-
a.2× freezing medium: RPMI1640 supplemented with 40% FBS and 20% DMSO
-
b.Resuspension medium: RPMI1640 supplemented with 40% FBS
-
c.Chill a cell freezing container in a 4°C refrigerator
-
d.Cryovials
-
a.
-
6.Cryopreservation Protocol
-
a.Prepare and label cryovials, open them, and place them on ice in the hood
-
b.Centrifuge the purified PBMC at 300 × g for 5 min, 4°C, following the above-mentioned safety instructions
-
c.Resuspend the cell pellet in an appropriate volume of chilled resuspension medium to achieve a cell concentration of ∼2–10 × 106 cells/mL (maintain the cells on ice)
-
d.Gently add an equivalent volume of chilled 2× freezing medium to achieve a cell concentration of ∼1–5 × 10⁶ cells/mL
-
e.Gently mix the cells
-
f.Dispense 1 mL aliquots of the cell suspension into the cryovials on ice
-
g.Close the cryovials with the corresponding lid
-
h.Remove the chilled cell freezing container from the 4°C refrigerator and place it in the hood
-
i.Wipe each cryovial with Terralin PAA and place inside the cell freezing container
-
j.Wipe the outside of the cell freezing container with Terralin PAA
-
k.Move the container out of the hood and place it in a −80°C freezer for minimum 12 h, ensure that the bottom and top vents of the container are not obstructed to allow adequate air flow
-
l.Transfer the cryovials to liquid nitrogen for long-term storage
-
a.
-
7.Thawing procedure:
-
a.Remove cryovial(s) from liquid nitrogen storage and transport immediately on ice in the hood
-
b.Thaw the samples in a reservoir containing water at 37°C for 2–3 min
-
c.Gently transfer thawed cell suspension into an empty 50 mL Falcon using a 1 mL pipette tip (If possible, use wide-bore tips for the complete thawing procedure)
-
d.Rinse the cryovial with 1 mL warm complete RPMI and add the medium dropwise to the 50 mL Falcon containing the cell suspension while gently shaking the FalconNote: Dropwise addition of medium allows the cells sufficient time for a gradual loss of DMSO and therefore prevents osmotic lysis.
-
e.Serially dilute the cells with complete RPMI a total of 4 times by 1:1 volume addition with approximately 1 min wait between additions (final volume: 32 mL)
-
f.Put all 50 mL Falcons in a centrifuge bucket inside the hood and close the lid
-
g.Centrifuge cells at 300 × g for 5 min between 20 and 22°C, following the above-mentioned safety instructions
-
h.Remove most of the supernatant, leaving ∼1 mL and resuspend cell pellet in this volume using a 1 mL pipette tip
-
i.Add an additional 4 mL complete growth medium to achieve a total volume of ∼5 mL
-
j.Proceed to count viable cells as described above and adjust the cell concentration according to the downstream protocol
-
a.
Oligo-coupled antibody-based sample multiplexing (and optionally AbSeq)
In this section the staining with universal antibodies conjugated to unique polyadenylated DNA barcodes (sample tags) is described. The use of sample tags allows multiplexing of up to 12 samples reducing potential technical batch effects. Furthermore, multiplexing of samples significantly reduces the time and costs of the library preparation and sequencing processes. After the sample tag labeling, an optional step can be introduced to detect surface protein expression. This protocol is termed AbSeq by BD and is based on a second staining using currently up to 100 selected antibodies conjugated to oligonucleotides (Ab-Oligos) (Figure 4). Cells can be either co-labeled with sample tag and Ab-Oligos concurrently in the same tube or labeled sequentially. The latter allows reducing the cost per sample considerably, but increases both time and the risk to lose cells during the additional washing steps. It is, therefore, critical to take these considerations into account for the experimental design. Here we describe the sequential labeling approach. Considering the potential loss of cells during the extra wash steps, starting with 1 million cells is recommended, but the following protocol also works with low-abundance samples (< 100,000 cells).
-
8.Labeling samples with sample tag-coupled antibodies
-
a.Transfer 20,000–2 × 10⁶ cells into 200–500 μL of BD Stain Buffer in a 5 mL Eppendorf tube
-
b.Proceed to spin samples at 300 × g for 5 min, 4°C following the above-mentioned safety instructions
-
c.Resuspend the cell pellet in 190 μL of BD Stain Buffer
-
d.For each sample, transfer the cell suspension to the respective sample tag tube previously aliquoted (see Note) and mix by pipetting onlyNote: The original BD Rhapsody protocol uses the whole volume of 20 μL of each sample tag-coupled antibody mix for labeling the samples. However, using 10 μL yielded comparable results.
-
e.Incubate the cell suspension between 20°C and 22°C for 20 min
-
f.Add 200 μL of BD Stain Buffer to the cell suspension and mix by pipetting
-
g.Proceed to spin samples at 300 × g for 5 min, 4°C following the above-mentioned safety instructions
-
h.Carefully remove the supernatant with a pipette leaving a small amount of medium to ensure the cell pellet is not disturbed
-
i.Resuspend the pellet in 500 μL of BD Stain Buffer
-
j.Repeat step 8g and centrifuge the cell suspension at 300 × g for 5 min, 4°C following the above-mentioned safety instructions
-
k.Remove the supernatant leaving a small amount of medium and resuspend the pellet in 300 μL of BD Sample Buffer
-
a.
Note: For low-abundance samples leave ∼50 μL of supernatant and resuspend the cells in a total volume of 100 μL.
Note: For low-abundance samples, a co-labeling approach as mentioned above could be used to decrease the potential risk of cell loss. It is important, however, to consider that this approach substantially increases the cost for the AB-labeling per sample. For more details, please, refer to the BD protocol. (http://static.bdbiosciences.com/documents/BD-AbSeq-Ab-Oligos-Single-Cell-Multiplexing-Kit-User-Guide.pdf)
-
9.Pooling samples
-
a.Count the cell number of each sample after labeling as described above
-
b.Pool the cells of all samples at equal numbers and adjust the volume with BD Sample Buffer to a final volume of 610 μL
-
a.
Note: If Ab-Oligo staining is not performed, proceed immediately with the single-cell capture step.
-
10.Optional: Ab-Oligo Labeling
-
a.After Oligo-coupled antibody-based sample multiplexing, centrifuge the cell mixture at 300 × g for 5 min, 4°C following the above-mentioned safety instructions
-
b.To block non-specific AB binding sites, remove the supernatant, add 100 μL blocking buffer (95 μL BD Stain Buffer + 5 μL human FcR blocking reagent) and incubate the cell suspension for 10 min between 20°C and 22°C
-
c.Add 100 μL of the antibody mix to the cell suspension and incubate the cell suspension for 40 min on iceNote: BD AbSeq oligo-coupled antibodies are optimized for use at a final concentration of 1:100. Thus, 2 μL of each antibody are mixed and depending on the numbers of antibodies used stain buffer is added to reach a volume of 100 μL of the antibody mix. At this point the mix is added to the cell suspension in blocking buffer reaching a final volume of 200 μL.
-
d.Add 1 mL of Stain Buffer and proceed to spin the samples at 300 × g for 5 min, 4°C, following the above-mentioned safety instructions
-
e.Repeat the wash step two more times
-
f.Resuspend the cell pellet in 300 μL of BD Sample Buffer
-
g.Count the cells as described above
-
h.Considering the number of cells to load on the BD Rhapsody cartridge, adjust the volume with Sample Buffer to obtain a final volume of 610 μL
-
a.
Figure 4.

Schematic overview for the combination of WTA, sample tag, and AbSeq
BD Rhapsody single-cell capture and cDNA synthesis
This section describes cell loading and capturing of single cells onto the BD Rhapsody Cartridge (RC) and subsequently cDNA synthesis and exonuclease treatment. The critical step here is to define the desired number of cells to load on the RC. BD estimates a multiplet rate of 4.7% when loading 20,000 cells. Using the oligo-coupled antibody-based sample multiplexing strategy enables to efficiently identify doublets in the data in silico thus allowing to super-load a higher number of cells thereby substantially increasing the number of singlets (Stoeckius et al., 2018). On average, we observe a doublet rate ranging roughly from 20 to 40 % when super-loading the cartridges with 60,000 cells and end up with approximately 15–20k cells. The inevitable increase in doublets of course also leads to higher sequencing cost for the informative cells as the doublets take up a substantial part of the reads. But as clinical samples are precious and sequencing costs decrease continuously, this is the preferred approach to get as much information per sample with as little batch effects as possible.
-
11.Prepare the following items before starting the experiment:
-
a.Set two thermomixers at 37°C and 80°C, respectively
-
b.Thaw all the reagents from the BD Rhapsody cDNA kit and place them on ice. Remove the enzymes from −20°C only right before use
-
c.Place Sample Buffer, 1 M DTT, Lysis Buffer, and Cell capture beads from the BD Rhapsody Cartridge Reagent kit on ice
-
d.Prepare Cell Capture Beads by placing the Cell Capture Bead tube on the magnet for 1 min and remove the storage buffer. Afterward, remove the tube from the magnet and resuspend the beads in 750 μL of cold BD Sample Buffer
-
e.Prepare Lysis Buffer by adding 75 μL 1 M DTT to one 15 mL Lysis Buffer bottle
-
f.Ensure that the waste collector and a labeled 5 mL LoBind tube are inserted in the designated slots of the BD Rhapsody Express instrument (Figure 5). The waste collector located inside the instrument must be pre-filled with 1,400 μL absolute ethanol
-
g.Move the left slider on top of the instrument in the middle in position 0 and the slider on the front to WASTE
-
h.Prepare a Terralin PAA bottle and a respiratory protection mask (FFP2 or FFP3) next to the BD Rhapsody express instrument for the case of contamination
-
a.
Note: For operations on the BD Rhapsody Express instrument only electronic BD Rhapsody P1200M and P5000M pipettes can be used. The flow rate in these pipettes is optimized for each different step. For more details on how to use the BD Rhapsody express instrument please consult the BD user guide (http://static.bdbiosciences.com/documents/BD-Rhapsody-Single-Cell-Analysis-System-Instrument.pdf).
-
12.Priming of the RCNote: All buffers used in this step need to be equilibrated between 20°C and 22°C.
-
a.Place the RC into the BD Rhapsody Express instrument assuring that the RC barcodes faces out
-
b.Set the P1200M pipette to “Prime/Treat” mode
-
c.Load 700 μL of absolute ethanol onto the RC
-
d.Remove the ethanol from the RC loading 700 μL of air
-
e.Load 700 μL of Cartridge Wash Buffer 1 (CWB1) and leave it for 1 min at between 20°C and 22°C
-
f.Remove the CWB1 from the RC loading 700 μL of air and subsequently load 700 μL of CWB1 once more leaving it for 10 min between 20°C and 22°C
-
g.Load the RC with 700 μL of air to empty it and immediately load 700 μL Cartridge Wash Buffer 2Note: The RC can be primed up to 4 h and stored at a temperature between 20°C and 22°C before cell loading.
-
a.
-
13.Cell Loading onto the RC and bead retrieval
-
a.With the RC placed on the BD Rhapsody Express instrument empty the RC by loading air into it with the P1200M set in “Prime/Treat” mode
-
b.Bring the RC and P1200M pipette set in “Cell Load” mode under the laminar flow hoodNote: Please consider that in “Cell Load” mode, it is required to press the button of the P1200M a first time to aspirate 40 μL of air, and then after immersing the tip in cold cell suspension to press once more in order to fill the tip and aspirate 575 μL of solution.
-
c.Mix the cell suspension by pipetting with a normal 1,000 μL pipette and then immediately load 575 μL cell suspension on the RC using the P1200M pipette
-
d.Incubate the RC at 20°C–22°C for 15 minNote: At this step, if working with two cartridges in parallel, proceed with cell loading into the second one. We recommend waiting until almost the end of the incubation of step 13d. This allows processing the first cartridge until step (14g) during the incubation time of the second one.
-
e.In the meantime:
-
i.Disinfect your hands and wipe the outside of RC and the P1200M carefully with Terralin PAA assuring that the entire surface has been decontaminated
-
ii.Transfer both the P1200AM and the RC outside of the hood and place the latter into the Rhapsody Express instrument
-
i.
-
f.Set the P1200M pipette in “Prime/Treat” mode and load the RC with air to remove cells in excessNote: The diluted cell solution will be discarded directly into the waste collector pre-filled with absolute ethanol. The final concentration of ethanol inside the container is sufficient to neutralize the virus and the waste can be considered virus free.
-
g.Set the P1200M pipette in “Bead Load” mode
-
h.Resuspend the BD beads by pipetting with a normal 1,000 μL pipette and then immediately aspirate 630 μL bead suspension and load on the RC using the P1200M pipette in “Bead Load” mode
-
i.Incubate the RC at 20°C–22°C for 3 min
-
j.Shake the RC at 20°C–22°C for 15 s using a plate mixer or Thermo mixer at 1,000 rpm to resuspend the beads in excess before to remove them
-
k.Return the RC on the BD Rhapsody Express instrument and wait 30 s
-
l.Set the P1200M pipette in “Wash” mode and load the RC with air and cold Sample Buffer in the following order
-
i.Air
-
ii.Cold Sample Buffer
-
iii.Air
-
iv.Cold Sample Buffer
-
i.
-
m.Move the left slider on the BD Express instrument to LYSIS and set the P1200M in “Lysis” mode
-
n.Load 550 μL Lysis Buffer + DTT on the RC and incubate at 20°C–22°C for 2 min
-
o.Set the P5000M pipette in “Retrieval” mode
-
p.Move the front slider on the BD Express instrument to BEADS and the left slider on RETRIEVAL
-
q.Move the retrieval magnet in down position and leave it for 30 s
-
r.Aspirate 5,000 μL Lysis Buffer + DTT with the P5000M pipette
-
s.Place the P5000M pipette in position to seal against the gasket of the RC
-
t.Move the left slider to the middle position (0) and immediately load 4,950 μL Lysis Buffer with DTT
-
u.Move the front slider on the BD Express instrument to OPEN and collect the 5 mL LoBind Tube
-
a.
-
14.Washing of the cell capture beads
-
a.Place the 5 mL LoBind tube on a large magnetic stand for 5 mL Eppendorf tubes
-
b.After 1 min remove all but ∼1 mL of supernatant without disturbing the beads
-
c.Removing the tube from the magnet, gently pipet the beads and transfer them to a new 1.5 mL LoBind Tube
-
d.Place the tube on the magnetic stand holding 1.5 mL tubes for about 2 min and remove supernatantCRITICAL: Avoid leaving Lysis Buffer in the tube. Lysis Buffer might inhibit the reverse transcription reaction.
-
e.Remove the tube from the magnet and gently resuspend the beads with 1 mL of cold Bead Wash Buffer (BWB)
-
f.Place the tube on the magnet for ∼2 min and remove the supernatant
-
g.Repeat the washing step once more and proceed with the reverse transcriptase reactionNote: Beads can sit in BWB on ice for up to 30 min before proceeding with the next steps. If working with two cartridges, at this time the second cell incubation in RC of step 13d should be finished and can be further processed. In this way. It is possible to proceed with the Reverse transcription and Exonuclease I treatment with both samples together
-
a.
-
15.Reverse transcription and treatment with Exonuclease I on the cell capture beads
-
a.Prepare the cDNA mix (Table 1) and assure that a Thermomixer is set to 37°C and 1,200 rpm
-
b.Place the tube containing the Cell Capture Beads on the magnetic stand for ∼2 min and remove the supernatant
-
c.Pipet 200 μL cDNA mix into the tube containing the Cell Capture Beads
-
d.On a thermomixer incubate the samples at 1,200 rpm and 37°C for 20 min
-
e.In the meantime, prepare the Exonuclease I mix (Table 2) and assure that a thermomixer is set at 80°C without shaking
-
f.Place the tube with the Cell Capture Beads incubated with the cDNA mix on the magnet for ∼2 min and remove the supernatant
-
g.Remove tube from the magnet and pipet 200 μL of Exonuclease I Mix onto the beads and gently pipet the mix
-
h.Incubate the bead suspension first in a thermomixer at 1,200 rpm and 37°C for 30 min and then at 80°C for 20 min (no shaking)
-
i.Place tube with the Cell Capture Beads on the magnet for ∼1 min and remove the supernatant
-
j.Resuspend the beads in 200 μL of cold Resuspension Buffer
-
a.
Pause Point: At this point, the cDNA sample can be stored at 2°C to 8°C for ≤3 months.
Figure 5.

BD Rhapsody Express instrument
Table 1.
cDNA mix
| Components | 1× library (μL) |
|---|---|
| RT buffer | 40 |
| dNTP | 20 |
| RT 0.1 DTT | 10 |
| Bead RT/PCR enhancer | 12 |
| RNase inhibitor | 10 |
| Reverse transcriptase | 10 |
| Nuclease-free water | 98 |
| Total | 200 |
Table 2.
Exonuclease I mix
| Components | 1× library (μL) |
|---|---|
| 10× exonuclease I buffer | 20 |
| Exonuclease | 10 |
| Nuclease-free water | 170 |
| Total | 200 |
BD Rhapsody 3′ whole transcriptome analysis (WTA)
This section describes the workflow to prepare single-cell whole transcriptome mRNA, sample tag, and optionally AbSeq libraries. After a first denaturation step in which sample tag sequences (and AbSeq sequences) are denatured off the beads, it is possible to generate the different sequencing libraries (WTA, sample tag, and AbSeq) by several PCR steps. BD provides the protocol for performing WTA analysis either with sample tag or AbSeq. Here, we further describe an optional extension that allows to process the 3 different products together (Figure 6).
-
16.Prepare the following items before starting the experiment:
-
a.Thaw all the reagents from the BD Rhapsody WTA amplification kit and place them on ice. Remove the enzymes from −20°C only right before use
-
b.Set three thermomixers at 95°C, 37°C and 25°C, respectively
-
c.Save the program shown in Table 3 on the thermomixer
-
a.
Note: We recommend saving the program (Table 3) in the same thermomixer that is set at 25°C from step 17f.iii. This allows to prevent that the sample handling time is unnecessarily extended.
-
17.Random Priming Extension (RPE) on the cell capture beads
-
a.Prepare the Random Primer Mix (Table 4) and keep at 20°C–22°C
-
b.Place the Exonuclease I-treated beads on the magnet for ∼2 min, remove the supernatant and resuspend the beads in 75 μL Elution Buffer
-
c.Heat the beads in a thermomixer at 95°C for 5 min without shaking (Figure 6A)
-
d.Put the tube on the magnet for ∼2 min, remove the supernatant and transfer it (AbSeq/sample tag solution) to a new labeled tube. Keep the supernatant at 4°C for later processing
-
e.Resuspend the beads in 174 μL of Random Primers Mix (Figure 6B)
-
f.Incubate the tube in the following order
-
i.95°C for 5 min (no shaking)
-
ii.37°C, 1,200 rpm for 5 min
-
iii.25°C, 1,200 rpm for 15 min
-
i.
-
g.In the meantime, proceed to prepare the Extension Enzyme Mix (Table 5)
-
h.After the incubations, add 26 μL of Extension Enzyme Mix into the tube containing the beads and place it in the thermomixer with the pre-saved Extension Reaction Program (see “Before you begin” section at the start of this step)Note: While the program is running it is possible to proceed with the sample tag (optional AbSeq) PCR 1 step (Figure 6C).
-
i.Place the tube containing the Random Primer Extension product on the magnet (from step 17h), remove the supernatant and resuspend the beads in 205 μL of Elution Buffer
-
j.Denature the products off the beads by incubating the sample at 95°C for 5 min (no shaking)
-
k.Briefly centrifuge the sample and then resuspend the beads by placing the tube in a thermomixer at any temperature for 30 s at 1,200 rpm
-
l.Place the tube on a magnet and transfer the supernatant containing the Random Primer Extension products in a new tube and proceed with step 18
-
m.Pipette 200 μL of cold bead resuspension buffer in the tube with the beads
-
a.
Note: At this step, the beads can be stored at 4°C for up to 3 months.
-
18.Random Primer Extension Product purification (Figure 6B)
-
a.Before to start freshly prepare 80% ethanol, vortex the SPRIselect beads until they are fully resuspended and label a new 1.5 mL tube as Random Primer Extension Purified Product
-
b.Pipet 360 μL of the beads into the tube containing 200 μL of Random Primer Extension product (from step 17l) and gently mix
-
c.Incubate at 20°C–22°C for 10 min
-
d.Place the suspension on the magnet for 5 min until the sample becomes clear and remove the supernatant
-
e.Add 1 mL of 80% ethanol into the tube sitting on the magnet
-
f.Wait 30 s and then remove the supernatant
-
g.Repeat steps 18e and 18f once more
-
h.Assure to remove all the supernatant and drops of ethanol on the wall of the tube and air dry the sample at 20°C–22°C for 5 min
-
i.Resuspend the beads in 40 μL of Elution Buffer and incubate at 20°C–22°C for 2 min
-
j.Place the tube on the magnet until the solution is clear and transfer the supernatant in the new labeled tube
-
a.
-
19.RPE PCR (Figure 6D)
-
a.Prepare the RPE PCR Mix (Table 6)
-
b.Add 80 μL of the RPE PCR mix to 40 μL of the Random Primer Extension Purified Product from step 18j
-
c.Pipette around 60 μL of the reaction in two 0.2 mL PCR tubes and run the following PCR program (Table 7)Note: Splitting the reaction in two tubes assures that the entire volume in each tube is reaching the same temperature increasing the efficiency of the PCR reaction.Note: Suggested PCR cycles need to be optimized for different cell types and cell number.
-
d.After the PCR, briefly centrifuge the tubes, combine the two reactions in one 1.5 mL tube and proceed to purify the product with SPRIselect beads
-
a.
-
20.RPE PCR product purification (Figure 6E)
-
a.Before to start freshly prepare 80% ethanol, vortex the SPRIselect beads until they are fully resuspended and label a new 1.5 mL tube as Random Primer Extension Purified Product
-
b.Pipet 120 μL of the beads into the tube containing 120 μL of RPE PCR product and gently mix
-
c.Incubate at 20°C–22°C for 5 min
-
d.Place the suspension on the magnet for 3 min until the sample becomes clear and remove the supernatant
-
e.Add 300 μL of 80% ethanol into the tube sitting on the magnet
-
f.Wait 30 s and then remove the supernatant
-
g.Repeat steps 20e and 20f once more
-
h.Assure to remove all the supernatant and drops that could be on the wall of the tube and air dry the sample at 20°C–22°C for 5 min
-
i.Resuspend the beads in 40 μL of Elution Buffer and incubate at 20°C–22°C for 2 min
-
j.Place on the magnet until the solution is clear and transfer the supernatant in the new labeled tube
-
k.Quantify the concentration and check the fragment distribution using the TapeStation System
-
a.
Figure 6.

Library preparation workflow
Table 3.
Extension reaction program
| Temperature | Rpm | Time |
|---|---|---|
| 25°C | 1,200 | 10 min |
| 37°C | 1,200 | 15 min |
| 45°C | 1,200 | 10 min |
| 55°C | 1,200 | 10 min |
Table 4.
Random primer mix
| Component | 1× library (μL) |
|---|---|
| WTA extension buffer | 20 |
| WTA extension primers | 20 |
| Nuclease-free water | 134 |
Table 5.
Extension enzyme mix
| Component | 1×library (μL) |
|---|---|
| 10 mM dNTP | 8 |
| Bead RT/PCR enhancer | 12 |
| WTA extension enzyme | 6 |
Table 6.
RPE PCR mix
| Component | 1× library (μL) |
|---|---|
| PCR master mix | 60 |
| Universal oligo | 10 |
| WTA amplification primer | 10 |
| Total | 80 |
Table 7.
RPE PCR program
| Step | Temperature | Time | Cycles |
|---|---|---|---|
| Hot start | 95°C | 3 min | 1 |
| Denaturation | 95°C | 30 s | 12–13 (for more than 10K cells use 12 cycles) |
| Annealing | 60°C | 1 min | |
| Extension | 72°C | 1 min | |
| Final extension | 72°C | 2 min | 1 |
| Hold | 4°C | ∞ | 1 |
Figure 7.

TapeStation profiles
-
21.Sample tag PCR 1 (Figure 6C)
-
a.Prepare the sample tag PCR 1 Mix (Table 8)
-
b.In a 1.5 mL tube mix 133 μL of sample tag PCR 1 mix with 67 μL of the sample tag product from step 17d.
-
c.Split the PCR 1 mix in four 0.2 mL PCR tubes and run the following program (Table 9)Note: Suggested PCR cycles need to be optimized for different cell types and cell number.
-
d.After the PCR, combine the 4 reactions in one 1.5 mL tube and proceed to purify the product with SPRIselect beads
-
a.
-
22.Sample tag PCR 1 purification (Figure 6F)
-
a.Before to start freshly prepare 80% ethanol, vortex the SPRIselect beads until they are fully resuspended and label a new 1.5 mL tube as sample tag PCR1 purified product
-
b.Pipet 360 μL of the SPRIselect beads into the tube containing 200 μL of sample tag PCR1 and gently mix
-
c.Incubate at 20°C–22°C for 5 min
-
d.Place the suspension on the magnet for 5 min until the sample becomes clear and remove the supernatant
-
e.Add 600 μL of 80% ethanol into the tube sitting on the magnet
-
f.Wait 30 s and then remove the supernatant
-
g.Repeat steps 22e and 22f once more
-
h.Assure to remove all the supernatant and drops of ethanol on the wall of the tube and air dry the sample at 20°C–22°C for 5 min
-
i.Resuspend the beads in 30 μL of Elution Buffer and incubate at 20°C–22°C for 2 min
-
j.Place the tube on the magnet until the solution is clear and transfer the supernatant in the new labeled tube
-
a.
-
23.WTA Index PCR (Figure 6G)
-
a.Considering the concentration of the 150–600 bp region, dilute the RPE PCR product to a concentration of 2 nM using Elution Buffer.
-
b.Prepare the WTA Index PCR mix as described below (Table 10)CRITICAL: In the BD Rhapsody WTA Amplification four different Library Reverse primers are present. When preparing multiple libraries, for each of them different reverse primers should be used to allow combined sequencing.
-
c.Combine 10 μL of 2 nM template with 40 μL of the WTA Index PCR mix
-
d.Run the following program (Table 11)
-
e.After PCR, briefly centrifuge the tube for collecting all the sample at the bottom of the tube
-
f.Add 60 μL of nuclease-free water to the WTA index PCR product, pipet and then transfer 100 μL into a new 0.2 mL PCR tube
-
a.
-
24.WTA index PCR product purification (dual-sided cleanup) (Figure 6H)
-
a.Before to start freshly prepare 80% ethanol, vortex the SPRIselect beads until they are fully resuspended, prepare a new 0.2 mL PCR tube for the second clean up and label a new 1.5 mL tube as WTA index PCR Purified Product.
-
b.Pipet 60 μL of the beads into the tube containing 100 μL of the WTA Index PCR product (from step 23f) and gently mix
-
c.Incubate at 20°C–22°C for 5 min
-
d.Place the suspension on the magnet for 2 min
-
e.In the meantime, pipet 15 μL of SPRIselect beads in a new 0.2 mL PCR tube
-
f.Transfer 160 μL of the supernatant from step 24d in the tube containing 15 μL of beads and gently pipet
-
g.Incubate at 20°C–22°C for 5 min
-
h.Place the tube on the magnet for 2 min until the suspension becomes clear and remove the supernatant
-
i.Add 300 μL of 80% ethanol into the tube sitting on the magnet
-
j.Wait 30 s and then remove the supernatant
-
k.Repeat steps 24i and 24j once more
-
l.Assure to remove all the supernatant and drops of ethanol on the wall of the tube and air dry the sample at 20°C–22°C for 2 min
-
m.Resuspend the beads in 30 μL of Elution Buffer and incubate at 20°C–22°C for 2 min
-
n.Place the tube on the magnet until the solution is clear and transfer the supernatant in the new labeled tube
-
o.Quantify the concentration with a Qubit Fluorometer and check the fragment distribution with the TapeStation System (Figure 7B)
-
a.
Note: The fragment distribution should show a peak between 250 and 1,000 bp (Figure 7B). If lower peaks are shown or the concentration is too low refer to the troubleshooting section (see below).
- 25.
-
26.Sample tag PCR 2 purification (Figure 6J)
-
a.Before to start freshly, prepare 80% ethanol, vortex the SPRIselect beads until they are fully resuspended and label a new 1.5 mL tube as sample tag PCR2 purified product
-
b.Pipet 60 μL of the beads into the tube containing 50 μL of sample tag PCR 2 product and gently mix
-
c.Incubate at 20°C–22°C for 5 min
-
d.Place the suspension on the magnet for 3 min until the sample becomes clear and remove the supernatant
-
e.Add 200 μL of 80% ethanol into the tube sitting on the magnet
-
f.Wait 30 s and then remove the supernatant
-
g.Repeat steps 26e and 26f once more
-
h.Assure to remove all the supernatant and drops of ethanol on the wall of the tube and air dry the sample at 20°C–22°C for 3 min
-
i.Resuspend the beads in 30 μL of Elution Buffer and incubate at 20°C–22°C for 2 min
-
j.Place on the magnet until the solution is clear and transfer the supernatant in a new labeled tube
-
k.Measure the concentration with a Qubit fluorometer
-
a.
-
27.Sample tag index PCR (Figure 6K)
-
a.Prepare the sample tag index PCR mix as described below (Table 14):CRITICAL: When preparing libraries from multiple RC, for each of them different reverse primers must be used. However, for one RC the same index for both the WTA and sample tag can be used.
-
b.Combine 3 μL of 1 ng/μL of template with 47 μL of the sample tag index PCR mix
-
c.Run the following program (Table 15)Note: Suggested PCR cycles need to be optimized for different cell types and cell number
-
d.After PCR, briefly centrifuge the tube for collecting the entire sample at the bottom of the tube and proceed with the purification.
-
a.
-
28.Sample tag index PCR product purification (Figure 6L)
-
a.Before to start, freshly prepare 80% ethanol, vortex the SPRIselect beads until they are fully resuspended and label a new 1.5 mL tube as sample tag index purified product
-
b.Pipet 40 μL of the beads into the tube containing 50 μL of sample tag index PCR product and gently mix
-
c.Incubate at 20°C–22°C for 5 min
-
d.Place the suspension on the magnet for 3 min until the sample becomes clear and remove the supernatant
-
e.Add 200 μL of 80% ethanol into the tube sitting on the magnet
-
f.Wait 30 s and then remove the supernatant
-
g.Repeat steps 28e and 28f once more
-
h.Assure to remove all the supernatant and drops of ethanol on the wall of the tube and air dry the sample at 20°C–22°C for 3 min
-
i.Resuspend the beads in 30 μL of Elution Buffer and incubate at 20°C–22°C for 2 min
-
j.Place the tube on the magnet until the solution is clear and transfer the supernatant in a new labeled tube
-
k.Quantify the concentration with a Qubit Fluorometer and check the fragment distribution with TapeStation System (Figure 7C)
-
a.
Note: The sample tag should show a unique peak at ∼290 bp. If other peaks are shown or the concentration is too low refer to the troubleshooting section (see below).
-
29.Optional: AbSeq LibraryNote: If the samples have been stained with oligo-coupled AbSeq antibodies as well, an AbSeq library needs to be prepared together with the WTA and sample tag library. In this case, the protocol mainly deviates in one step, the sample tag PCR 1 step (step 21), as primers specifically targeting the AbSeq oligo peptides are added to the PCR 1 mix.
-
a.AbSeq/sample tag PCR 1 (Figure 6C)
-
i.Prepare the AbSeq/sample tag PCR 1 Mix (Table 16)
-
ii.In a 1.5 mL tube mix 168 μL of AbSeq/sample tag PCR 1 mix with 67 μL of the AbSeq/sample tag product from step 17d.
-
iii.Split the PCR 1 mix in four 0.2 mL PCR tubes and run the following program (Table 17)Note: Suggested PCR cycles need to be optimized for different cell types and cell number.
-
iv.After the PCR, combine the 4 reactions in one 1.5 mL tube and proceed to purify the product with SPRIselect beads
-
i.
-
b.AbSeq/sample tag PCR 1 Purification (Figure 6F)
-
i.Before to start, freshly prepare 80% ethanol, vortex the SPRIselect beads until they are fully resuspended and label a new 1.5 mL tube as AbSeq/sample tag PCR1 purified product
-
ii.Pipet 423 μL of beads in 235 μL of AbSeq/sample tag product and incubate 5 min at 20°C–22°C
-
iii.Place the tube on the magnets, wait 5 min, and remove supernatant
-
iv.Wash twice with 600 μL of 80% ethanol
-
v.Assure to remove all the supernatant and drops of ethanol on the wall of the tube and air dry the sample at 20°C–22°C for 5 min.
-
vi.Resuspend in 30 μL Elution Buffer and incubate 2 min at 20°C–22°C
-
vii.Place the tube on the magnet and pipette the eluate in a new tube
-
viii.Quantify on the Qubit fluorometer
-
ix.Dilute an aliquot of AbSeq/sample tag product to 1 ng/μL and proceed to index PCR of the AbSeq product (Figure 6M). For the sample tag use undiluted PCR 1 product and proceed with the sample tag PCR 2 step (step 25) as described aboveNote: The diluted AbSeq sample can be stored at 4°C for 24 h to run the indexing PCR later together with the sample tag PCR 2 product. The conditions for indexing both the AbSeq and the sample tag libraries are the same (see step 27).
-
x.Once the AbSeq index PCR has been run, purify the product as described for sample tag (see step 28) and check fragment size (Figure 6N). The product should show only a peak around 260 bp (Figure 7D). Refer to the troubleshooting sections (see below) if the concentration is too low or other peaks are detectable.
-
i.
-
a.
Table 8.
Sample tag PCR 1 mix
| Component | 1× library (μL) |
|---|---|
| PCR master mix | 100 |
| Universal oligo | 20 |
| Bead RT/PCR enhancer | 12 |
| Sample Tag PCR 1 primer | 1 |
| Total | 133 |
Table 9.
Sample tag PCR 1 program
| Step | Temperature | Time | Cycles |
|---|---|---|---|
| Hot start | 95°C | 3 min | 1 |
| Denaturation | 95°C | 30 s | 11–15 (for more than 10K cells use 11cycles) |
| Annealing | 60°C | 3 min | |
| Extension | 72°C | 1 min | |
| Final extension | 72°C | 5 min | 1 |
| Hold | 4°C | ∞ | 1 |
Table 10.
WTA index PCR mix
| Component | 1× library (μL) |
|---|---|
| PCR master mix | 25 |
| Library forward primer | 5 |
| Library reverse primer (1–4) | 5 |
| Nuclease-free water | 5 |
| Total | 40 |
Table 11.
WTA index PCR program
| Step | Temperature | Time | Cycles |
|---|---|---|---|
| Hot start | 95°C | 3 min | 1 |
| Denaturation | 95°C | 30 s | 8–9 (for less than 2 nM use 9 cycles) |
| Annealing | 60°C | 30 s | |
| Extension | 72°C | 30 s | |
| Final extension | 72°C | 1 min | 1 |
| Hold | 4°C | ∞ | 1 |
Table 12.
Sample tag PCR 2 mix
| Component | 1× library (μL) |
|---|---|
| PCR master mix | 25 |
| Universal oligo | 2 |
| Sample tag PCR 2 primer | 3 |
| Nuclease-free water | 15 |
| Total | 45 |
Table 13.
Sample tag PCR 2 program
| Step | Temperature | Time | Cycles |
|---|---|---|---|
| Hot start | 95°C | 3 min | 1 |
| Denaturation | 95°C | 30 s | 10 |
| Annealing | 60°C | 3 min | |
| Extension | 72°C | 1 min | |
| Final extension | 72°C | 5 min | 1 |
| Hold | 4°C | ∞ | 1 |
Table 14.
Sample tag index PCR mix
| Component | 1× library (μL) |
|---|---|
| PCR master mix | 25 |
| Library forward primer | 2 |
| Library reverse primer (1–4) | 2 |
| Nuclease-free water | 18 |
| Total | 47 |
Table 15.
Sample tag index PCR program
| Step | Temperature | Time | Cycles |
|---|---|---|---|
| Hot start | 95°C | 5 min | 1 |
| Denaturation | 95°C | 30 s | 6–8 (for concentrations between 0.5 and 1.1 ng/μL use 6 cycles) |
| Annealing | 60°C | 30 s | |
| Extension | 72°C | 30 s | |
| Final extension | 72°C | 1 min | 1 |
| Hold | 4°C | ∞ | 1 |
Table 16.
AbSeq/sample tag PCR 1 mix
| Component | 1× library (μL) |
|---|---|
| PCR master mix | 117.5 |
| Universal oligo | 23.5 |
| Bead RT/PCR enhancer | 14.1 |
| Sample tag PCR 1 primer | 1.1 |
| AbSeq PCR 1 primer | 11.8 |
| Total | 168 |
Table 17.
AbSeq/sample tag PCR 1 program
| Step | Temperature | Time | Cycles |
|---|---|---|---|
| Hot start | 95°C | 3 min | 1 |
| Denaturation | 95°C | 30 s | 11–15 (for more than 10K cells use 11cycles) |
| Annealing | 60°C | 3 min | |
| Extension | 72°C | 1 min | |
| Final extension | 72°C | 5 min | 1 |
| Hold | 4°C | ∞ | 1 |
Multi-color flow cytometry
This section describes all important steps and details for sample preparation and recording of flow cytometric data from COVID-19 blood samples. Representative data and a gating strategy are shown in Figure 8. For more elaborate analyses we refer the reader to Schulte-Schrepping et al. (2020). Emphasis will be put on the procedure applied to avoid possible contamination of the scientist during both the preparation of the samples and the final recording of the data.
-
30.
Prepare the staining solution adding the necessary microliters for the respective components (Antibodies-human FcR Blocking reagent-BD Horizon Brilliant Stain Buffer-PBS) to reach the desired concentration in a final volume of 100 μL per sample as indicated in the Table 18
Note: For LIVE/DEAD Fixable Yellow Dead Cell Stain a pre-dilution 1:10 in PBS is required.
-
31.Labeling with fluorescently labeled antibodies
-
a.Count the cell suspension and aliquot at least 2 million cells of each sample (see Cell counting section for details); if the number of available cells is lower see Troubleshooting sectionNote: Flow cytometric analysis can be performed with a lower number of cells; however, this results in reduced statistical power for low represented cell types.Optional: Add 10 μL counting beads to the cell suspension before counting; this will allow you to retrieve the absolute number of cells for each milliliter of blood.
-
b.Centrifuge samples for 5 min at 300 × g, 4°C in 15 mL Falcon tubes following the above-mentioned safety instructions
-
c.After centrifugation, remove the supernatant entirely and resuspend the cells in 100 μL of PBS
-
d.Add 100 μL of staining solution and incubate at 4°C for 30 min
-
e.After antibody incubation, wash the cell suspension with 1 mL of PBS and centrifuge for 5 min at 300 × g, 4°C following the above-mentioned safety instructions
-
f.Remove the supernatant and resuspend the cells carefully in 500 μL of methanol-free PFA (4% in PBS)
-
g.Incubate for 5 min at 20°C–22°C
-
h.Wash samples in 1 mL of PBS following centrifugation for 5 min at 300 × g, 4°C. Repeat this step twice
-
i.Remove the supernatant and resuspend PFA fixed cell pellet in 500 μL PBS
-
j.Store samples protected from light until flow cytometric analysisNote: PFA-treated samples can be considered virus free.
-
a.
-
32.Flow cytometric analysis
-
a.Before starting the measurement exchange the waste tank of the instrument and use an autoclave-grade waste canisterNote: According to the technology in use, assess daily the performance of the instrument to ensure the highest quality possible form the analysis. For example, for BD instruments CS&T beads or Rainbow (8-peak) beads can be used for routine performance check.
-
b.Acquire a minimum of 100,000 events in the living/CD45+ cells gate for each sampleNote: According to the stability of the used instrument and the consistency in the experimental procedure, the voltage setting of the instrument for the measured parameters can be kept the same over different experiments. The daily performance check will give important information in this regard.Note: We provide one possible workflow for flow cytometric analysis, variations are possible according to the procedure established in each facility. For detailed information, we refer to Cossarizza et al. (2019).
-
a.
-
33.Cleaning of the instrument after measurement
-
a.For washing the instrument, set the flow cytometer to the highest acquisition speed for sample acquisition
-
b.10 min flow with FACS Rinse
-
c.10 min flow with FACS Clean
-
d.10 min flow with ddH2O (autoclaved water can be cleaned from debris with a 0.2 um filter just before use)
-
e.Waste canister is removed and autoclaved
-
a.
Note: Data analysis will not be part of this protocol since the focus here is on the preparation of potentially harmful samples. For guideline on data analysis, we refer to Cossarizza et al. (2019).
Figure 8.

Visualization of representative flow cytometry data and gating strategy
Table 18.
Pipetting scheme for flow cytometry antibody staining
| Antibody (clone) | Dilution (2× master mix) | μL to add for each sample |
|---|---|---|
| HLA-DR BV421 (L243) | 1:50 | 2 |
| CD4 BV510 (OKT4) | 1:50 | 2 |
| CD16 BV605 (3G8) | 1:50 | 2 |
| CD45 BV711 (HI30) | 1:50 | 2 |
| CD8 BV785 (SK1) | 1:50 | 2 |
| CD66b FITC (G10F5) | 1:50 | 2 |
| CD14 PerCp-Cy5.5 (MϕP9) | 1:50 | 2 |
| CD56 PE (MY31) | 1:12.5 | 8 |
| CD3 PE/Dazzle (UCHT1) | 1:50 | 2 |
| CD11c PE/Cy5 (B-ly6) | 1:25 | 4 |
| Siglec8 PE/Cy7 (7C9) | 1:50 | 2 |
| CD203c APC (NP4D6) | 1:50 | 2 |
| CD1c AlexaFluor700 (L161) | 1:50 | 2 |
| CD19 APC/Fire 750 (HIB19) | 1:25 | 4 |
| LIVE/DEAD fixable yellow dead cell stain | 1:50 (1:10 pre-dilution in PBS) | 2 |
| BD Horizon brilliant stain buffer | 1:5 | 20 |
| FcR blocking reagent, human | 1:50 | 2 |
| PBS | 38 | |
| Total | 100 |
Sequencing and sequencing depth estimation
This step elutes on multiplexing for sequencing, settings of the sequencer, as well as estimated read numbers per pool.
-
34.Pooling of BD Rhapsody libraries for sequencing
-
a.Pool WTA, AbSeq and sample tag libraries of the same cartridge (with the same index) at a molar ratio of 1:1:0.1 (Library Pool)Note: Molarity is calculated by average fragment size of each library determined by the D5000 assay on a TapeStation4200 system and concentration by Qubit HS dsDNA assay.
-
b.Pool an equal number of moles per each library pool normalizing them for the expected number of beads retrieved from each cartridge (theoretically this number should correspond to the actual number of capture single cells)
-
a.
-
35.Perform Sequencing on a NovaSeq6000 System (Illumina) using v1 S2 200 cycle kits
-
a.Pool Rhapsody Cartridge libraries to aim for 50,000 reads for WTA, 50,000 reads for AbSeq, and 5,000 reads for sample tag per cell, allowing for a total of ∼38,000 cells on a S2 flow cell
-
b.PE R1 75 cycles, i7 8 cycles, R2 75 cycles mode
-
c.Final clustering concentration of 220 pM
-
a.
Data pre-processing
This section describes the computational steps required for pre-processing and alignment of multiplexed BD Rhapsody WTA scRNA-seq data, optionally with AbSeq data. The protocol is based on the Drop-seq tools initially developed for processing of drop-seq data (Macosko et al., 2015) and has been developed into a Snakemake workflow for simple and reproducible use (https://github.com/Hoohm/dropSeqPipe). In brief, the two reads of the paired-end sequencing stored in fastq format after demultiplexing of bcl files are transformed into BAM format and the cell barcode and UMI sequence of read 1 are stored as tags in the BAM file containing the read 2 information. Afterwards, the read 2 sequences, treated as single-end reads, are transformed back to fastq format, cleaned and trimmed of 5′ adapter and 3′ polyA sequences and aligned against the reference sequences. After alignment, the BAM tags from the unaligned BAM file are merged with the aligned reads to recover cell barcode and UMI information. Next, additional annotation is added to the reads depending on their genomic location, e.g., their overlap with genes or exons, to enable subsequent gene expression quantification (Figure 9).
-
36.Mapping
-
a.Demultiplex bcl files using Bcl2fastq2 from Illumina
-
b.For mapping of cDNA, sample tag and optionally AbSeq reads, prepare a suitable reference genome by adding sample tag sequences and antibody-coupled oligo sequences as additional chromosomes to the reference genome of choice in fasta format. Additionally, a corresponding annotation file in gtf format must be prepared by adding the necessary information to the gene annotation file of choice
-
c.Build a STAR index from the custom reference genome and annotation file.
-
d.Filter the input reads for valid Rhapsody barcodesNote: As cell barcodes in the BD Rhapsody system are produced as random combinations of 3 from a pool of 96 possible sequences with standardized spacer sequences in between, a whitelist of the 884.736 possible cell barcodes is available and can be used to eliminate reads with wrong cell barcodes upfront. This allows to skip time-consuming error repair and barcode correction steps.
-
e.Next, using the above-mentioned pipeline, cDNA, sample tag and AbSeq reads are processed, trimmed using Cutadapt (Martin, 2011) and mapped to the custom reference genome using STAR (Dobin et al., 2013)
-
a.
-
37.Quantification
-
a.To estimate gene expression abundances, BAM records are annotated depending on their genomic location and overlap with genic regions
-
b.Expression values are extracted from the BAM files using the picard DigitalExpression module and stored as gene expression matrix including gene expression, sample tag, and optionally AbSeq counts
-
a.
Figure 9.

Schematic overview of the scRNA-seq analysis
Downstream data analysis
This section describes the essential downstream analysis steps for the resulting gene expression count data using the R software package Seurat (Butler et al., 2018), including de-multiplexing, quality control, normalization, dimension reduction, clustering and differential gene testing (Figure 9). The following section is based on tutorials and vignettes published by the developer team of Seurat available at https://satijalab.org/seurat/. In addition, the following R packages are required for the analysis: dplyr, Matrix, and ggplot2. For the analysis of AbSeq data, we would like to refer the reader to the respective tutorial by the developer team of Seurat: https://satijalab.org/seurat/v3.2/multimodal_vignette.html.
-
38.Downstream analysis
-
a.Import scRNA-seq UMI count matrices data to R and divide gene expression, sample tag and, if available, AbSeq counts into separate matrices.
-
i.Data import
-
i.
-
a.
```{r}
dir <- "path/to/directory/" # set the path to the directory containing the gene expression quantification output
mtx <- readMM(paste(dir, "umi/matrix.mtx",sep="/"))
genes <- read.delim(paste(dir,"umi/genes.tsv",sep="/"), header = F, stringsAsFactors = F)
bc <- read.delim(paste(dir,"umi/barcodes.tsv",sep="/"), header = F, stringsAsFactors = F)
mtx@Dimnames[[1]] <- as.character(genes$V1)
mtx@Dimnames[[2]] <- as.character(bc$V1)
```
Note: To speed up downstream processing, we can filter cell barcodes with less than a set number of UMIs.
```{r}
mtx <- mtx[,colSums(mtx)>250]
```
-
ii.
Separate sample tag quantifications and gene expression to new matrices
```{r}
sampletags <- c("SampleTag1", "SampleTag2", "SampleTag3", "SampleTag4", "SampleTag5", "SampleTag6", "SampleTag7", "SampleTag8", "SampleTag9", "SampleTag10", "SampleTag11", "SampleTag12")
# Separate the sample tag counts
mtx_sampletag<-mtx[mtx@Dimnames[[1]] %in% sampletags,]
# Separate AbSeq counts (optional)
mtx_AbSeq <- mtx[mtx@Dimnames[[1]] %in%
mtx@Dimnames[[1]][grepl("ˆAB_",mtx@Dimnames[[1]])]),]
# Separate the gene expression counts
mtx_counts <- mtx[!mtx@Dimnames[[1]] %in% c(sampletags,
mtx@Dimnames[[1]][grepl("ˆAB_",mtx@Dimnames[[1]])]),]
```
-
b.Create a Seurat object using the gene expression count matrix and add the sample tag quantifications as a separate assay to the object.
-
i.Create Seurat object
-
i.
```{r}
seurat <- CreateSeuratObject(counts = mtx_counts,
assay = "RNA",
min.cells = 5,
min.features = 250,
project = "Multiplexed BD Rhapsody WTA")
```
-
ii.
Add sample tag data as a separate assay to the Seurat object
```{r}
seurat[["HTO"]] <- CreateAssayObject(counts = mtx_sampletag[,mtx_sampletag@Dimnames[[2]] %in% Cells(seurat)])
# Optional: Filter cells with less than 1 tag reads
seurat <- subset(seurat, subset = nCount_HTO > 0)
```
-
c.Perform standard quality control and filtering of cells.
-
i.Quality Control
-
i.
```{r}
seurat[['percent.mito']] <- PercentageFeatureSet(seurat, pattern = "ˆMT-")
VlnPlot(object = seurat,
features = "nFeature_RNA",
pt.size = 0,
group.by = "orig.ident") +
theme(legend.position="none")
VlnPlot(object = seurat,
features = "nCount_RNA",
log =TRUE,
pt.size = 0,
group.by = "orig.ident")+
theme(legend.position="none")
VlnPlot(object = seurat,
features = "nCount_HTO",
log =TRUE,
pt.size = 0,
group.by = "orig.ident")+
theme(legend.position="none")
VlnPlot(object = seurat,
features = "percent.mito",
pt.size = 0,
group.by = "orig.ident")+
theme(legend.position="none")
```
-
ii.
Filter cells
Filter cells according to selected quality criteria, including the information content per cell, i.e., the number of detected features and the percentage of reads from mitochondrial genes.
```{r}
seurat <- subset(x = seurat, subset = nFeature_RNA > 250 &
nFeature_RNA < 5000 &
nCount_RNA > 500 &
percent.mito < 25)
```
-
d.Demultiplex cells from different samples based on the sample tag counts.
-
i.Sample tag-based demultiplexing
-
i.
```{r}
# Normalize HTO data, here we use centered log-ratio (CLR) transformation
seurat <- NormalizeData(seurat, assay = "HTO", normalization.method = "CLR")
# Demultiplex
seurat <- HTODemux(seurat, assay = "HTO", positive.quantile = 0.99)
# Visualize demultiplexing results
ggplot(seurat@meta.data, aes(x =hash.ID ,fill=hash.ID))+
geom_text(stat='count', aes(label=..count..), vjust=0)+
geom_bar()
# Filter singlets
seurat_singlet <- subset(seurat, subset= HTO_classification.global == "Singlet")
```
-
e.Perform normalization, scaling, variable gene selection, and dimension reduction on the data to get a global representation of the data structure.
-
i.Data normalization and dimension reduction
-
i.
```{r}
# Normalization
seurat_singlet <- NormalizeData(object = seurat_singlet,
normalization.method = "LogNormalize",
scale.factor = 1e4)
# Define variable genes
seurat_singlet <- FindVariableFeatures(object = seurat_singlet,
assay="RNA",
selection.method = 'vst')
# Scaling
seurat_singlet <- ScaleData(object = seurat_singlet,
vars.to.regress = c("nCount_RNA"))
# PCA
seurat_singlet <- RunPCA(object = seurat_singlet,
features = VariableFeatures(object = seurat_singlet))
# UMAP
seurat_singlet <- RunUMAP(seurat_singlet, reduction.use = "pca", dims = 1:20, seed.use = 42)
DimPlot(object = seurat_singlet,
reduction = 'umap',
label = FALSE,
group.by = "hash.ID")
```
-
f.Cluster the cells and determine cluster marker genes to understand the cluster identity and cell type composition.
-
i.Clustering
-
i.
```{r}
seurat_singlet <- FindNeighbors(object = seurat_singlet, dims = 1:20, reduction="pca", force.recalc = TRUE)
seurat_singlet <- FindClusters(object = seurat_singlet, resolution = 0.5, algorithm = 1)
DimPlot(object = seurat_singlet,
reduction = 'umap',
label = TRUE,
group.by = "RNA_snn_res.0.5")
```
-
ii.
Cluster marker gene identification
```{r}
Idents(seurat_singlet) <- "RNA_snn_res.0.5"
cluster.markers.wilcox <- FindAllMarkers(object = seurat_singlet,
only.pos = TRUE,
min.pct = 0.2,
logfc.threshold = 0.25,
min.diff.pct = 0.1,
test.use = "wilcox")
top <- cluster.markers.wilcox %>% group_by(cluster) %>% top_n(n = 5, wt = avg_logFC)
DotPlot(seurat_singlet,
group.by = "RNA_snn_res.0.5",
features = unique(top$gene))
```
Expected outcomes
After demultiplexing, stringent quality control and filtering of low-quality cells, we expect to retrieve approximately 15,000 to 20,000 high quality single-cell transcriptomes per BD Rhapsody cartridge super-loaded with 60,000 cells. In case of successful oligo-coupled antibody-based sample multiplexing, we expect the cells to be equally originating from the 12 originally multiplexed samples and representing all major cell types present in the human peripheral blood at physiological or pathological proportions. For more detailed information on the quality of the data, the possible downstream analyses and in silico applications and their biological meaningfulness, we would like to refer the reader to Schulte-Schrepping et al., (2020).
Limitations
One of the limitations is the lack of BD imaging. The imaging functionality of the BD Rhapsody system cannot be used following the strict safety instructions described above.
Moreover, due to the size of the microwells in the BD cartridge, this system is not suitable for large cell types. A substantial decline in the number of recovered cells has been already recorded for cells with a diameter bigger than 20 μm. In this case additional cells can be loaded into the cartridge to offset the losses observed.
In addition, no multi-omic solution (e.g., scRNA-seq and scATAC-seq) from BD is available at this point in time. Further developments, however, are expected for this platform as well.
Troubleshooting
Problem 1
Product concentration lower than required in one of the quality control steps (steps 24, 26, 28, 29; Figure 10A)
Figure 10.

TapeStation profile with low DNA concentration or unexpected peak
Potential solution
If the library concentration in one of the QC steps is too low, it is possible to repeat the step optimizing the number of PCR cycles. Note that increasing the number of PCR cycles will reduce the complexity of the final library impacting the sequencing performance. Therefore, it is recommended to start with one or just few cycles. It is also possible to re- start the entire procedure using the exonuclease-treated beads.
Problem 2
Unexpected peak in the TapeStation profile after SPRIbead cleaning steps (steps 24, 28, 29; Figure 10B)
Potential solution
Poor bead cleaning procedure can result in peaks with smaller size (<165 bp). In this case, it is possible to repeat the bead cleaning step using the same ratio. However, it is important to consider that repeating a cleaning step will entail the loss of a certain amount of sample product. Therefore, sample concentration should also be taken into account before repeating this step.
Problem 3
Low number of cells for flow cytometry after RCB lysis (step 31).
Potential solution
If the number of cells is > 0.5 million, continue with the procedure as described, pay special attention in all washing steps to avoid excessive loss of cells. If the number is lower, check temperature and concentration of the RBC lysis buffer, wrong concentration or too high temperature of the buffer can be a common cause of loss of cells during the purification procedure.
Resource availability
Lead contact
Further information and requests for resources and reagents should be directed to and will be fulfilled by the Lead Contact, Joachim L. Schultze (j.schultze@uni-bonn.de).
Materials availability
This study did not generate new unique reagents.
Data and code availability
ScRNA-seq data generated using this protocol and published in Schulte-Schrepping et al. (2020) are deposited at the European Genome-phenome Archive (EGA) under access number EGAS00001004571, which is hosted by the EBI and the CRG. Furthermore, respective count data has been uploaded to the online analysis platform FASTGenomics for easy access and direct use under https://beta.fastgenomics.org/p/schulte-schrepping_covid19.
Acknowledgments
J.L.S.. was funded by the BMBF-funded excellence project Diet–Body–Brain (DietBB) under grant number 01EA1809A and by EU project SYSCID under grant number 733100.
Author contributions
Writing and reviewing, E.D.D., L.B., J.S.-S., K.H., M.B., and J.L.S.
Declaration of interests
The authors declare no competing interests.
References
- Butler A., Hoffman P., Smibert P., Papalexi E., Satija R. Integrating single-cell transcriptomic data across different conditions, technologies, and species. Nat. Biotechnol. 2018;36:411–420. doi: 10.1038/nbt.4096. [DOI] [PMC free article] [PubMed] [Google Scholar]
- Cossarizza A., Chang H.-D., Radbruch A., Acs A., Adam D., Adam-Klages S., Agace W.W., Aghaeepour N., Akdis M., Allez M. Guidelines for the use of flow cytometry and cell sorting in immunological studies (second edition) Eur. J. Immunol. 2019;49:1457–1973. doi: 10.1002/eji.201970107. [DOI] [PMC free article] [PubMed] [Google Scholar]
- Dobin A., Davis C.A., Schlesinger F., Drenkow J., Zaleski C., Jha S., Batut P., Chaisson M., Gingeras T.R. STAR: ultrafast universal RNA-seq aligner. Bioinformatics. 2013;29:15–21. doi: 10.1093/bioinformatics/bts635. [DOI] [PMC free article] [PubMed] [Google Scholar]
- Macosko E.Z., Basu A., Satija R., Nemesh J., Shekhar K., Goldman M., Tirosh I., Bialas A.R., Kamitaki N., Martersteck E.M. Highly parallel genome-wide expression profiling of individual cells using nanoliter droplets. Cell. 2015;161:1202–1214. doi: 10.1016/j.cell.2015.05.002. [DOI] [PMC free article] [PubMed] [Google Scholar]
- Martin M. Cutadapt removes adapter sequences from high-throughput sequencing reads. EMBnet. J. 2011;17:10. [Google Scholar]
- Schulte-Schrepping J., Reusch N., Paclik D., Baßler K., Schlickeiser S., Zhang B., Krämer B., Krammer T., Brumhard S., Bonaguro L. Severe COVID-19 is marked by a dysregulated myeloid cell compartment. Cell. 2020;182:1419–1440.e23. doi: 10.1016/j.cell.2020.08.001. [DOI] [PMC free article] [PubMed] [Google Scholar]
- Stoeckius M., Zheng S., Houck-Loomis B., Hao S., Yeung B.Z., Mauck W.M., Smibert P., Satija R. Cell Hashing with barcoded antibodies enables multiplexing and doublet detection for single cell genomics. Genome Biol. 2018;19:224. doi: 10.1186/s13059-018-1603-1. [DOI] [PMC free article] [PubMed] [Google Scholar]
- Stuart T., Butler A., Hoffman P., Hafemeister C., Papalexi E., Mauck W.M., Hao Y., Stoeckius M., Smibert P., Satija R. Comprehensive integration of single-cell data. Cell. 2019;177:1888–1902.e21. doi: 10.1016/j.cell.2019.05.031. [DOI] [PMC free article] [PubMed] [Google Scholar]
Associated Data
This section collects any data citations, data availability statements, or supplementary materials included in this article.
Data Availability Statement
ScRNA-seq data generated using this protocol and published in Schulte-Schrepping et al. (2020) are deposited at the European Genome-phenome Archive (EGA) under access number EGAS00001004571, which is hosted by the EBI and the CRG. Furthermore, respective count data has been uploaded to the online analysis platform FASTGenomics for easy access and direct use under https://beta.fastgenomics.org/p/schulte-schrepping_covid19.