Abstract
Aging is the single greatest cause of disease and death worldwide, and understanding the associated processes could vastly improve quality of life. While the field has identified major categories of aging damage such as altered intercellular communication, loss of proteostasis, and eroded mitochondrial function1, these deleterious processes interact with extraordinary complexity within and between organs. Yet, a comprehensive analysis of aging dynamics organism-wide has been lacking. Here we performed bulk RNA-sequencing of 17 organs and plasma proteomics at 10 ages across the mouse lifespan, and integrated these findings with data from the companion Tabula Muris Senis2,3. We uncover previously unknown linear and non-linear expression shifts during aging, which cluster in strikingly consistent trajectory groups with coherent biological functions, including extracellular matrix regulation, unfolded protein binding, mitochondrial function, and inflammatory and immune response. Remarkably, these gene sets are expressed similarly across tissues, differing merely in age of onset and amplitude. Widespread immune cell activation is especially pronounced and first detectable in white adipose depots during middle age. Single-cell RNA-sequencing confirms the accumulation of adipose T and B cells, including immunoglobulin J-expressing plasma cells, which also accrue concurrently across diverse organs. Finally, we show how expression shifts in distinct tissues are highly correlated with corresponding protein levels in plasma, thus potentially contributing to aging of the systemic circulation. Together, these data demonstrate a similar yet asynchronous inter- and intra-organ progression of aging, thereby providing a foundation to track systemic sources of declining health at old age.
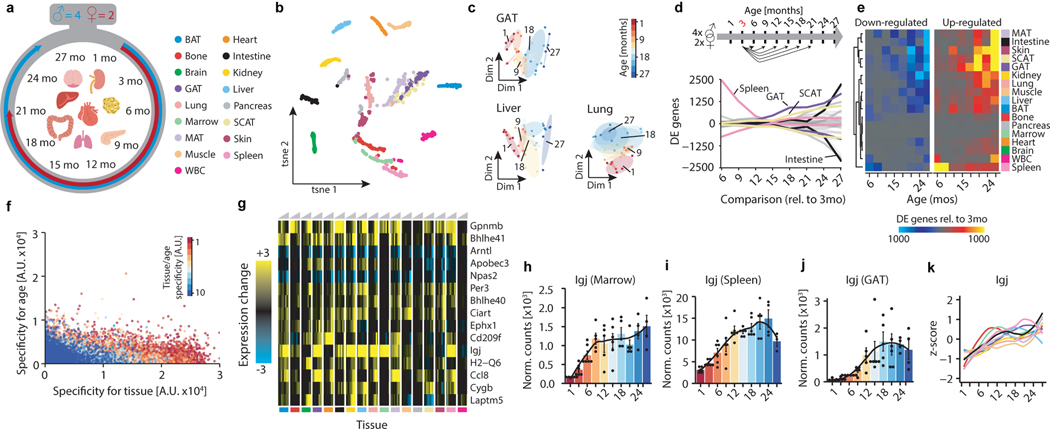
To uncover aging dynamics organism-wide, we measured plasma proteins and sequenced RNA from 17 organ types isolated from C57BL/6JN males (n=4, aged 1, 3, 6, 9, 12, 15, 18, 21, 24, 27 months; equivalent to humans aged 13, 20, 30, 36, 43, 50, 56, 63, 69, 75 years) and females (n=2, ages 1, 3, 6, 9, 12, 15, 18, 21 months) (Fig 1a,b). This encompasses development at 1 month of age through maturity at 3–6 months, as well as aging through adulthood to the median lifespan of 27 mos. We isolated all 17 organs from each mouse, including bone (femurs & tibiae), brain (hemibrain), brown adipose tissue (BAT, interscapular depot), gonadal adipose tissue (GAT, inguinal depot), heart, kidney, limb muscle (tibialis anterior), liver, lung, marrow, mesenteric adipose tissue (MAT), pancreas, skin, small intestine (duodenum), spleen, subcutaneous adipose tissue (SCAT, posterior depot), and white blood cells (WBCs, buffy coat). Raw data are available from GEO (GSE132040), and an interactive data browser is available at https://twc-stanford.shinyapps.io/maca/. Concurrently, we performed single-cell RNA-sequencing on 529,823 cells from 20 organs across the lifespan, presented in the companion paper Tabula Muris Senis2,3.
Figure 1. Pairwise differential expression across organs.
a, Experiment outline. 17 organ types from males 1–27mos old (n=4) and females 1–21mos old (n=2). Icons made by Freepik from www.flaticon.com. b, t-SNE visualization of all samples, based on the first 50 PCs. c, Diffusion maps of GAT, lung, and liver, colored by age. n=38 (GAT), n=37 (liver), n=38 (lung) independent samples. d, Smoothed lineplot displaying the number of DEGs for pairwise comparisons with a 3mo reference. Positive (negative) values represent up-regulated (down-regulated) genes. Grey lines represent non-labeled tissues. e, Heatmap of (d). f, Scatterplot displaying gene-wise enrichment scores for tissue, age, and tissue/age (see methods: Specificity of gene expression for tissues and ages). g, Tissue-wise expression changes with age (column-wise from left to right) for the top 15 genes exhibiting shifts in most tissues. h-j, Igj expression in marrow (h), spleen (i), and GAT (j). n=51, 54, 52 independent samples. LOESS regression indicated by black line. Means ± SEM. k, Z-transformed, smoothed gene expression trajectory of Igj, colored by tissue. n=53 (BAT), 54 (bone), 52 (GAT), 50 (intestine), 52 (kidney), 50 (liver), 54 (lung), 51 (marrow), 54 (MAT), 52 (muscle), 54 (spleen).
Pairwise differential gene expression with age
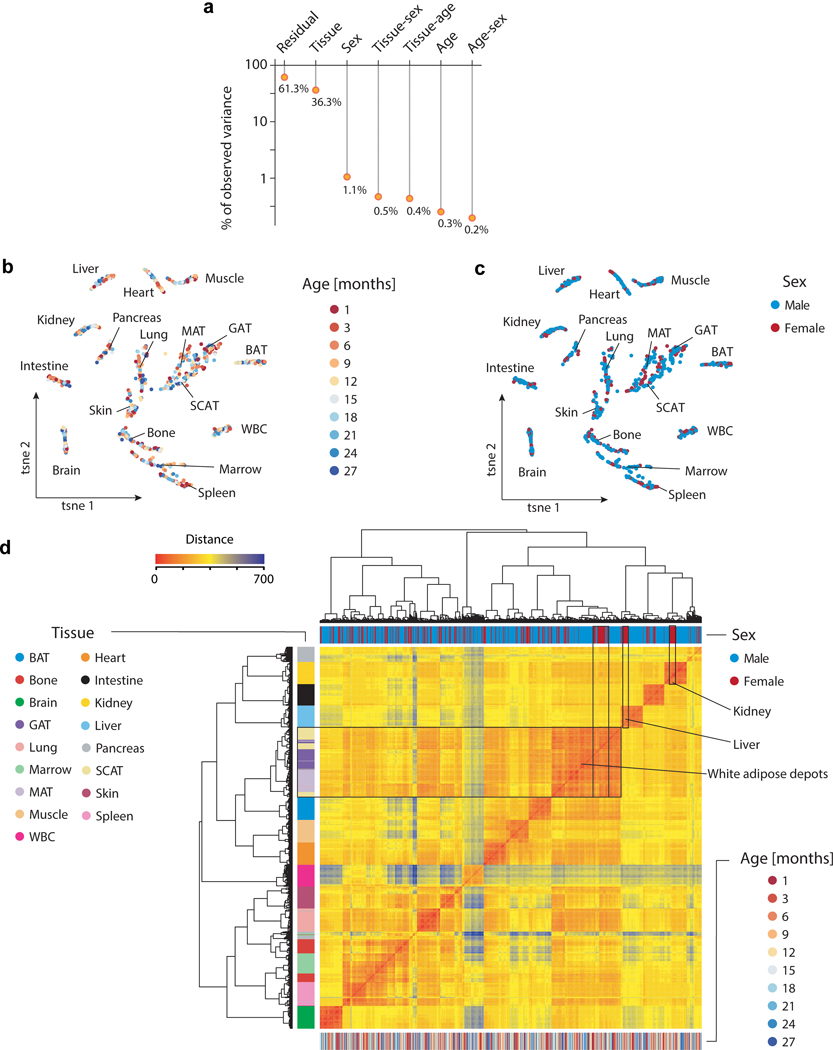
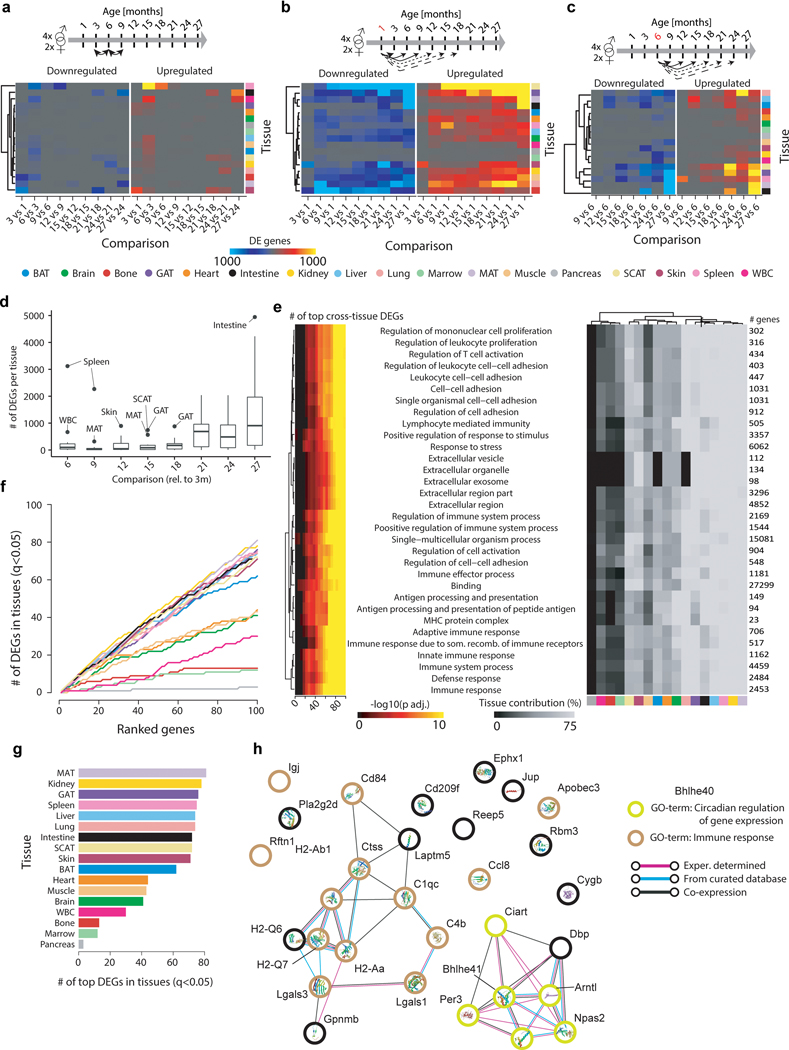
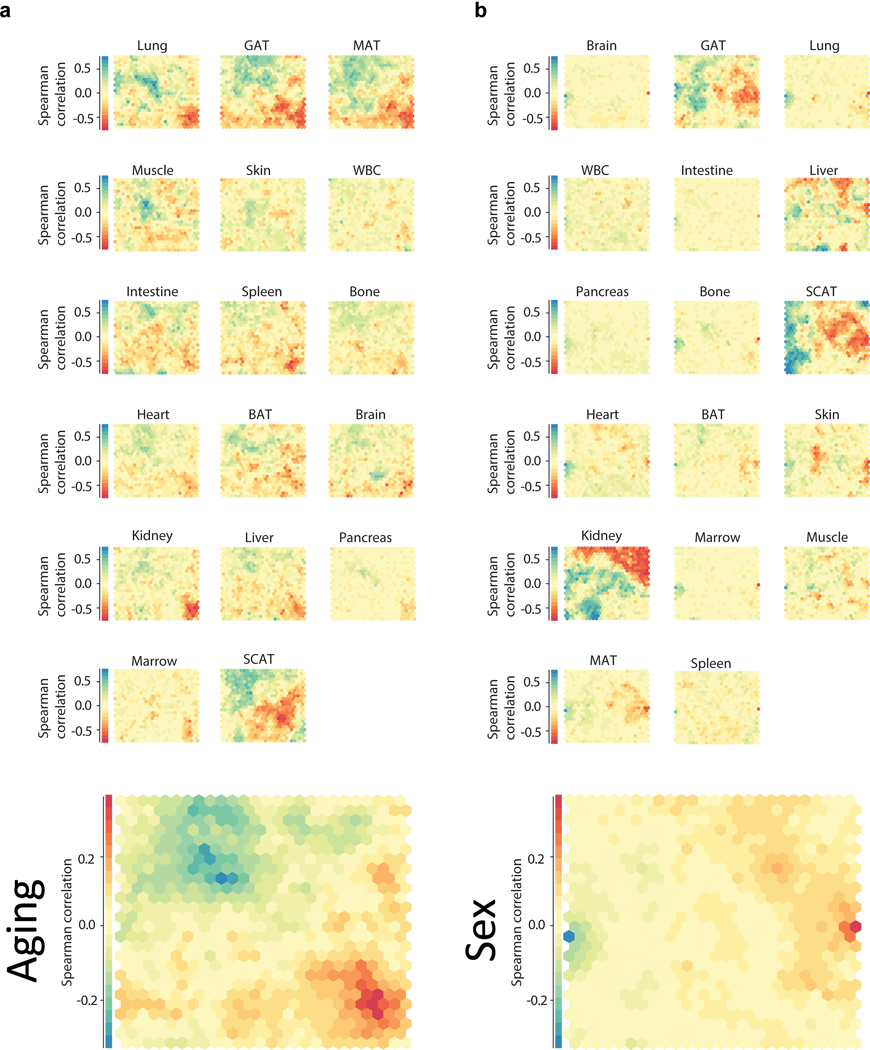
Aging instigates functional decline across organs, disrupting intricate crosstalk essential for maintaining healthy organismal processes. While individual organs segregate by age (Fig. 1c), we lack a basic comparative understanding of aging between these organs, including differences in the onset and rate of aging. We therefore performed pairwise differential expression to determine when differentially expressed genes (DEGs) arise and if they persist with advancing age. While we find few DEGs between neighboring ages, the number of DEGs increases dramatically in most organs relative to 3mo old adults, suggesting progressive, gradual changes that reach detectability only after sufficient time (Fig. 1d,e). Some organs, like pancreas and marrow, appear relatively refractory to aging gene expression changes, perhaps explaining the relatively small proportion of global variance due to aging in the dataset (Extended Data Fig. 1a,b). While core aging profiles are maintained relative to 6-month-old mice, DEGs increase greatly when compared to 1-month-old organs still undergoing development (Extended Data Fig. 2a–c). The clear outlier is the spleen, which displays large quantities of cell cycle and blood cell development DEGs even into middle age (not shown). Notably, SCAT and GAT DEGs arise in mid-life prior to other organs (Fig 1d, Extended Data Fig. 2d). These may be connected to known changes in adipose composition, especially regarding immune cell infiltration4. Some organs, such as mesenteric fat and the small intestine to which it is attached, undergo acute and drastic gene expression changes only late in life. To independently confirm our observations, we generated self-organizing maps for each organ, which allows visualization of correlated gene nodes (Extended Data Fig. 3a)5. Not only do global aging nodes emerge, but white adipose tissues again exhibit strong aging profiles, with visceral GAT and MAT highly similar.
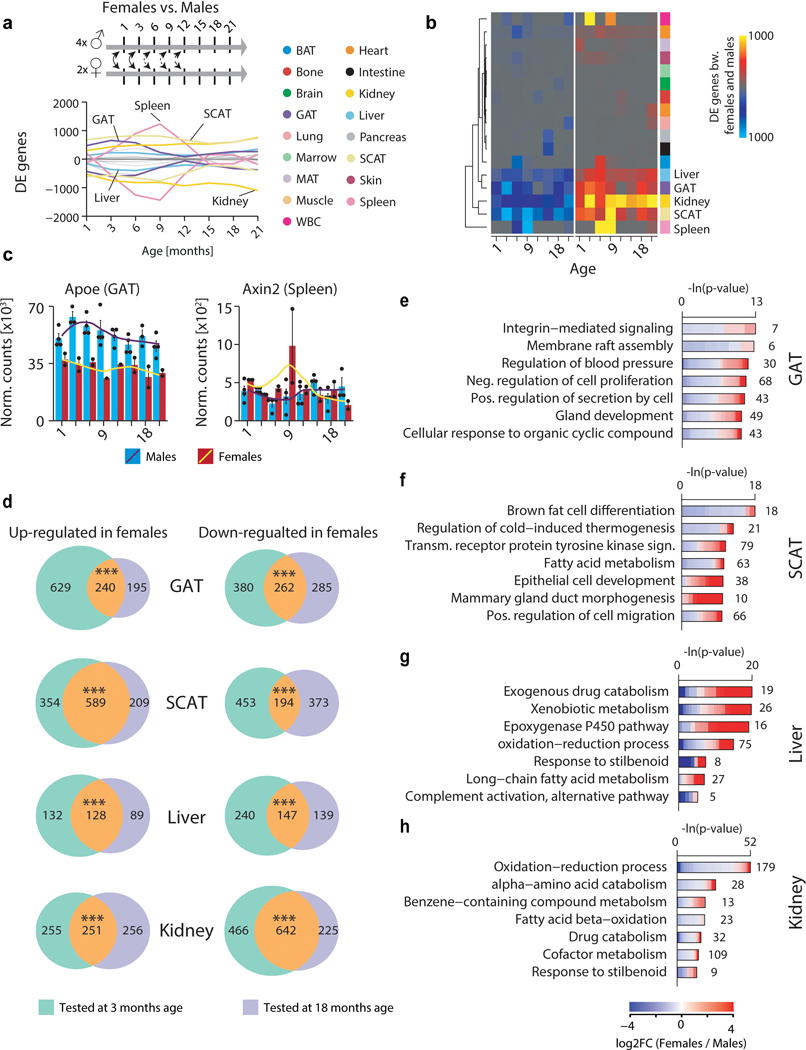
Sex also influences organ function, leading to divergent aging and disease outcomes in humans6. We observed prominent sex effects in GAT, SCAT, liver, and kidney, possibly connected with known differences in fat storage, sex hormone regulation, and renal hemodynamics (Extended Data Fig. 1c, d, Extended Data Fig. 3b)7–9. Upon performing differential gene expression between the sexes at each age, these four tissues consistently display the most DEGs across the lifespan (Extended Data Fig, 4a, b), and the large overlap between young (3mo) and old (18mo) sex DEGs suggests that these differences are established early and maintained throughout life (Extended Data Fig. 4c, d). However, the biological pathways comprising these sex DEGs largely differ from those comprising aging DEGs, therefore providing no evidence that sex differences influence the transcriptional aging profiles observed here (Extended Data Fig. 4e–h).
We next asked if early life DEGs persist with advancing age, or if they give way to new DEGs at older ages. In bone for example, early life expression of ossification genes decreases as bone formation completes, and these genes are highly correlated with late-life DEGs that increase in expression, typifying age-related bone loss (Supplementary Table 1). Overall, most organs show correlation between early and late DEGs, exemplified for nearly every pairwise comparison in GAT, liver, kidney, and heart (Supplementary Table 1). Indeed, few genes are unique to any individual age, with organ-specificity outweighing age-specificity (Fig. 1f). Differential expression common between aging organs is especially interesting, as ubiquitous aging pathways may present novel therapeutic opportunities. When we isolated genes most commonly differentially expressed across organs, we found strong enrichment for immune response pathways (Fig. 1g, Extended Data Fig. 2e–h, Supplementary Table 2). Interestingly, the plasma B cell marker immunoglobulin J (Igj/Jchain) demonstrates a persistent increase throughout life in 11 of 17 organs (Fig. 1g–k). Circadian clock genes Bhlhe40/41, Arntl, Npas2, Per3, Ciart, and Dbp also debut among top DEGs (Extended Data Fig. 2h). Age-related circadian disruption is well known, but these data perhaps highlight the underappreciated organism-wide role for circadian rhythms in declining health. In fact, a malfunctioning circadian clock appears to contribute to metabolic and inflammatory disorders, and shortened lifespan10.
Gene expression dynamics with age
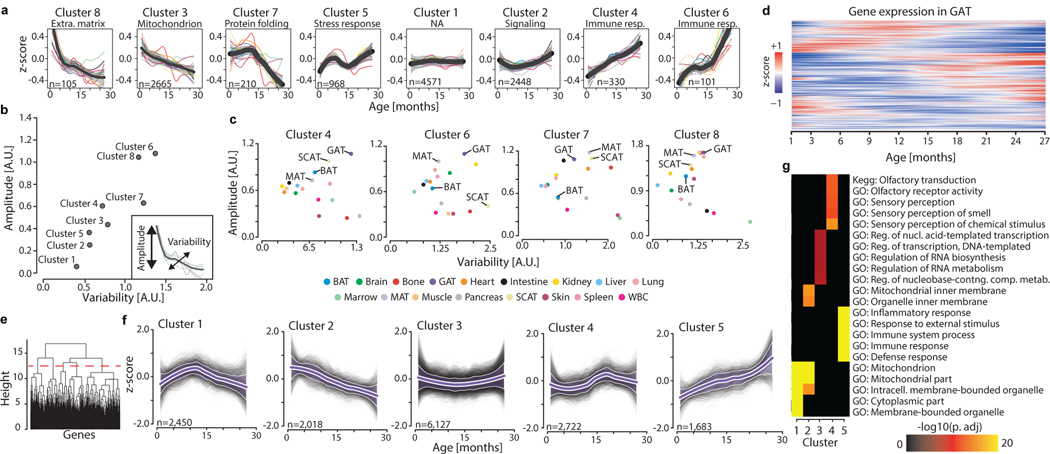
Pairwise comparisons are inherently limited, and our data allow interrogation of gene expression dynamics with high temporal resolution across the lifespan. We first searched for gene expression trajectories across the lifespan with common behavior between organs to reveal organism-wide processes. We calculated the average trajectory for each gene across all 17 organs, and clustered those averaged trajectories, revealing functional enrichment for aging hallmarks such as elevated inflammation, mitochondrial dysfunction, and loss of proteostasis (Fig. 2a, Supplementary Table 3, 4). Notably, these hallmarks undergo distinct dynamic patterns. For example, cluster 3 declines linearly across the lifespan and is strongly enriched for mitochondrial genes, whereas cluster 7 demonstrates a sharp decline of heat shock proteins important for protein folding, but only beginning at 12 months of age. This is in contrast to cluster 8 extracellular matrix genes which decline rapidly until 6 months, from when a more gradual decline prevails. Immune response pathways feature in clusters 4 and 6; cluster 4 genes like beta-2 microglobulin (B2m) and Igj increase steadily throughout life. On the other hand, cluster 6 immune genes like Cd74 and complement C1q experience a non-linear increase featured by a plateau between 9 and 15 months.
Figure 2. Aging gene expression dynamics across organs.
a, Whole-organism gene expression trajectory clustering. The trajectory for each gene was averaged across all 17 organs, and those average trajectories grouped into 8 clusters. The number of genes and the top functionally enriched pathway for each cluster are reported. Within each cluster, the average trajectory for each individual organ is overlaid. Cluster trajectories +/− standard deviation (n=17 tissue trajectories) are indicated in black and grey. Enrichment was tested using Fisher’s exact test (GO) and the hypergeometric test (Reactome and KEGG). Q-values estimated with Benjamini-Hochberg for each database separately, and for GO classes (molecular function, cellular component, biological process) independently. b, Identification of stable and variable clusters between organs. For each cluster in (a), an amplitude and variability index were calculated. c, The 4 clusters changing the most in (b) are represented, and adipose tissues are indicated. d, Unsupervised hierarchical clustering was used to group genes with similar trajectories in GAT (n=15,000 most highly expressed genes). e, Clustering dendrogram and cut-off used to define 5 independent clusters in GAT. f, Gene trajectories of the 5 clusters in (e) are represented in grey. Purple lines surrounded by white represent the average trajectory for each cluster, +/− standard deviation (n genes indicated for each cluster). g, The top 5 pathways for each cluster in (e). n genes as in (e), with the 15,000 most highly expressed genes as background. Enrichment and q-values as in (a).
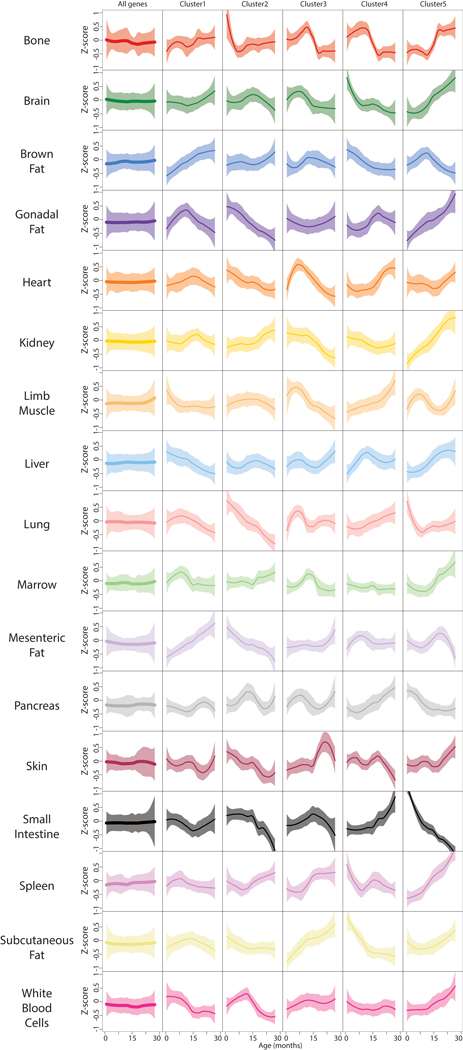
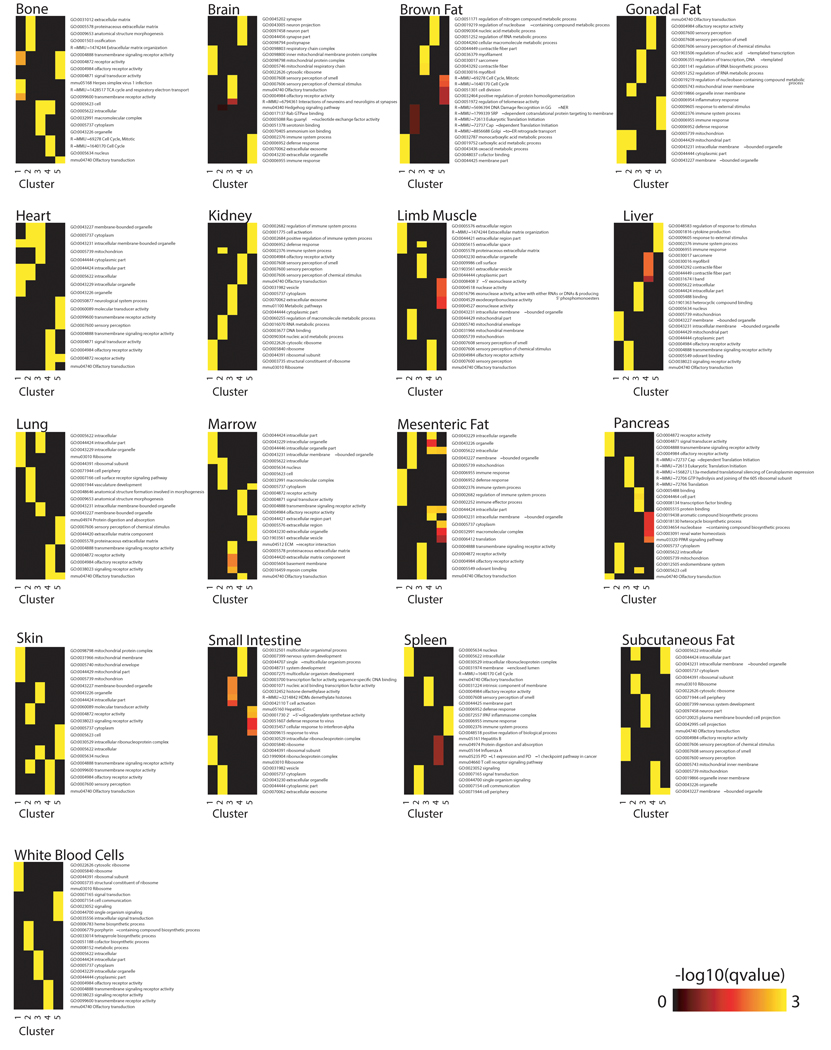
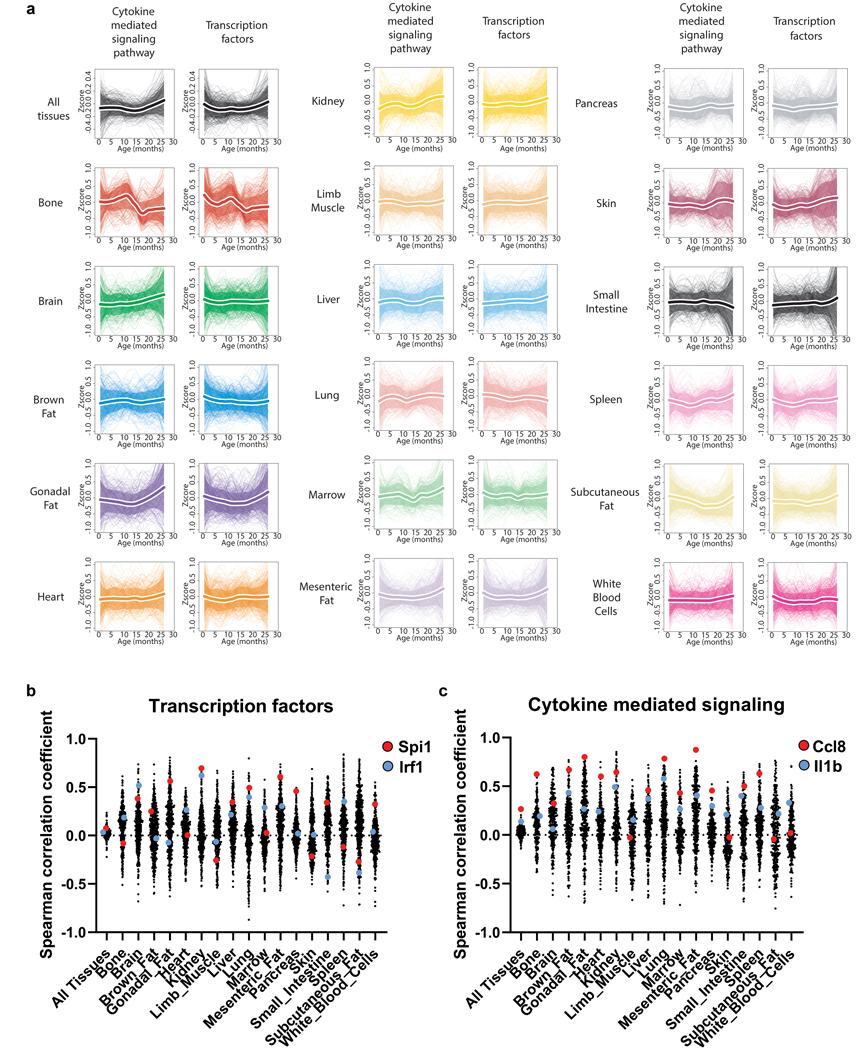
Each cluster contains genes with similar global trajectories, but organ-specific differences in phase and magnitude suggest similar processes undergo unique dynamics. For each cluster we assigned an amplitude (absolute z-score change of the mean trajectory between 1mo and 30mo) and variability index (a measure of the spread from the mean trajectory) (Fig. 2b). This revealed that clusters with the largest amplitudes also show the strongest organ-specific behavior, with adipose tissues prominently featured in clusters 4 and 6 (immune response), cluster 7 (protein folding), and cluster 8 (extracellular matrix) (Fig. 2c). The life-long increase in immune response pathways is especially striking when organs are analyzed independently, specifically for adipose tissues like GAT (Fig. 2d–g, Extended Data Fig. 5, Extended Data Fig. 6, Supplementary Table 5). Indeed, after analyzing genes of cytokine mediated inflammatory pathways (GO0019221), GAT displays a pronounced increase beginning at 18mos (Extended Data Fig. 7a, Supplementary Table 9). This includes Ccl8, which shows very high correlation in a majority of tissue types (Extended Data Fig. 7b). Interestingly, however, even though many downstream processes are shared across organs (Fig. 2a), there is little overlap of transcription factor (TF) regulatory networks (Supplementary Table 6,9). And, although tissue-specific trajectory clusters (Extended Data Fig. 5) show several TFs common between tissues - for example Irf1 in kidney, lung, and heart - the clusters often differ in behavior between tissues, or are enriched for disparate biological pathways (Supplementary Table 7). It thus appears that even though common biological pathways emerge between tissues, these are not, for the most part, driven by an underlying change to common TF regulatory networks. It is of course possible that more distal regulatory elements including enhancers or super enhancers may provide a missing link, and future work will hopefully analyze such regulatory elements.
scRNA-seq confirms plasma B cell infiltration
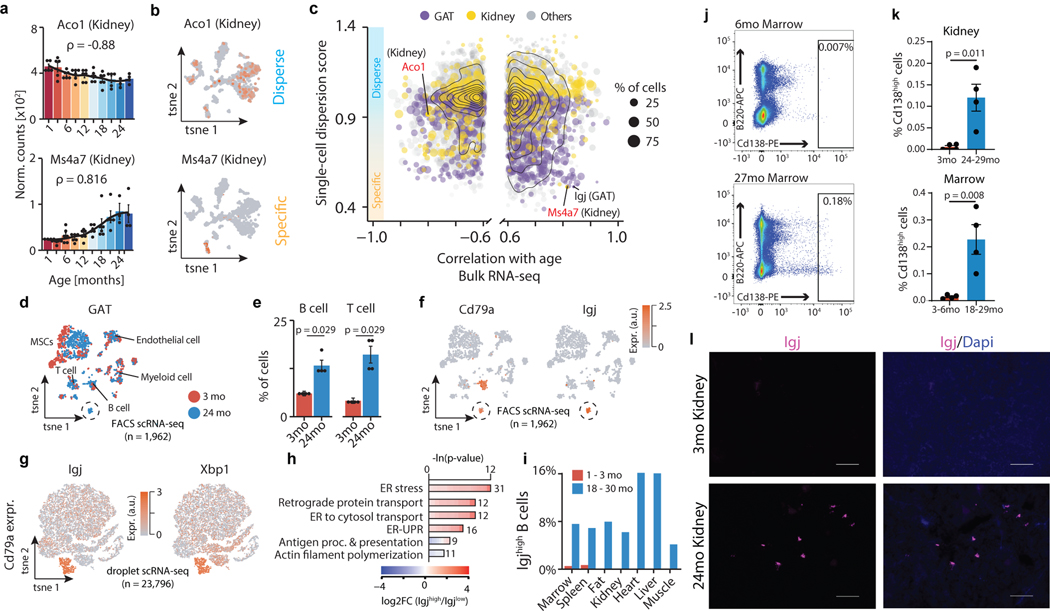
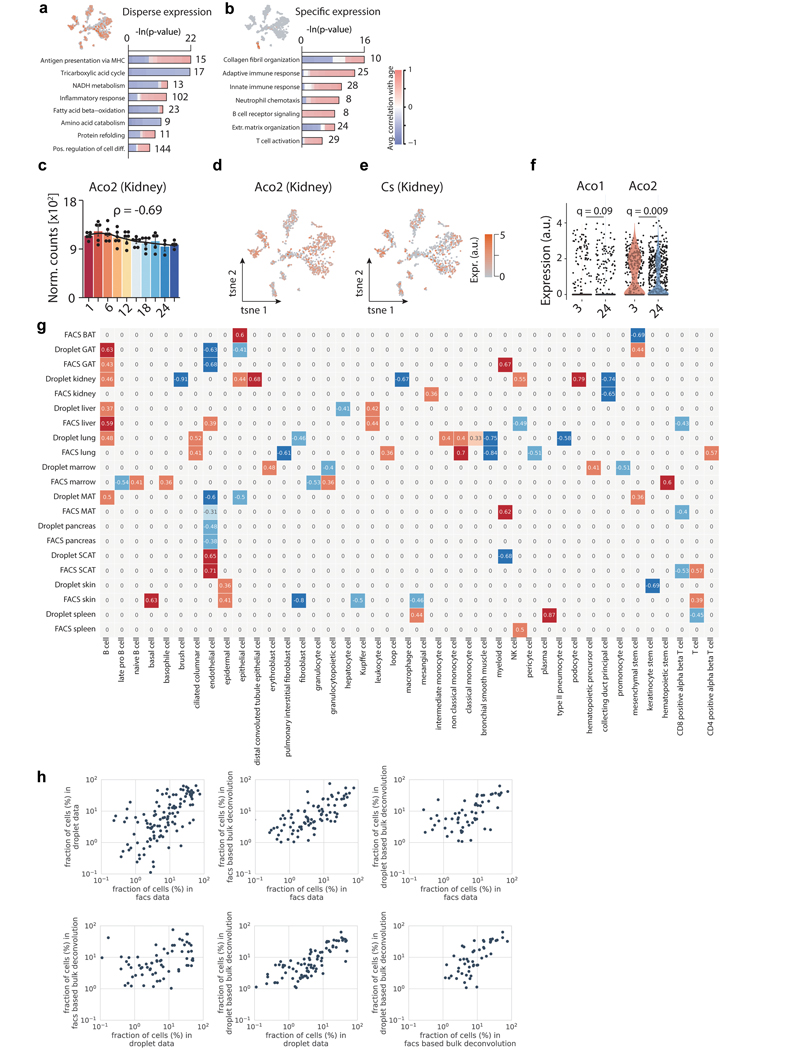
A fundamental question emerging from transcriptomics of whole organs is whether the observed expression shifts are driven by cell-intrinsic changes with age, or by changes in cell composition. Using our Tabula Muris Senis single-cell RNA-sequencing (scRNA-seq) aging database2,3, we first asked if the top genes correlated with age from bulk RNA-seq (Supplementary Table 8) were specific to an individual cell type, or broadly expressed in multiple cell types. For each gene in each tissue, we assigned a dispersion score based on the distribution of cells expressing that gene in the single-cell data (Fig. 3a–c). For example, in the kidney, aconitases Aco1 and Aco2, as well as citrate synthase (Cs), are negatively correlated with age and expressed across cell types, demonstrating an organ-wide decline of mitochondrial function (Extended Data Fig. 8a–f). Other genes, like Ms4a7, are positively correlated with age but expressed only in kidney macrophages (Fig. 3a–c). This is characteristic of many other upregulated inflammatory genes specific to these cells (Extended Data Fig. 8b). In addition to the dispersion score, we used deconvolution software with cell type-specific gene expression profiles from Tabula Muris Senis FACS-Smart-seq2 (FACS) and microfluidic-droplet (droplet) scRNA-seq data, separately, to estimate cell type abundance changes with age in each tissue (Extended Data Fig. 8h)11. Although the cell types and profiles captured with these two methods do not always overlap, in the 9 cases where both methods found the same cell type significantly changing in abundance with age with effect size greater than 0.5, the correlations are highly concordant. This revealed a strong increase in liver and GAT B cell numbers with age, providing further evidence that accumulating immune cells are a driver of the whole-organ inflammatory signal. Furthermore, cell fractions as profiled by the 4 methods (FACS scRNA-seq, droplet scRNA-seq, FACS bulk deconvolution, droplet bulk deconvolution) show strong agreement, indicating highly stable results (Extended Data Fig. 8g). Lastly, as demonstrated in Tabula Muris Senis, a combination of cell type abundance shifts and cell-intrinsic gene expression is present in most tissues. Although overall, cell type composition appears more significant.
Figure 3. Integration of bulk and single-cell transcriptomic data identifies cross-tissue infiltration of Igjhigh plasma B cells.
a, Aco1 and Ms4a7 kidney mRNA expression. LOESS regression indicated by black line. Spearman’s rank correlation coefficient ρ is indicated. Means ± SEM. b, A gene with ‘disperse’ (Aco1) and ‘specific’ (Ms4a7) single-cell expression pattern in kidney. n=1,108 cells. c, Single-cell dispersion scores (scRNA-seq) with Spearman’s rank correlation coefficient (≥ 0.6; bulk RNA-seq) for a given tissue. Color represents organ type. Dot size corresponds to % of cells per tissue expressing a given gene. d, t-SNE visualization of scRNA-seq data (FACS) from GAT, colored by age. A cluster of B cells present only in aged GAT is circled. e, GAT B and T cells as a percentage of all analyzed cells. n=4 independent animals. T-test, means ± SEM. f, Expression of B cell marker Cd79a and plasma B cell marker Igj. g, t-SNE visualization of scRNA-seq data (droplet) of all Cd79a-expressing cells present in the Tabula Muris Senis dataset (17 tissues), colored by the plasma B cell markers Igj and Xbp1. h, GO terms enriched among the top 300 marker genes of Igjhigh (n=1,198 cells) versus B cells (n=22,598 cells), with 1,886 genes passing filtering as background. q-values estimated with Benjamini-Hochberg for each database separately, and for GO classes (molecular function, cellular component, biological process) independently. i, Distribution of IgJhigh as percentages of Cd79a expressing cells per tissue. j, Representative FACS scatterplots from 2 independent experiments showing increased plasma cell abundance in aged bone marrow. Cd138, plasma cell marker. B220, B cell marker. k, FACS quantification for kidney and marrow. n=4 independent animals. T-test, means ± SEM l, Representative images from 2 independent experiments of Igj RNAscope of 3mo and 24mo kidney. Virtually no Igj signal was present in young kidneys. 100μm scale bar.
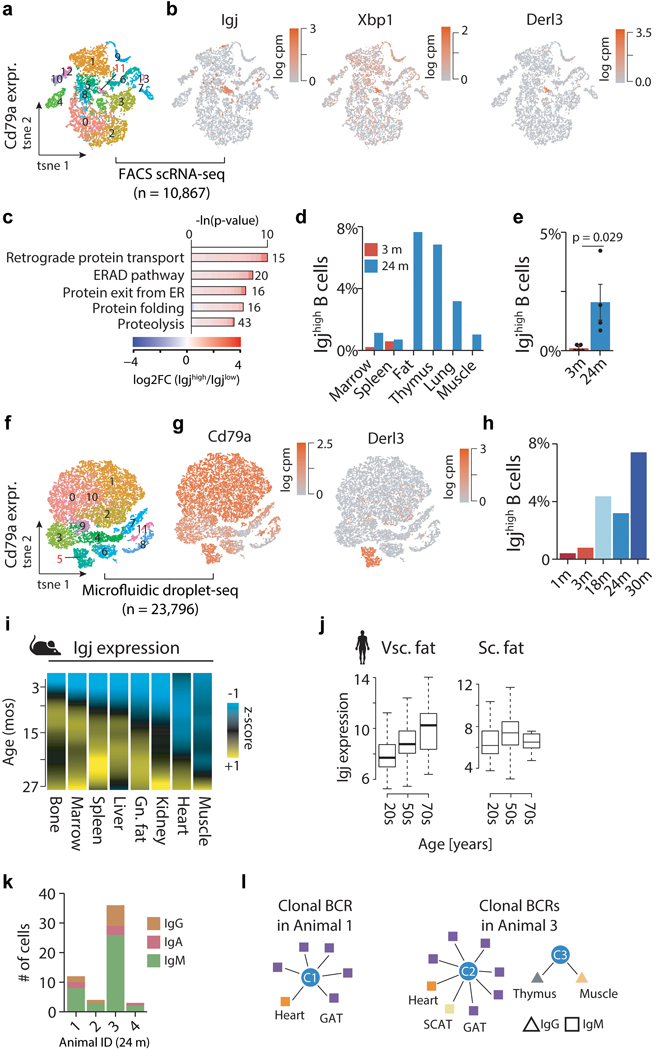
Cell type composition changes with age, especially regarding immune cell accumulation in tissues like visceral fat, is well established. However, we lack temporal and cell-specific resolution. Given that visceral fat expansion predicts morbidity and mortality12, we aimed to discover the origin of the age-related adipose inflammatory signature by using single-cell transcriptomic data from Tabula Muris Senis. We identified increasing numbers of gonadal adipose tissue T and B cells with age, including a unique cluster of Cd79+ B cells present only in old mice (Fig. 3d,e), consistent with increased expression of adaptive immune response genes in whole organs (Fig. 2a,g). Unbiased screening of genes enriched in this population uncovered high Igj expression (Fig. 3f, Supplementary Tables 11,13). Considering we observed Igj differential expression in 11 of 17 whole organs (Fig. 1g), we analyzed thousands of Cd79+ B cells across organs, revealing a unique cluster of Igjhigh cells in both the FACS scRNA-seq and droplet datasets, concordant with high expression of plasma B cell markers Xbp1 and Derl3 (Fig. 3g, Extended Data Fig. 9a,b,f,g). Relative to Igjlow cells, these cells show elevated unfolded protein response and endoplasmic reticulum stress pathways, characteristic of highly secretory plasma B cells (Fig. 3h, Extended Data Fig. 9c, Supplementary Tables 12,14)13. Strikingly, these plasma B cells originate almost entirely from aged mice, and indeed accumulate across diverse organs (Fig. 3i–l, Extended Data Fig. 9d,e,h, Supplemental Figure 1). Taking advantage of the high temporal resolution available with the whole-organ dataset, we also traced these cells across the lifespan via expression of Igj. We observed an initial increase of Igj in marrow, bone, and spleen, organs responsible for producing adaptive immune cells (Extended Data Fig. 9i). Interestingly, Igj and Derl3 become subsequently elevated in kidney and GAT near 12 months of age, preceding Igj elevation in BAT, heart, and lung. Igj expression also increases in human visceral and subcutaneous fat (GTEx data; Extended Data Fig. 9j). It is possible that the changes to chemokine signaling and cell surface receptors and ligands observed here may explain this differential accumulation. We then reconstructed the B cell receptor locus using scRNA-seq data, and observe that Igjhigh plasma cells are predominantly of the IgM class (Extended Data Fig. 9k). Of note, we detected several clones present across diverse tissues, suggesting that these cells are trafficked to tissues from a common origin (Extended Data Fig. 9l). The role of these cells or the specificity of the antibodies they produce is currently unknown, but it is tempting to speculate that they may contribute to the global increase in autoantibodies reported with aging14.
Plasma protein & organ mRNA correlation
Investigating organs individually can reveal detailed aging processes and even common phenotypes potentially susceptible to intervention. But aging occurs systemically, with the decline of one organ possibly inciting or accelerating dysfunction throughout the body. In part, this may be due to alterations to blood-borne factors which mediate intercellular and organ-organ communication. Spurred by heterochronic parabiosis experiments demonstrating rejuvenation15,16, we and others have identified plasma proteins with detrimental or rejuvenating functions in aging brain, muscle, pancreas, bone, and other organs17, as well as hundreds more correlated with human aging and associated with traits like cognition and grip strength18. However, the origins of these factors remain largely unknown.
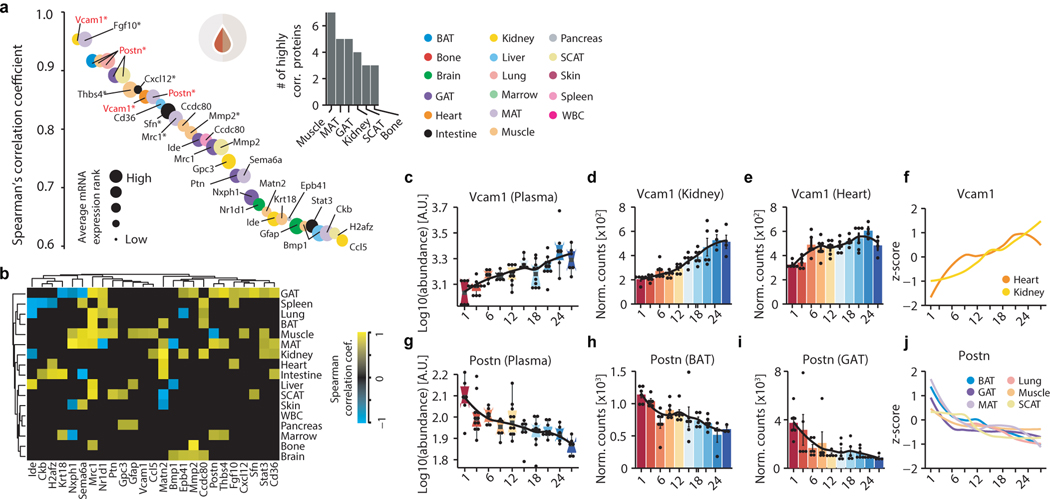
Here, we attempted to uncover organs contributing to age-related changes in the plasma proteome by correlating plasma protein age trajectories with their corresponding gene expression trajectories in each organ (Fig. 4a,b). This analysis revealed 25 plasma proteins correlated (Spearman correlation coefficient > 0.6) with gene expression in at least one organ, totaling 35 unique plasma protein/organ pairs. We discovered remarkably high correlation for several, such as vascular cell adhesion molecule-1 (Vcam1) in the kidney and fibroblast growth factor 10 (Fgf10) in the spleen, and other notable pairs such as glial fibrillary acidic protein (Gfap) and the brain. Especially interesting are Vcam1 and periostin (Postn), which both show exceptional correlation across several organs (Fig. 4c–j). Vcam1 was recently identified as a critical mediator of brain aging by old plasma19, and the loss of Postn in adipose tissues contributes to impaired lipid metabolism20. Furthermore, both are implicated in extracellular matrix regulation and fibrotic diseases, perhaps indicating age-related fibrosis. Throbospondin-4 (Thbs4), here decreasing with age and highly correlated with gene expression in muscle, was also recently discovered as a young blood-enriched protein that promotes synapse formation21. Interestingly, white adipose tissues emerge from this analysis as well, with 5 plasma proteins highly correlated with gene expression in visceral MAT and GAT, and 3 in SCAT (Fig. 4a). Surprisingly, limb muscle which shows a modest number of DEGs displays 7 plasma proteins correlated with gene expression across the lifespan, including Postn, bone morphogenic protein-1 (Bmp1), matrix metalloprotease-2 (Mmp2), and other extracellular matrix (EM)-associated proteins (Extended Data Fig. 10a). EM-associated proteins actually constitute a majority of the 25 plasma proteins we identified (Extended Data Fig. 10b). While these findings are intriguing, plasma proteins may change in abundance independent of gene expression differences. For example, a tissue may preferentially release certain proteins more with age. Furthermore, some tissues lack age-correlation, but show high gene expression of plasma proteins (Supplementary Table 10). Future research will determine if these gene expression changes do indeed contribute to functionally relevant age-related differences in the plasma proteome, or if they mediate other processes like immune cell adhesion and infiltration.
Figure 4. Plasma protein correlation with organ-specific gene expression.
a, Spearman correlation coefficient (≥ 0.6) between plasma proteins and corresponding organ-specific gene expression. * indicates q<0.05; Benjamini-Hochberg correction per tissue. Dot size corresponds to average gene expression across tissues. Top right: number of proteins correlated with gene expression in the top 6 organs. Analysis details in methods. b, Heatmap showing correlation coefficients for the top 25 plasma proteins in (a) across all organs. c, log-transformed plasma protein abundance of Vcam1. n=77 independent samples. Boxplot (mean, 1st & 3rd quartiles, min & max). d, e, Vcam1 mRNA expression in kidney (n=52) (d) and heart (n=52) (e). Black line: LOESS regression. Means ± SEM. f, Z-transformed, smoothed gene expression trajectory of Vcam1 in the kidney (n=52) and heart (n=52). g, log-transformed plasma protein abundance of Postn. n=77 independent samples. Box and whisker plots centered on mean. h, i, Postn mRNA expression in BAT (n=53) (h) and GAT (n=51). (i). Black line: LOESS regression. Means ± SEM. j, Z-transformed, smoothed gene expression trajectory of Postn in BAT (n=53), GAT (n=51), MAT (n=54), Lung (n=54), Muscle (n=52), SCAT (n=55). Means ± SEM.
Discussion
Altogether, our transcriptomic and plasma proteomic dataset offers unprecedented temporal resolution across the entire mouse lifespan for all major organs, and can serve as a fundamental resource to biologists across disciplines. We discovered gene expression trajectories consistent with previously identified deleterious processes like mitochondria dysfunction, impaired protein folding, and inflammaging. Furthermore, DEGs emerging in middle-age are highly correlated with those in late-life, suggesting that these harmful processes emerge early across diverse organs. With rejuvenation strategies like senescent cell ablation (senolytics), nutrient sensing manipulation (rapamycin and metformin), and plasma proteome alteration progressing rapidly, we need an improved understanding of where and when to apply these therapies22. Indeed, the common aging patterns observed here may help explain the profound healthspan benefits of such interventions. In closing, this organism-wide characterization of aging dynamics may accelerate therapeutic development, and the insights into circadian rhythm disruption, plasma cell accumulation, and adipose decline suggest avenues for renewed focus.
Methods
Mice and Organ Collection
Male and virgin female C57BL/6JN mice were shipped from the National Institute on Aging colony at Charles River (housed at 67–73 °F) to the Veterinary Medical Unit (VMU; housed at 68–76 °F)) at the VA Palo Alto (VA). At both locations, mice were housed on a 12-h light/dark cycle, and provided food and water ad libitum. The diet at Charles River was NIH-31, and Teklad 2918 at the VA VMU. Littermates were not recorded or tracked, and mice were housed at the VA VMU for no longer than 2 weeks before euthanasia, with the exception of mice older than 18mos, which were housed at the VA VMU beginning at 18mos of age. After anaesthetization with 2.5% v/v Avertin, mice were weighed, shaved, and blood was drawn via cardiac puncture before transcardial perfusion with 20 ml PBS. Whole organs were then dissected in the following order: pancreas, spleen, brain, heart, lung, kidney, mesenteric adipose tissue, intestine (duodenum), gonadal adipose tissue, muscle (tibialis anterior), skin (dorsal), subcutaneous adipose tissue (inguinal pad), brown adipose tissue (interscapular pad), bone and bone marrow (femurs and tibiae). Mice were randomized and organs collected from 8:30am – 4pm over several days. Organs were immediately snap frozen on dry ice. All animal care and procedures were carried out in accordance with institutional guidelines approved by the VA Palo Alto Committee on Animal Research.
Sample size, randomization, and blinding
No sample size choice was performed before the study. Randomization was performed in the case of mouse dissection order and during the preparation of 96-well plates for cDNA creation. Blinding was not performed: the authors were aware of all data and metadata-related variables during the entire course of the study.
RNA isolation and preparation
Snap-frozen bone and skin was crushed on liquid nitrogen with a mortar and pestle. Snap-frozen whole organs, or crushed bone or skin, were placed in TRIzol and immediately homogenized with a TissueRuptor in 50ml conicals (see Supplementary Table 15 for organ-specific details). Debris from the homogenate was pelleted in 1.5ml tubes at 12,000 × g for 5 minutes at 4°C. Supernatent was then transferred to a new 1.5ml tube where chloroform was added. After vortexing on max speed for 10 seconds, samples were transferred to 1.5ml or 2ml Phase Lock Gel tubes, where water was added before spinning at 12,000 × g for 5 minutes at 4°C. The aqueous phase was then transferred to a new tube, and after adding isopropanol, mixtures were vortexed at max speed for 10 seconds. Solutions were then run through RNeasy columns according to the manufacturer’s instructions, and eluted with the indicated volume of water. RNA was then quantified with a nanodrop, and frozen at −80°C.
cDNA synthesis, library preparation, sequencing, and data processing
Methods including cDNA synthesis using the Smart-seq2 protocol23, library preparation using an in-house version of Tn524,25, library pooling, quality control, sequencing, and data processing are provided at dx.doi.org/10.17504/protocols.io.2uvgew6.
Quality control and differential expression analysis
Samples with less than 4 million uniquely mapped reads were censored to exclude low-coverage samples. Data visualization and analysis were performed using custom Rstudio scripts and the following Bioconductor packages: Rtsne, Deseq226, topGO, destiny and org.Mm.eg.db. To assess the quality of our dataset, the raw count matrix was normalized using Deseq2 before conducting the built-in variance stabilizing transformation. Principal component analysis revealed that samples clustered mostly by tissue, with the exception of the white fat tissues. We also plotted our data after running t-SNE, using 500 iterations and retaining either 50 or 6 PCs, i.e. with most PCs or only the ones explaining the most variance, respectively. We further complemented these analyses with hierarchical clustering using Ward’s clustering algorithm. In order to detect whether samples within a given tissue would show profound clustering by age, we finally calculated diffusion maps using the R package destiny with default parameters.
To identify significant differential expression changes with age, we used the raw count matrix as recommended for Deseq2’s standard analysis pipeline. Factors and dispersion estimates were calculated for each tissue separately. We conducted differential expression analysis comparing samples from 3 months old mice to each consecutive time point, using age and sex as covariates. P-values were adjusted for multiple testing and genes with an adjusted p-value of below 0.05 were determined as statistically significant. In addition, we ran similar analyses using 1 month or 6 months old mice as reference.
To rank genes based on their regulation across tissues, we summarized in how many tissues a given gene would be called as significantly regulated in at least one comparison between samples from 3 months old mice and any following sampling time point.
Gene expression trajectory analysis
To estimate gene trajectories during aging, normalized counts from DEseq2 were z-scored and LOESS (Locally weighted scatterplot smoothing) regression was fitted for each gene using the median expression per age group in each tissue. Whole-organism trajectory per gene was estimated using the average trajectory across the 17 tissues. Organism-wide analysis focused on 11,403 genes expressed in all tissues (i.e. genes among the 15,000 most expressed genes in each tissue).
The distance matrix between whole-organism gene trajectories was computed using the Euclidian distance and hierarchical clustering was performed using the complete method. We identified 10 clusters of genes changing with age, ranging from 1 to 4,571 genes. Clusters 9 and 10 were excluded from further analysis as they included less than 10 genes.
To identify clusters changing the most between tissues, we computed an amplitude and variability index. The amplitude index corresponds to the z-score change (absolute value) of the average trajectory between 1 and 27mos. The variability index, which measures the spread of organ-trajectories, corresponds to the average Euclidian distance between each organ-specific trajectory and the organism-wide trajectory.
Reactome, KEGG and GO databases were queried to understand the biological functions of each cluster. We used the R TopGO27 package for GO analysis and the R clusterprofiler28 package for KEGG and Reactome analyses. The 11,403 genes expressed in all tissues served as the background set of genes against which to test for over-representation. Since clusterprofiler requires EntrezID as input, we mapped Gene Symbols to EntrezID using the org.Mm.eg.db29 package. When Gene Symbols were mapped to multiple EntrezID, only the 1st EntrezID was used. Q-values were estimated using Benjamini–Hochberg approach for the different databases taken separately. In addition, for GO analysis, q-values were calculated for the three GOs classes (molecular function, cellular component, biological process) independently.
Organ-specific clustering were performed using the 15,000 most expressed genes per tissue. For each tissue, five clusters were considered for further analysis and the pathways analysis used the corresponding background set of genes against which to test for over-representation.
Single-cell RNA-sequencing analysis (FACS scRNA-seq)
Pre-processed and annotated scRNA-seq data (FACS followed by Smart-seq2 protocol) from gonadal adipose tissue (3 and 24 months old) were obtained from the Tabula Muris Senis consortium. Given the lack of data from aged female mice, we focused our analyses on samples derived from male mice. Additionally, cells with less than 200 or more than 6,500 genes were excluded. This yielded 1,962 high quality cell transcriptomes derived from four young and four old biological replicates. Data visualization and analysis were performed using custom Rstudio scripts and the following Bioconductor packages: Seurat (version 3)30 and topGO. Data normalization and scaling was performed using Seurat’s built-in SCTransform31 function with default parameters. A shared-nearest-neighbors graph was constructed using the first 30 PC dimension before clustering cells using Seurat’s built-in FindClusters function with a resolution of 0.8 and default parameters. Annotations for B and T cells were adopted from the Tabula Muris Senis consortium. Cell numbers were normalized to the total number of detected cells and compared using standard t-tests. Igjhigh B cells formed a separate cluster and were identified using Seurat’s FindMarkers function (parameters: only.pos=T min.pct=0.15 thresh.use=0.25, test=’MAST’).
In order to profile Igjhigh B cells organism-wide, we obtained the complete and pre-processed scRNA-seq dataset (FACS followed by Smart-seq2 protocol) from the Tabula Muris Senis consortium – encompassing cells isolated from all major tissues. Focusing on data from male samples only, we filtered for cells showing detectable expression of the Cd79a gene (alpha chain of the B cell receptor). Cell transcriptomes were thus derived from four young and four old biological replicates. The resulting 10,867 cells were analyzed using Seurat, as described above. A shared-nearest-neighbors graph was constructed using the first 10 PC dimension before clustering cells using Seurat’s built-in FindClusters function with a resolution of 0.4 and default parameters. Igjhigh B cells formed a separate cluster (cluster 11; 129 cells). To characterize Igjhigh-specific expression profile, Seurat’s FindMarkers function (parameters: only.pos=F min.pct=0.15 thresh.use=0.25, test=‘MAST’) was run comparing the cluster of Igjhigh B cells against all other Cd79a cells in the dataset. Functional enrichment analysis of the top 300 differentially expressed genes (sorted by adjusted p-value) were compared to all 1,051 genes passing the filtering parameters for the test. Top-ranked GO terms were selected and visualized using the CellPlot package (https://github.com/dieterich-lab/CellPlot). The full-length GO terms were shortened to fit into the figure format; the complete table of significantly enriched GO terms and associated genes can be found in Supplementary Table 12.
Single-cell RNA-sequencing analysis (Microfluidic droplet)
The Tabula Muris Senis consortium encompasses scRNA-seq data generated with microfluidic droplets, allowing to profile more cells without prior selection of surface markers32. In order to profile Igjhigh B cells organism-wide, we obtained the complete and pre-processed droplet dataset. Focusing on data from male samples only, we filtered for cells showing detectable expression of the Cd79a gene. Cell transcriptomes were derived from the following sampling time points: 2× 1 month old, 2× 3 months old, 2× 18 months, 4× 24 months and 3× 30 months. The resulting 23,796 cells were analyzed using Seurat, as described above. A shared-nearest-neighbors graph was constructed using the first 10 PC dimension before clustering cells using Seurat’s built-in FindClusters function with a resolution of 0.4 and default parameters. Igjhigh B cells formed a separate cluster (cluster 5; 1,198 cells). To characterize Igjhigh-specific expression profile, Seurat’s FindMarkers function (parameters: only.pos=F min.pct=0.15 thresh.use=0.25, test=‘MAST’) was run comparing the cluster of Igjhigh B cells against all other Cd79a cells in the dataset. Functional enrichment analysis of the top 300 differentially expressed genes (sorted by adjusted p-value) were compared to all 1886 genes passing the filtering parameters for the test. Top-ranked GO terms were selected and visualized using the CellPlot package (https://github.com/dieterich-lab/CellPlot). The full-length terms were shortened to fit into the figure format; the complete table of significantly enriched GO terms and associated genes can be found in Supplementary Table 14.
Plasma proteomic analysis
All animal care and procedures were carried out in accordance with institutional guidelines approved by the VA Palo Alto Committee on Animal Research. Sixty-five male (n=5–6 per age group, 1mo/3mo/6mo/9mo/12mo/15mo/18mo/21mo/24mo/ 27mo/30mo) and 16 virgin female (n=4 per age group, 3mo/12mo/18mo/21mo) C57BL/6JN mice were shipped from the National Institute on Aging colony at Charles River (housed at 67–73 °F) to the Veterinary Medical Unit (VMU; housed at 68– 76 °F)) at the VA Palo Alto (VA). Mice were provided food (NIH-31 at Charles River, and Teklad 2918 at the VA VMU) and water ad libitum. Mice were housed on a 12-h light/dark cycle at both places. Mice older than 18- months were housed at the VA VMU until they reached the experimental age. Mice younger than 18- months were housed for less than 2 weeks at the VA VMU. After anaesthetization with 2.5% v/v Avertin, blood was drawn via cardiac puncture. EDTA-plasma was isolated by centrifugation at 1,000g for 10 min at 4 °C. Samples were aliquoted, stored at −80 °C and sent on dry ice to SomaLogic Inc. (Boulder, Colorado, US).
The SomaLogic platform is primarily designed to detect and measure human proteins. In order to reduce the influence of cross-species effects on our analysis, we first determined proteins in our dataset with high evolutionary conservation between mouse and humans. To this end, we downloaded the plain text file containing all homologies between mouse and human along with sequence identifiers for each species (HOM_MouseHumanSequence.rpt) from MGI (http://www.informatics.jax.org/). Next, reference protein sequences for human and mouse were downloaded from UniProt (https://www.uniprot.org/). Using the R “Biostrings” library a global pairwise sequence alignment has been carried out between the human and mouse sequences. Further, only sequences with identity of 80% across the whole alignment were included in the downstream analyses.
To determine the effect of age on the plasma proteome, relative fluorescent units (RFUs) provided by Somalogic were log10- and linear models adjusted for age and sex were used. Type II sum of squares (SS) were calculated using R car package33 and q-values were estimated using Benjamini–Hochberg (B.H.) approach34.
Raw protein abundance data as measured by the Somalogic platform were scaled (z-transformed) before calculating the median across all replicates for each sampled age time point to obtain an average trajectory. Normalized RNA-seq counts after pre-processing with DESeq2 were transformed for each tissue alike. In order to compare plasma protein changes with shifts in mRNA expression in any tissue, we calculated pairwise Spearman’s rank correlation coefficients between a given protein trajectory with the expression trajectory for its corresponding gene in each tissue separately. Thus, a given protein could be correlated with expression changes in multiple tissues. In order to limit our analysis to mRNA /protein pairs reflecting robust changes, we filtered the resulting mRNA/protein correlations as follows: (1) The protein had to exhibit a sequence homology between human and mouse of at least 75% (770 proteins). (2) The protein had to change significantly with age according to the linear modeling analysis (q<0.05; 115 proteins). (3) The corresponding gene had to be differentially expressed in the given tissue in at least one pairwise comparison between 3 months old mice and any consecutive time point (q<0.05; 95 proteins). (4) The mRNA /protein profiles had to exhibit a Spearman’s rank correlation of at least 0.6 (25 proteins; 35 protein/gene pairs). BH correction per tissue was applied to assess significance of proteins / mRNA profiles correlations. Given that genes can be expressed at differing levels across tissues, we additionally calculated average mRNA expression ranks for each gene. To this end, we ranked for a given gene each tissue on its average mRNA expression, based on DESeq2’s baseMean.
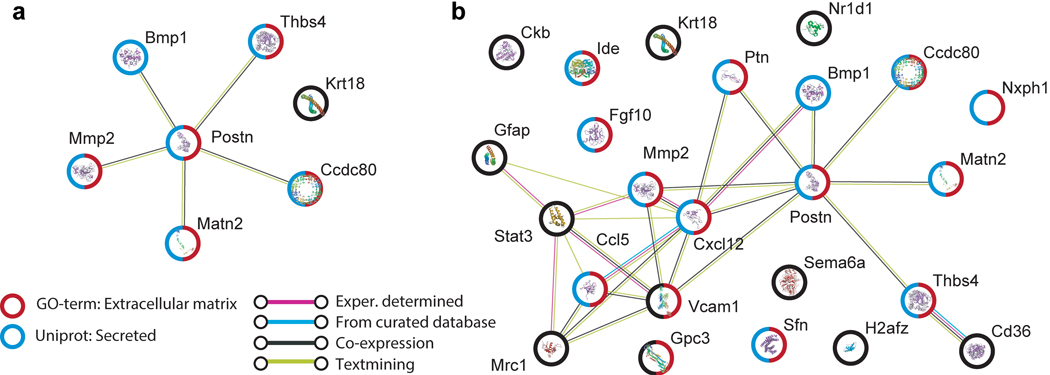
To investigate connectivity networks between top proteins correlated with organ gene expressed, we used String version 11.0, available at https://string-db.org/35.
Correlation analysis of gene expression and ageing using self-organizing maps (SOM).
For every gene a tissue-wise Spearman’s rank correlation coefficient was computed based on the expression and age. Similarly, we computed Spearman’s rank correlation coefficients for expression and sex. The resulting correlation matrix was then filtered, such that only genes that were significantly correlated with either age or sex in any tissue (P < 0.01 after false discovery rate adjustment with the Benjamini-Hochberg procedure34) were considered. This matrix was then used to create a self-organizing map (SOM)36 with the Kohonen R package (version 3.0.8)37. In addition to Spearman’s rank correlation coefficients for comparing gene expression and sex we also tested other measures, such as log transformed P-values from one-sided Wilcoxon Ranksum test (testing both, i.e. “greater” and “less” alternatives and flipping the sign if the “greater” alternative yielded a lower P-value) and Somers’ D. Since the different approaches gave similar results we stayed for gender and age with the Spearmann correlation for better comparability.
Specificity of gene expression for tissues and ages.
To identify how specific a gene is expressed at a certain time point or in a certain tissue we employed an approach known from gene set analysis, so-called gene set enrichment analysis (GSEA). Instead of computing how significantly a biological category is enriched in a sorted list of genes, we computed how enriched a certain tissue, age, or pair of tissue/age is enriched in each gene. For each gene we computed 10 enrichment scores for the 10 ages, 17 enrichment scores for the 17 tissues and 170 enrichment scores for the combinations of them. The specificity is defined as the difference between the maximal enrichment and second maximal enrichment for all tissues, time points and combinations. The higher the difference is the more specific is the gene either for a tissue, time point or the combination thereof. Notably, the maximal enrichment score can be translated into p-values, e.g. by random sampling. For better comparability we present however the running sum directly and do not translate them to p-values. Here, the approach is referred to as Sample Set Enrichment Analysis (SSEA).
Estimating the variance of the data depending on metadata.
To estimate the variance in the data depending on age, tissue or gender we made use of Principal Variance Component Analysis (PVCA) as implemented in the Bioconductor Package pvca. PVCA combines the strength of principal component analysis and variance components analysis (VCA). Originally it has been applied to quantify batch effects in microarray data. In our case we however do not provide experimental batches but rather groups of meta data as input.
Human transcriptomic data: Human gene expression data were obtained from the GTEx portal website (http://www.gtexportal.org/). Read counts from the GTEx analysis v7 (GTEx_Analysis_2016–01-15_v7_RNASeQCv1.1.8_gene_reads.gct) were normalized using yarn38.
Single-cell dispersion score
We first selected FACS cells from Tabula Muris Senis with more than 500 distinct genes and 50k reads. Due to the lower number of female replicates, we considered only four 3-month-old and four 24-month-old males. We then created log (1+CPM) transformed single-cell count matrices per tissue, calculated a 16-dimensional PCA from this data for each tissue, and embedded each cell in a 16-dimensional latent space using the PCA components. Note that the dimensionality of the PCA was chosen based on the explained variance per component. For each gene in each tissue, we then selected those cells expressing it (log (1+CPM) > 0), and calculated their weighted center in the single-cell latent space, where we considered normalized gene expression values as weights. We then defined the “single-cell dispersion” as the weighted mean distance of the cells from their center, normalizing within each tissue to enable cross-tissue comparisons. Finally, we defined methodology to systematically analyze gene: we computed for each gene per tissue the Spearman correlation of its bulk Deseq2 normalized gene expression with aging. We then plotted the single-cell dispersion against the Spearman’s rank correlation coefficient for each bulk aging DEG.
Cell intrinsic gene expression versus cell abundance
We first selected FACS cells from Tabula Muris Senis with more than 500 distinct genes and 50k reads. Due to the lower number of female replicates, we considered only males. We then used the log (1 + CPM) transformed data, and considering each tissue separately, we binned these cells into young (≤3mo; Y) and old (>3mo; O). For each gene, we then calculated the log2 fold-change of cell counts and read counts between Y and O, where cell count is defined as the fraction of cells within the tissue expressing the gene (log (1+CPM) > 0), and read count is defined as the mean read count of the gene in the cells that express it. Next, we analyzed each gene in the bulk data, first computing the Spearman correlation of DESeq2 normalized gene expression with age. We then binned genes into those increasing with age (Spearman > 0.7; I) and decreasing with age (Spearman < 0.7; D). Finally, we compare the single-cell log2 Y vs. O cell and read counts with the bulk correlations I and D by running the Wilcoxon-Mann-Whitney test, to determine if single-cell data based cell or read count changes separate the bulk groups I and D. We then plot the resultant read and cell count U-statistics against the corresponding p-value for each tissue for the droplet and FACS single-cell data separately.
Deconvolution with CIBERSORTX
We first used the signature matrix creation feature of CiberSortX11, which detects cell type-specific signature genes using annotated single-cell data. As input, we used male cells from Tabula Muris Senis of every age to create tissue-specific signature matrices from the FACS and droplet data, separately. Consistent with cell selection criteria used through the manuscript, we selected droplet cells with more than 500 distinct genes and 5k reads, and more than 500 distinct genes and 50,000 reads from FACS cells. We input single-cell normalized CPM data without log transformation, as well as CPM bulk tissue data on which to perform deconvolution. Deconvolution was performed in S-mode due to the possibility of high technical variance, with all other parameters set to default, and the resultant inferred cell type fractions were correlated with age using Spearman’s rank correlation.
Igj and plasma cell validation experiments
RNAscope Multiplex Fluorescent Reagent Kit v2 was used on fresh frozen kidney sections 20um thick from 3-month-old and 24-month-old C57BL/6JN male mice, with Igj-C1 probes and Opal 690 Reagent Pack (Akoya Biosciences FP1497001KT), with no modifications to the kit instructions. Images were acquired at 20x on a Keyence BZ-X710 fluorescence microscope.
Cell suspensions for fluorescence activated cell sorting (FACS) of plasma cells were generated from gonadal adipose tissue (GAT) and kidney. Following cardiac perfusion with PBS, tissues were immediately dissected and minced to a paste with scissors. Samples were resuspended in 40ml buffer (GAT: 10% horse serum in F12; kidney 2% FBS in RPMI) and passed through a 100um filter into a 50ml conical tube, grinding with a syringe plunger to further dissociate clumps. Filters were washed with 5ml buffer, and all 45ml was then passed through a 35um filter, washing with another 5ml buffer. Filtered cells were then pelleted (500 × g, 5 minutes, 4°C) and treated with 10ml ACK lysis buffer for 5 minutes at room temperature. After pelleting, washing with 5ml buffer, and pelleting again, cells were resuspended in 1ml FACS buffer (2% FBS in PBS), and aliquoted through 35um strainer caps into FACS tubes. Cells were pelleted and resuspended in the antibody cocktail: Cd138-PE (1:400; Biolegend142504), Cd19-BV421 (1:200; Biolegend 115538), B220-APC (1:100; Biolegend 103212) for 30min on ice. After pelleting and resuspending, cells were stained with 1ul 1:1000 Sytox Green (Thermo S7020) immediately before sorting on a BD FACS Aria III. Gates were set to capture live singlets and reduce debris according to standard procedures, and Cd138high cells were quantified.
Extended Data
Extended Data Figure 1. Gene expression variance analysis.
a, Visualization of the Principal Variance Component Analysis, displaying the gene expression variance explained by residuals (i.e. biological and technical noise) or experimental factors such as tissue, age, sex, and respective combinations. n=904 total samples b, c, t-SNE visualization of all samples, based on the first 6 principal components colored by age (b) and sex (c). d, Hierarchical clustering of all samples using Ward’s algorithm. Samples are annotated by tissue, sex and age. Highlighted are samples clustering by sex in selected tissues. Non-specific clustering of samples derived from white adipose tissues is further highlighted.
Extended Data Figure 2. Validation of differential gene expression analysis.
a, Heatmap displaying the number of DEGs per tissue for pairwise analysis on adjacent time points. b, Heatmap displaying the number of DEGs per tissue for pairwise comparisons with a 1mo reference. c, Heatmap displaying the number of DEGs per tissue for pairwise comparisons with a 6mo reference. d, Boxplot (mean, 1st & 3rd quartiles) representation displaying the number of DEGs per tissue (n=17 tissues) for pairwise comparisons with a 3mo reference. Outliers show tissues undergoing exceptionally strong expression shifts at a given age. e, Enrichment for functional categories in the top100 genes differentially expressed in the most tissues (ranked using pairwise comparisons with a 3mo reference). Pathway enrichment with GO, Reactome, and KEGG databases. Enrichment was tested using Fisher’s exact test (GO) and the hypergeometric test (Reactome and KEGG). To estimate the contribution of each tissue, we used the number of genes per pathway in the top100 DEGs and estimated the percentage of significant genes per tissue. q-values estimated with Benjamini-Hochberg for each database separately, and for GO classes (molecular function, cellular component, biological process) independently. n as in (d). f, Cumulative sum of DEGs per tissue in the ranked top100 genes. g, Number of DEGs per tissue in the top100 genes. n=54 (MAT), 52 (kidney), 52 (GAT), 54 (spleen), 50 (liver), 54 (lung), 50 (intestine), 55 (SCAT), 51 (skin), 53 (BAT), 52 (heart), 52 (muscle), 53 (brain), 52 (WBC), 54 (bone), 51 (marrow), 46 (pancreas). q-values as in (e). h, STRING analysis of the top 30 genes in Figure 1g.
Extended Data Figure 3. Self-organizing maps of gene correlation with age and sex.
Self-organizing maps (SOMs) were generated from transcriptome-wide gene expression correlation (Spearman’s rank correlation coefficient) of each gene (n=12,462 genes) with age (a) and sex (b). Genes with similar correlation are mapped to the same cell, and cells grouped by similarity. The SOM cell layout is common across organs, with the average across all organs at bottom.
Extended Data Figure 4. Sex-specific expression changes across organs.
a, Smoothed lineplot displaying the number of DEGs between female and male animals at each age. Positive (negative) values represent up-regulated (down-regulated) genes. Grey lines: all other tissues. b, Heatmap representation of (a). c, mRNA expression of Apoe in GAT and Axin2 in spleen. Black line: LOESS regression. n=45 (GAT) and n=47 (spleen) independent samples. d, Venn diagrams depicting the overlap of DEGs between females and males detected at 3mo and 18mo of age in GAT, SCAT, liver and kidney. One-sided Fisher’s exact test. *** P<0.0001. e-h, Top 10 GO terms enriched among the DEGs between females and males at 18mo of age in GAT (e), SCAT (f), liver (g) and kidney (h). Means ± SEM. n=2 (females) & n=4 (males) independent animals for each organ. q-values estimated with Benjamini-Hochberg for each database separately, and for GO classes (molecular function, cellular component, biological process) independently.
Extended Data Figure 5. Organs-specific gene expression dynamics.
For each of the 17 organs (rows), the average trajectory of the 15,000 most highly expressed genes is represented in the 1st column and unsupervised hierarchical clustering was used to group genes with similar trajectories (columns 2). Five clusters were used (columns 3–7) for further analysis. Average trajectory for each cluster +/− SD are represented.
Extended Data Figure 6. Pathway enrichment analysis of organ-specific clusters.
Clusters from Extended Data Figure 5 show enrichment for genes in functional categories. Pathway enrichment was tested using GO, Reactome, and KEGG databases. Enrichment was tested using Fisher’s exact test (GO) and the hypergeometric test (Reactome and KEGG). The top 5 pathways for each cluster are shown. q-values estimated with Benjamini-Hochberg for each database separately, and for GO classes (molecular function, cellular component, biological process) independently. Sample size per cluster / tissue is indicated in Extended Data Figure 5.
Extended Data Figure 7. Cytokine and transcription factor analysis.
a, Age-related changes for inflammatory cytokine/chemokine (Cytokine mediated signaling pathways GO:0019221; n=501 genes), and transcription factors (TRANSFAC database; n=334 genes). Thicker lines surrounded by white represent the average trajectory for each cluster, +/− standard deviation. b, c, Spearman correlation coefficient for aging genes in (a).
Extended Data Figure 8. Integration of bulk and single-cell transcriptomic data.
a, b, Representative GO terms enriched among the genes with highly disperse (a) and cell-specific (b) expression patterns. n=1,108 cells. q-values estimated with Benjamini-Hochberg for each database separately, and for GO classes (molecular function, cellular component, biological process) independently. c, Kidney Aco2 mRNA expression. Black line: LOESS regression. ρ: Spearman’s rank correlation coefficient. n=52 independent samples. Means ± SEM. d, e, t-SNE visualization of scRNA-seq data (FACS) from the kidney, colored by expression of Aco2 (d) and Cs (e) n=1,108 cells. f, Violin plot representing expression of Aco1 and Aco2 across all profiled cell types in the kidney. Points indicate cell-wise expression levels and violin indicates average distribution split by age. T-test. n=325 cells (3mo) and 783 cells (24mo). g, Spearman’s rank correlation for cell type fractions significantly (P<0.05) changing with age, based on deconvolution with FACS or droplet scRNA-seq expression signatures. n=38 (facs bat), n=37 (droplet gat), n=37 (facs gat), n=34 (droplet kidney), n=35 (facs kidney), n=35 (droplet liver), n=35 (facs liver), n=37 (droplet lung), n=37 (facs lung), n=38 (droplet marrow), n=36 (facs marrow), n=38 (droplet mat), n=39 (facs mat), n=34 (droplet pancreas), n=32 (facs pancreas), n=37 (droplet scat), n=38 (facs scat), n=35 (droplet skin), n=33 (facs skin), n=36 (droplet spleen), n=37 (facs spleen) independent samples. h, Pairwise comparisons cell fractions between scRNA-seq (FACS), scRNA-seq (droplet), FACS-based bulk RNA-seq deconvolution, and droplet-based bulk RNA-seq deconvolution. Each point represents an individual cell type in an individual tissue type.
Extended Data Figure 9. Identifying Igjhigh B cells with FACS and droplet scRNA-seq.
a, t-SNE visualization of all Cd79a-expressing cells present in the Tabula Muris Senis FACS dataset (17 tissues). Colored clusters as identified with the Seurat software toolkit. Igjhigh B cell cluster 11 highlighted. n=10,867 cells. b, t-SNE in (a) colored by the Igjhigh B cell markers Igj, Xbp1 and Derl3. c, GO terms enriched among the top 300 marker genes of Igjhigh (n=129 cells) versus Igjlow(n=10,738 cells)(FACS). q-values estimated with Benjamini-Hochberg for each database separately, and for GO classes (molecular function, cellular component, biological process) independently. d, Distribution of Igjhigh as percentages of Cd79a expressing cells per tissue. e, Percentage of Igjhigh B cells of all Cd79a expressing cells across all tissues. n=5 (3mo) & n=4 (24mo) independent animals. T-test, means ± SEM. f, t-SNE visualization of all Cd79a-expressing cells present in the Tabula Muris Senis droplet dataset (17 tissues). Colored clusters as identified with the Seurat software toolkit. IgJhigh B cell cluster 5 highlighted. n=23,796 cells. g, t-SNE in (f) colored by the B cell marker Cd79a and Igjhigh B cell marker Derl3. h, Percentage of Igjhigh B cells of all Cd79a expressing cells across all tissues. i, Heatmap of the z-transformed Igj expression trajectories across bone (n=54), marrow (n=51), spleen (n=54), liver (n=50), GAT (n=52), kidney (n=52), heart (n=52), muscle (n=52). j, mRNA expression change of Igj in human visceral fat (20s n=25; 50s n=124; 70s n=12) and subcutaneous fat (20s n=32; 50s n=149; 70s n=13) (data from GTEx consortium). Boxplot (median, 1st and 3rd quartiles). k, Number of Igjhigh B cells with successfully assembled B cell receptor locus, split by animal and immunoglobulin class. l, Clonally amplified Igjhigh B cells as detected in animal 1 and 3, grouped by tissue of origin (color) and immunoglobulin class (shape).
Extended Data Figure 10. STRING analysis of top correlating plasma proteins.
a, The top 7 plasma proteins correlated with gene expression in muscle, colored by pathway. b, the top 25 plasma proteins correlated with gene expression in any organ.
Acknowledgements
We thank members of the Wyss-Coray laboratory for volunteering help during organ collection and processing: Elizabeth Berber, Kyle Brewer, Betty Chang, Julia Marschallinger, Liana Bonanno, Jerry Sun, Maria F. Lugo-Fagundo, Andrew Yang, M. Windy McNerny. We also thank the members of the Wyss-Coray laboratory and the Chan-Zuckerberg Biohub for feedback and support, and H. Zhang and K. Dickey for laboratory management. This work was funded by the Department of Veterans Affairs (BX004599 to T.W.-C.), the National Institute on Aging (R01-AG045034 and DP1-AG053015 to T.W.-C.), the NOMIS Foundation (T.W.-C.), The Glenn Foundation for Medical Research (T.W.-C.), and the Wu Tsai Neurosciences Institute (T.W.-C.).
Appendices
Tabula Muris Senis Author Affiliations
A full list of consortium author contributions can be found in the supplementary material.
Nicole Almanzar25, Jane Antony1, Ankit S. Baghel1, Isaac Bakerman1,9,10, Ishita Bansal1, Ben A. Barres20, Philip A. Beachy1,11,13,14, Daniela Berdnik4, Biter Bilen2, Douglas Brownfield11, Corey Cain12, Charles K. F. Chan35, Michelle B. Chen6, Michael F. Clarke1, Stephanie D. Conley3, Spyros Darmanis3, Aaron Demers3, Kubilay Demir1,13, Antoine de Morree2, Tessa Divita3, Haley du Bois4, Hamid Ebadi3, F. Hernán Espinoza11, Matt Fish1,13,14, Qiang Gan2, Benson M. George1, Astrid Gillich11, Rafael Gòmez-Sjöberg3, Foad Green3, Geraldine Genetiano3, Xueying Gu14, Gunsagar S. Gulati1, Oliver Hahn2, Michael Seamus Haney2, Yan Hang14, Lincoln Harris3, Mu He33, Shayan Hosseinzadeh3, Albin Huang2, Kerwyn Casey Huang3,6,30, Tal Iram2, Taichi Isobe1, Feather Ives3, Robert Jones3, Kevin S. Kao1, Jim Karkanias3, Guruswamy Karnam15, Andreas Keller2,5, Aaron M. Kershner1, Nathalie Khoury2, Seung K. Kim14,36, Bernhard M. Kiss1,16, William Kong1, Mark A. Krasnow11,13, Maya E. Kumar17,18, Christin S. Kuo11,13,25, Jonathan Lam14, Davis P. Lee4, Song E. Lee2, Benoit Lehallier2, Olivia Leventhal4, Guang Li19, Qingyun Li20, Ling Liu2, Annie Lo3, Wan-Jin Lu1,11, Maria F. Lugo-Fagundo4, Anoop Manjunath1, Andrew P. May3, Ashley Maynard3, Aaron McGeever3, Marina McKay3, M. Windy McNerney21,22, Bryan Merrill30, Ross J. Metzger23,24, Marco Mignardi6, Dullei Min25, Ahmad N. Nabhan11, Norma F. Neff3, Katharine M. Ng11, Patricia K. Nguyen1,9,10,19, Joseph Noh1, Roel Nusse11,13,14, Róbert Pálovics2, Rasika Patkar15, Weng Chuan Peng14, Lolita Penland3, Angela Oliveira Pisco3, Katherine Pollard34, Robert Puccinelli3, Zhen Qi3, Stephen R. Quake3,6, Thomas A. Rando2,4,7, Eric J. Rulifson14, Nicholas Schaum1,2, Joe M. Segal15, Shaheen S. Sikandar1, Rahul Sinha1,26−28, Rene V. Sit3, Justin Sonnenburg3,30, Daniel Staehli2, Krzysztof Szade1,29, Michelle Tan3, Weilun Tan3, Cristina Tato3, Krissie Tellez14, Laughing Bear Torrez Dulgeroff1, Kyle J. Travaglini11, Carolina Tropini30, Margaret Tsui15, Lucas Waldburger3, Bruce M. Wang15, Linda J. van Weele1, Kenneth Weinberg25, Irving L. Weissman1,26−28, Michael N. Wosczyna2, Sean M. Wu1,9,19, Tony Wyss-Coray2,4,7,8, Jinyi Xiang1, Soso Xue6, Kevin A Yamauchi3, Andrew C. Yang6, Lakshmi P. Yerra2, Justin Youngyunpipatkul3, Brian Yu3, Fabio Zanini6, Macy E. Zardeneta4, Alexander Zee3, Chunyu Zhao3, Fan Zhang23,24, Hui Zhang4, Martin Jinye Zhang31,32, Lu Zhou20, James Zou3,31,37
1 Institute for Stem Cell Biology and Regenerative Medicine, Stanford University School of Medicine, Stanford, California, USA.
2 Department of Neurology and Neurological Sciences, Stanford University School of Medicine, Stanford, California, USA.
3 Chan Zuckerberg Biohub, San Francisco, California, USA.
4 Veterans Administration Palo Alto Healthcare System, Palo Alto, California, USA.
5 Clinical Bioinformatics, Saarland University, Saarbrücken, Germany.
6 Department of Bioengineering, Stanford University, Stanford, California, USA.
7 Paul F. Glenn Center for the Biology of Aging, Stanford University School of Medicine, Stanford, California, USA.
8 Wu Tsai Neurosciences Institute, Stanford University School of Medicine, Stanford, California, USA.
9 Stanford Cardiovascular Institute, Stanford University School of Medicine, Stanford, California, USA
10 Department of Medicine, Division of Cardiology, Stanford University School of Medicine, Stanford, California, USA
11 Department of Biochemistry, Stanford University School of Medicine, Stanford, California, USA
12 Flow Cytometry Core, V.A. Palo Alto Healthcare System, Palo Alto, California, USA
13 Howard Hughes Medical Institute, USA
14 Department of Developmental Biology, Stanford University School of Medicine, Stanford, California, USA
15 Department of Medicine and Liver Center, University of California San Francisco, San Francisco, California, USA
16 Department of Urology, Stanford University School of Medicine, Stanford, California, USA
17 Sean N. Parker Center for Asthma and Allergy Research, Stanford University School of Medicine, Stanford, California, USA
18 Department of Medicine, Division of Pulmonary and Critical Care, Stanford University School of Medicine, Stanford, California,
19 Department of Medicine, Division of Cardiovascular Medicine, Stanford University, Stanford, California, USA
20 Department of Neurobiology, Stanford University School of Medicine, Stanford, CA USA
21 Mental Illness Research Education and Clinical Center, V.A. Palo Alto Healthcare System, Palo Alto, California, USA
22 Department of Psychiatry, Stanford University School of Medicine, Stanford, California, USA
23 Vera Moulton Wall Center for Pulmonary and Vascular Disease, Stanford University School of Medicine, Stanford, California, USA
24 Department of Pediatrics, Division of Cardiology, Stanford University School of Medicine, Stanford, California, USA
25 Department of Pediatrics, Pulmonary Medicine, Stanford University School of Medicine, Stanford, California, USA
26 Department of Pathology, Stanford University School of Medicine, Stanford, California, USA
27 Ludwig Center for Cancer Stem Cell Research and Medicine, Stanford University School of Medicine, Stanford, California, USA
28 Stanford Cancer Institute, Stanford University School of Medicine, Stanford, California, USA
29 Department of Medical Biotechnology, Faculty of Biophysics, Biochemistry and Biotechnology, Jagiellonian University, Poland
30 Department of Microbiology & Immunology, Stanford University School of Medicine, Stanford, California, USA
31 Department of Electrical Engineering, Stanford University, Palo Alto, 94304 USA
32 Department of Epidemiology, Harvard T.H. Chan School of Public Health, Boston, Massachusetts, USA
33 Department of Physiology, University of California, San Francisco, CA 94158
34 Department of Epidemiology and Biostatistics, University of California, San Francisco, CA 94158
35 Department of Surgery, Division of Plastic and Reconstructive Surgery, Stanford University, Stanford, California USA
36 Department of Medicine and Stanford Diabetes Research Center, Stanford University, Stanford, California USA
37 Department of Biomedical Data Science, Stanford University, Palo Alto, 94304 USA
Footnotes
Supplementary Information is available in the online version of the paper.
The authors declare no competing financial interests.
Code Availability
All code was limited to the commercial software listed in the methods and reporting summary.
Data Availability
Raw data are available on GEO (GSE132040).
Reviewer Information Nature thanks the anonymous reviewers for their contributions to the peer review of this work.
Supplementary Material
Supplemental Figure 1. Plasma cell FACS gating schematic. Example gating strategy used to quantify CD138high plasma cells.
References
- 1.López-Otín C, Blasco MA, Partridge L, Serrano M & Kroemer G The hallmarks of aging. Cell 153, (2013). [DOI] [PMC free article] [PubMed] [Google Scholar]
- 2.The Tabula Muris Consortium. A single-cell transcriptomic atlas characterizes aging tissues in the mouse. BioRxiv doi: 10.1101/661728. [DOI] [PMC free article] [PubMed] [Google Scholar]
- 3.The Tabula Muris Consortium. Single-cell transcriptomics of 20 mouse organs creates a Tabula Muris. Nature 562, 367–372 (2018). [DOI] [PMC free article] [PubMed] [Google Scholar]
- 4.Palmer AK & Kirkland JL Aging and adipose tissue: potential interventions for diabetes and regenerative medicine. Exp. Gerontol. 86, 97–105 (2016). [DOI] [PMC free article] [PubMed] [Google Scholar]
- 5.Kohonen T The self-organizing map. Proc. IEEE 78, 1464–1480 (1990). [Google Scholar]
- 6.Austad SN & Fischer KE Sex Differences in Lifespan. Cell Metab. 23, 1022–1033 (2016). [DOI] [PMC free article] [PubMed] [Google Scholar]
- 7.Fuente-Martín E, Argente-Arizón P, Ros P, Argente J & Chowen JA Sex differences in adipose tissue. Adipocyte 2, 128–134 (2013). [DOI] [PMC free article] [PubMed] [Google Scholar]
- 8.Zhang Y et al. Transcriptional profiling of human liver identifies sex-biased genes associated with polygenic dyslipidemia and coronary artery disease. PLoS One 6, (2011). [DOI] [PMC free article] [PubMed] [Google Scholar]
- 9.Sabolić I et al. Gender differences in kidney function. Pflugers Arch. Eur. J. Physiol. 455, 397–429 (2007). [DOI] [PubMed] [Google Scholar]
- 10.Hood S & Amir S The aging clock: circadian rhythms and later life. J Clin Invest 127, 437–446 (2017). [DOI] [PMC free article] [PubMed] [Google Scholar]
- 11.Newman AM et al. Determining cell type abundance and expression from bulk tissues with digital cytometry. Nat Biotechnol 37, 773–782 (2019). [DOI] [PMC free article] [PubMed] [Google Scholar]
- 12.Kuk JL et al. Visceral fat is an independent predictor of all-cause mortality in men. Obesity 14, 336–341 (2006). [DOI] [PubMed] [Google Scholar]
- 13.Shaffer AL et al. XBP1, downstream of Blimp-1, expands the secretory apparatus and other organelles, and increases protein synthesis in plasma cell differentiation. Immunity 21, 81–93 (2004). [DOI] [PubMed] [Google Scholar]
- 14.Vadasz Z, Haj T, Kessel A & Toubi E Age-related autoimmunity. BMC Med. 11, 1 (2013). [DOI] [PMC free article] [PubMed] [Google Scholar]
- 15.Conboy I et al. Rejuvenation of aged progenitor cells by exposure to a young systemic environment. Nature 433, 760–764 (2005). [DOI] [PubMed] [Google Scholar]
- 16.Villeda SA et al. Young blood reverses age-related impairments in cognitive function and synaptic plasticity in mice. Nat. Med. (2014). doi: 10.1038/nm.3569 [DOI] [PMC free article] [PubMed] [Google Scholar]
- 17.Castellano JM Blood-Based Therapies to Combat Aging. Gerontology 65, 84–89 (2019). [DOI] [PMC free article] [PubMed] [Google Scholar]
- 18.Lehallier B et al. Undulating changes in human plasma proteome profiles across the lifespan. Nature Medicine (in press). [DOI] [PMC free article] [PubMed] [Google Scholar]
- 19.Yousef H et al. Aged blood impairs hippocampal neural precursor activity and activates microglia via brain endothelial cell VCAM1. Nat. Med. (2019). doi: 10.1038/s41591-019-0440-4 [DOI] [PMC free article] [PubMed] [Google Scholar]
- 20.Graja A et al. Loss of periostin occurs in aging adipose tissue of mice and its genetic ablation impairs adipose tissue lipid metabolism. Aging Cell 17, (2018). [DOI] [PMC free article] [PubMed] [Google Scholar]
- 21.Gan KJ & Südhof TC Specific factors in blood from young but not old mice directly promote synapse formation and NMDA-receptor recruitment. Proc. Natl. Acad. Sci. 201902672 (2019). doi: 10.1073/pnas.1902672116 [DOI] [PMC free article] [PubMed] [Google Scholar]
- 22.Mahmoudi S, Xu L & Brunet A Turning back time with emerging rejuvenation strategies. Nat. Cell Biol. 21, 32–43 (2019). [DOI] [PMC free article] [PubMed] [Google Scholar]
- 23.Picelli S et al. Full-length RNA-seq from single cells using Smart-seq2. Nat. Protoc. 9, 171–81 (2014). [DOI] [PubMed] [Google Scholar]
- 24.Reinius B et al. Tn5 transposase and tagmentation procedures for massively scaled sequencing projects. Genome Res. 24, 2033–2040 (2014). [DOI] [PMC free article] [PubMed] [Google Scholar]
- 25.Hennig BP et al. Large-Scale Low-Cost NGS Library Preparation Using a Robust Tn5 Purification and Tagmentation Protocol. G3 Genes, Genomes, Genet. 8, 79–89 (2018). [DOI] [PMC free article] [PubMed] [Google Scholar]
- 26.Love MI, Huber W & Anders S Moderated estimation of fold change and dispersion for RNA-seq data with DESeq2. Genome Biol. 15, 550 (2014). [DOI] [PMC free article] [PubMed] [Google Scholar]
- 27.Alexa A & Rahnenfuhrer J topGO: Enrichment Analysis for Gene Ontology. (2016). [Google Scholar]
- 28.Yu G, Wang LG, Han Y & He QY clusterProfiler: an R package for comparing biological themes among gene clusters. OMICS 16, 284–287 (2012). [DOI] [PMC free article] [PubMed] [Google Scholar]
- 29.Carlson M org.Mm.eg.db: Genome wide annotation for Mouse. (2017). [Google Scholar]
- 30.Butler A, Hoffman P, Smibert P, Papalexi E & Satija R Integrating single-cell transcriptomic data across different conditions, technologies, and species. Nat. Biotechnol. 36, 411–420 (2018). [DOI] [PMC free article] [PubMed] [Google Scholar]
- 31.Hafemeister C & Satija R Normalization and variance stabilization of single-cell RNA-seq data using regularized negative binomial regression. bioRxiv 576827 (2019). doi: 10.1101/576827 [DOI] [PMC free article] [PubMed] [Google Scholar]
- 32.Zheng GXY et al. Massively parallel digital transcriptional profiling of single cells. Nat. Commun. 8, 1–12 (2017). [DOI] [PMC free article] [PubMed] [Google Scholar]
- 33.Fox J & Weisberg S An R Companion to Applied Regression, (SAGE Publications, 2011) [Google Scholar]
- 34.Benjamini Y & Hochberg Y Controlling the False Discovery Rate: A Practical and Powerful Approach to Multiple Testing. Journal of the Royal Statistical Society. Series B (Methodological) 57, 289–300 (1995). [Google Scholar]
- 35.Szklarczyk D et al. STRING v11: Protein-protein association networks with increased coverage, supporting functional discovery in genome-wide experimental datasets. Nucleic Acids Res. 47, D607–D613 (2019). [DOI] [PMC free article] [PubMed] [Google Scholar]
- 36.Kohonen Teuvo. “The self-organizing map.” Proceedings of the IEEE 78.9 (1990): 1464–1480. [Google Scholar]
- 37.Wehrens Ron, and Lutgarde MC Buydens. “Self-and super-organizing maps in R: the Kohonen package.” Journal of Statistical Software 21.5 (2007): 1–19.21494410 [Google Scholar]
- 38.Paulson JN et al. Tissue-aware RNA-Seq processing and normalization for heterogeneous and sparse data. BMC Bioinformatics 18, 1–10 (2017). [DOI] [PMC free article] [PubMed] [Google Scholar]
Associated Data
This section collects any data citations, data availability statements, or supplementary materials included in this article.
Supplementary Materials
Supplemental Figure 1. Plasma cell FACS gating schematic. Example gating strategy used to quantify CD138high plasma cells.


