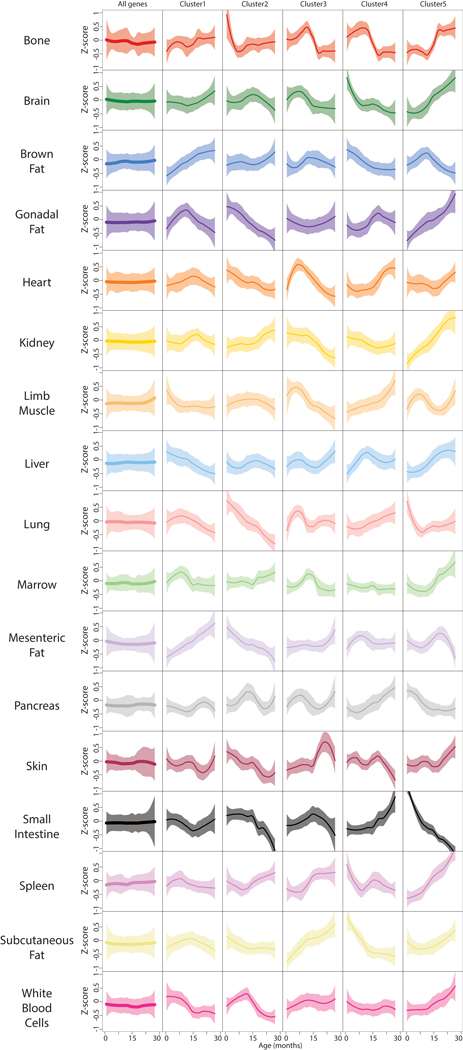
Extended Data Figure 5. Organs-specific gene expression dynamics.
For each of the 17 organs (rows), the average trajectory of the 15,000 most highly expressed genes is represented in the 1st column and unsupervised hierarchical clustering was used to group genes with similar trajectories (columns 2). Five clusters were used (columns 3–7) for further analysis. Average trajectory for each cluster +/− SD are represented.

