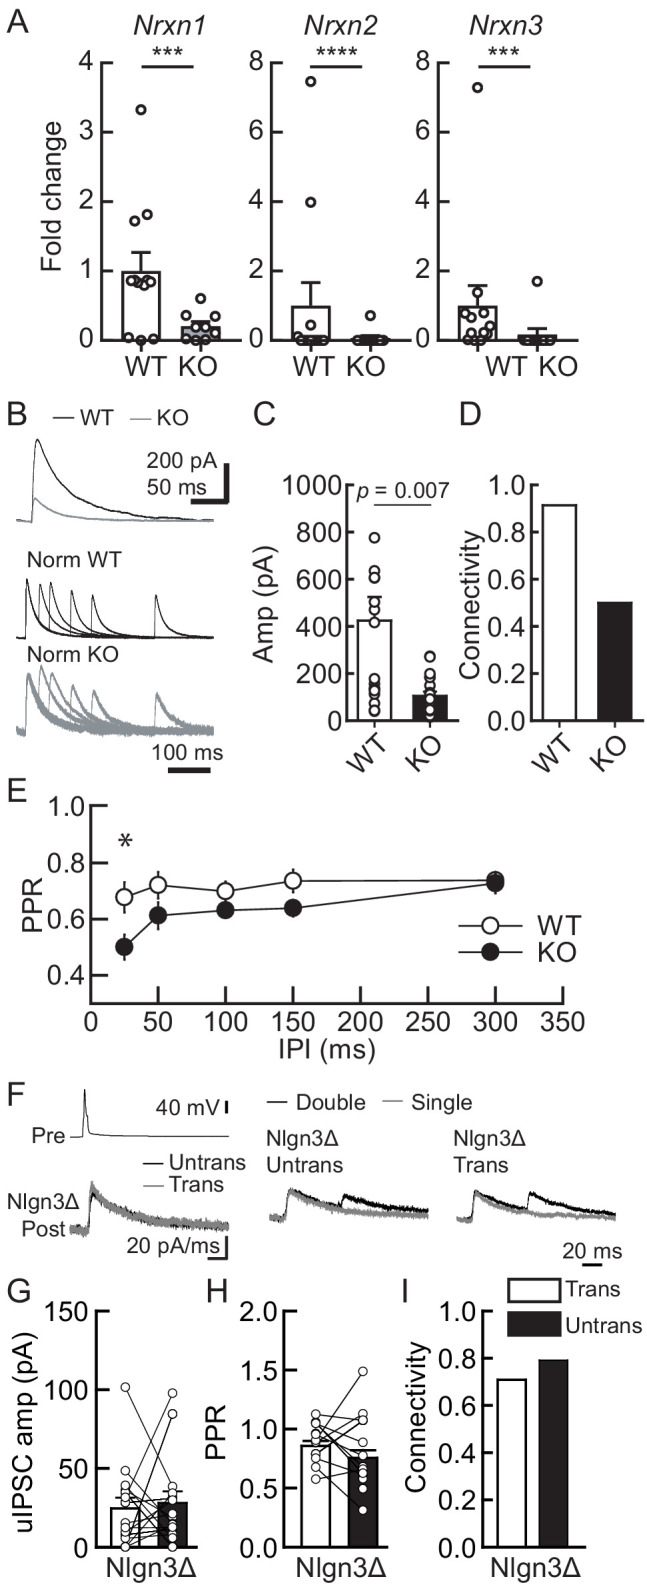
Figure 5. Lack of presynaptic Nrxns reduces inhibitory synaptic transmission and abolishes the potentiation effect of Nlgn3Δ in VGT3+ inhibitory synaptic transmission.
Effects of Nlgn3Δ isoform overexpression (OE) in hippocampal CA1 pyramidal neurons in the absence of presynaptic Nrxn input in VGT3+ interneurons. (A) Validation of the NrxnTKO/VGT3/RFP mouse line. Expression of Nrxn genes were compared in TdTomato-positive VGT3+ neurons in organotypic hippocampal slice cultures prepared from wild-type (WT) (VGT3/RFP) and knockout (KO) (NrxnTKO/VGT3/RFP) mice. qPCRs against Nrxn 1, 2, 3 and Gapdh (internal control) were performed for single-cell cDNA libraries prepared from TdTomato-positive neurons. Number of neurons: WT (N = 9, three mice) and KO (7, 2). ***p<0.001, ****p<0.0001 (Student’s t-test). (B–E) Effect of Nrxn triple KO on VGT3+ interneuron-mediated inhibitory synaptic transmission. (B) Left top, averaged sample traces of a single presynaptic action potential (AP) evoked in a NrxnTKO VGT3+ interneuron. Left bottom, superimposed averaged sample traces of unitary inhibitory postsynaptic current (uIPSC) (Untrans: black; trans: dark gray) induced by an AP. Right, superimposed averaged sample traces of uIPSCs evoked by single (dark gray) and double (black) APs in NrxnTKO VGT3+ interneurons. Summary of uIPSC amplitude (C), paired-pulse ratio (PPR) (D), and connectivity (E). Number of cell pairs: WT (N = 23, six mice) and KO (35, 7). *p<0.05 (two-way ANOVA with Sidak’s post hoc test). (F–I) Effect of Nlgn3Δ OE on NrxnTKO VGT3+ interneuron-mediated inhibitory synaptic transmission. (F) Left top, averaged sample traces of a single presynaptic AP evoked in a NrxnTKO VGT3+ interneuron. Left bottom, superimposed averaged sample traces of uIPSC (Untrans: black; trans: dark gray) induced by an AP. Right, superimposed averaged sample traces of uIPSCs evoked by single (dark gray) and double (black) APs in NrxnTKO VGT3+ interneurons. Summary of uIPSC amplitude (G), PPR (H), and connectivity (I). Open circles connected with bars represent individual pairs of cells (C, D, G, and H). Bar graphs indicate mean ± SEM. N = 18 cell pairs (three mice). The number of tested slice cultures is the same as that of cell pairs. Mann–Whitney U-test.

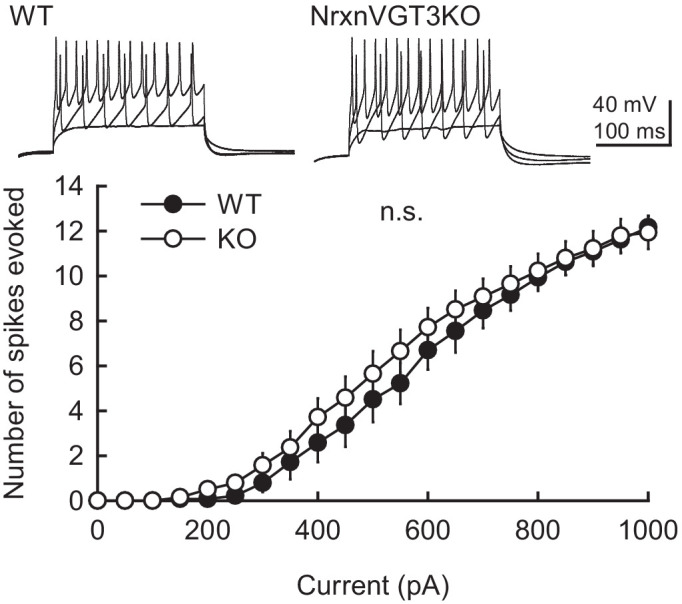
Figure 5—figure supplement 1. Membrane excitability is not altered in VGT3+ interneurons in NrxnTKO/VGT3/RFP mice.

