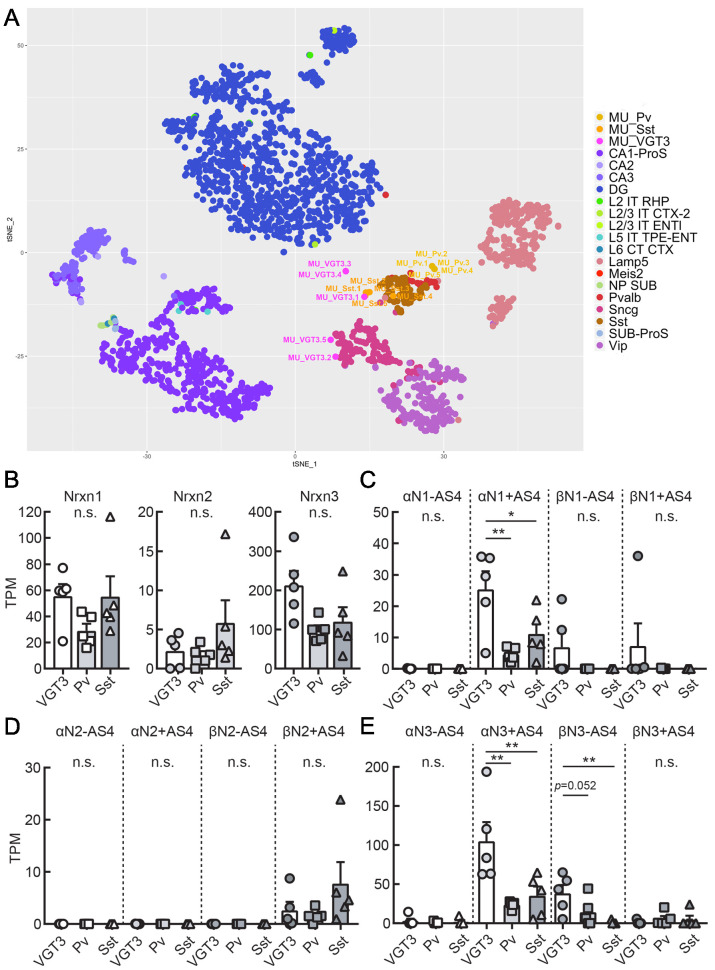
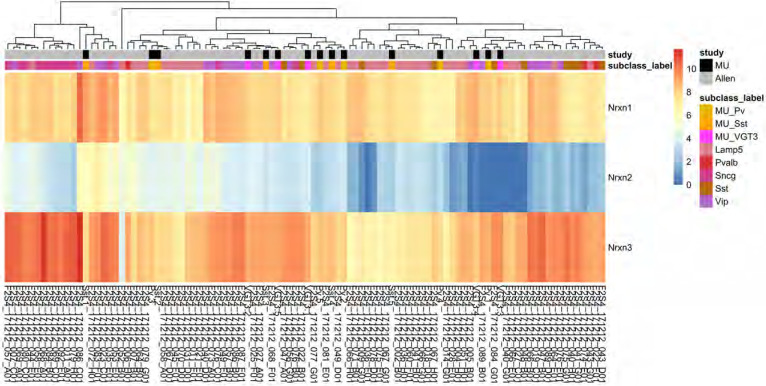
Figure 7. Transcriptomic similarity and endogenous Nrxn expression in hippocampal VGT3+, Pv+, and Sst+ inhibitory interneurons.
(A) Single-cell t-SNE plot of 15 single cells obtained from VGT3+ (magenta: MU_VGT3.1–5), Pv+ (yellow: MU_Pv.1–5), and Sst+ (orange: MU_Sst.1–5) interneurons compared to Allen Brain Atlas single cells (CA1-ProS; CA1-prosubiculum, CA2; CA2, CA3; CA3, DG; dentate gyrus, L2 IT RHP; Layer2, intratelencephalic, retrohippocampal region, L2/3 IT CTX-2; Layer2/3, intratelencephalic, cortical region, L2/3 IT ENTl; Layer2/3, intratelencephalic, lateral entorhinal area, L5 IT TPE-ENT; Layer5, intratelencephalic, temporal, perirhinal, and ectorhinal area, L6 CT CTX; Layer6, near-projecting (NP), L6 corticothalamic (CT), Lamp5; Lamp5-positive, Meis2; Meis2-positive, NP SUB; near-projecting, subiculum, Pvalb; Pvalb-positive, Sncg; Sncg-positive, Sst; Sst-positive, SUB-ProS; subiculum-prosubiculum, Vip; Vip-positive). (B) Summary bar graph of Nrxn gene (Nrxn1, 2, and 3) expression in VGT3+, Pv+, and Sst+ interneurons. (C–E) Summary graphs of splice isoforms of Nrxn1 (C), 2 (D), and 3 (E) in VGT3+, Pv+, and Sst+ interneurons. *p<0.05, one-way ANOVA followed by Sidak’s multiple comparisons test or Mann–Whitney U-test, N = 5 cells for each interneuron type.


