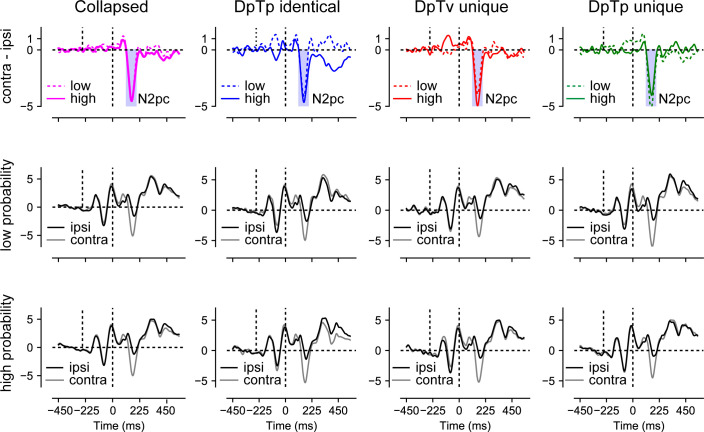
Figure 7. No effect of distractor or target expectations on the target-evoked N2pc.
This figure displays ERP results from search trials with lateral targets collapsed across all conditions (column 1) and separately for each condition (columns 2–4) and the low- and high-probability distractor locations (rows 2 and 3, respectively). Row one shows the difference between contra- and ipsilateral waveforms for low- and high-probability location. Microvolts are plotted on the y-axes. Blue transparent rectangles in row one show the mean averaging windows for N2pc analyses.

