. 2020 Oct 29;9:e62071. doi: 10.7554/eLife.62071

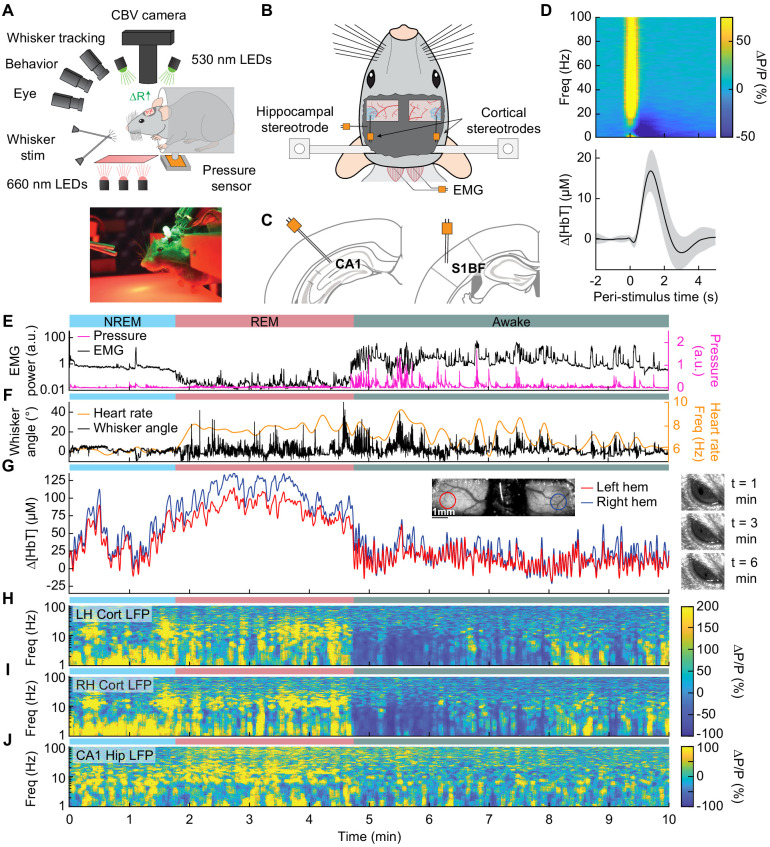
Figure 1. Sleep drives large changes in cerebral blood volume.

(A) Schematic of IOS experimental setup. The brain is illuminated with 530 nm LEDs, and changes in reflected light captured by a CCD camera mounted above the head. Other cameras track the whiskers (illuminated by 660 nm LEDs beneath the animal), the eye (illuminated by 780 nm LEDs), and changes in animal behavior. A piezo sensor to record changes in body motion is located beneath the animal, which rests head-fixed in a cylindrical tube. Tubes direct air to the distal part of the whiskers (but not the face), and do not interfere with volitional whisking. (B) Schematic showing the locations of the bilateral thinned-skull windows and recording electrodes. Each electrode consists of two Teflon-coated tungsten wires (~100 µm tip spacing), while the EMG electrode consists of two stainless-steel wires with several mm of insulation stripped off each end, inserted into adjacent nuchal muscles. (C) Left: Diagram showing hippocampal CA1 recording site. Right: Diagram of somatosensory cortex recording site. Adapted from Figure (52) (left) and Figure (42) (right) of The Mouse Brain in Stereotactic Coordinates, 3rd Edition (Franklin and Paxinos, 2007). (D) Average neural and hemodynamic responses to contralateral whisker stimulation (n = 14 mice, 28 hemispheres, 110 ± 70 stimulations per animal). Top: average normalized change in LFP power (∆P/P) in the somatosensory cortex in response to contralateral whisker stimulation. Bottom: mean change in total hemoglobin (∆[HbT]) within the ROI. Shaded regions indicate ± 1 standard deviation. (E-J) Example showing the hemodynamic and neural changes accompanying transitions among the NREM, REM and awake states. (E) Plot of nuchal muscle EMG power and body motion via a pressure sensor located beneath the mouse. (F) Plot of the whisker position and heart rate (G) Changes in total hemoglobin ∆[HbT] within the ROIs. Inset shows images of the two windows and respective ROIs. (H,I) Normalized left and right vibrissae cortex LFP power (∆P/P). (J) Normalized CA1 LFP power.

Figure 1.

Figure 1—figure supplement 1. Localization of electrodes and hemodynamic regions of interest.

Figure 1—figure supplement 1.

(A) Image of a cortical window showing cortical vasculature. (B) Peak pixel-wise cross-correlation (1–2 s lag) between gamma band power [30–100 Hz] and pixel reflectance during the first 60 min of data. (C) Same as (B) For multi-unit activity (300–3000 Hz). The peak cross-correlation was used to localize a 1 mm diameter region of interest (ROI). (D) Histological example of a coronal section stained with cytochrome oxidase (CO). Small holes in the slice indicate the location of cortical stereotrodes in the vibrissa barrel cortex. Adapted from Figure (39) of The Mouse Brain in Stereotactic Coordinates, 3rd Edition (Franklin and Paxinos, 2007). (E) Histological example of a coronal section stained with CO. Electrode path is visible and terminates in the CA1 region of hippocampus. Adapted from Figure (52) of The Mouse Brain in Stereotactic Coordinates, 3rd Edition (Franklin and Paxinos, 2007).

Figure 1—figure supplement 2. Whisker stimulation causes increases in neural activity and blood volume.

Figure 1—figure supplement 2.

Comparisons between contralateral, ipsilateral, and auditory whisker stimulation and the corresponding changes in vibrissa cortical MUA/LFP, hippocampal MUA/LFP, and hemodynamic changes (reflectance/[HbT]) (n = 14 mice, 28 hemispheres). (A–C) Contralateral whisker stimulation caused large increases in vibrissa cortical MUA power (78.1 ± 66.7%) in comparison to ipsilateral (30.8 ± 37.5%) and auditory (13.7 ± 16.8%) stimulation. (D–F) LFP gamma band power increased (110.4 ± 96.7%) in comparison to ipsilateral (36.8 ± 32.8%) and auditory stimulation (17.4 ± 15.7%). (G–I) All three forms of stimulation caused relatively similar changes in hippocampal MUA power (contralateral: 60.1 ± 34.3%, ipsilateral: 57 ± 33.4%, auditory: 42 ± 41.8%) and in (J–R) LFP gamma band power (contralateral: 32.5 ± 17.2%, ipsilateral: 28 ± 14.3%, auditory: 18.6 ± 8.1%). Contralateral whisker stimulation caused increases in total hemoglobin ∆[HbT] (16.8 ± 5.1 µM corresponding to a −2.4 ± 0.7% reflectance) larger than those from ipsilateral (9 ± 3.5 µM, −1.3 ± 0.5%) and auditory (4.8 ± 2.3 µM, −0.7 ± 0.3%) stimulation.

Figure 1—figure supplement 3. Volitional whisking causes increases in neural activity and hemodynamics.

Figure 1—figure supplement 3.

Changes in vibrissa cortical MUA/LFP, hippocampal MUA/LFP, and blood volume during whisking events of various durations (0.5–2 s, 2–5 s, > 5 s) (n = 14 mice, 28 hemispheres). (A–C) Extended whisking caused larger increases in vibrissa cortical MUA power (16.5 ± 10.8%) in comparison to moderate (9.7 ± 7%) and brief (5 ± 4.8%) durations. (D–F) LFP gamma band power was higher during extended whisking (19.2 ± 18.9%) in comparison to moderate (15.1 ± 16.3%) and brief (6.7 ± 9.2%) durations. (G–I) Whisking drives increases in hippocampal MUA power (brief: 5.1 ± 5%, moderate: 12 ± 7.7%, extended: 16.9 ± 10.1%) and in (J–R) LFP gamma band power (brief: 5.7 ± 11.7%, moderate: 13.9 ± 14.3%, extended: 18.4 ± 14.9%). Extended whisking caused increases in total hemoglobin ∆[HbT] (12.1 ± 5.6 µM corresponding to a −1.7 ± 0.8% reflectance) that were larger than those seen in moderate (7.1 ± 3.3 µM, −1 ± 0.5%) and brief (2.5 ± 1.4 µM, −0.4 ± 0.2%) duration whisking events.

Figure 1—figure supplement 4. Amplitude of hemodynamic oscillations is largest during NREM and REM sleep.

Figure 1—figure supplement 4.

(A) The peak-to-peak amplitude of ∆[HbT] oscillations during awake rest (32.3 ± 4.4 µM) were significantly smaller than those during contiguous NREM (87.3 ± 9.9 µM, GLME, p<9 × 10−32) and contiguous REM (142.1 ± 20.7 µM, GLME, p<1.5 × 10−53) sleep. (B) Mean peak ∆[HbT] of individual awake resting events (17 ± 3.2 µM) were significantly smaller than the peaks during contiguous NREM (69.8 ± 10.7 µM, GLME, p<1.1 × 10−37) and contiguous REM (107.7 ± 13.3 µM, GLME, p<3.5 × 10−55) sleep (n = 14 mice, 28 hemispheres). (C) Peak-to-peak amplitude of ∆D/D oscillations during awake rest (16.6 ± 4 µM) were significantly smaller by those during contiguous NREM (38 ± 15.8%, GLME, p<3.6 × 10−10) and contiguous REM (59.9 ± 15 µM, GLME, p<3.3 × 10−16) sleep. (D) Mean peak ∆D/D of individual awake resting events (7.4 ± 2.6 µM) were significantly smaller than the peaks during contiguous NREM (26.4 ± 10.1 µM, GLME, p<1.9 × 10−14) and contiguous REM (49.9 ± 9.1 µM, GLME, p<2 × 10−24) sleep (awake rest: n = 6 mice, 29 arterioles, contiguous NREM: n = 6 mice, 21 arterioles, contiguous REM: n = 5 mice, 10 arterioles). *p<0.05, **p<0.01, ***p<0.001 GLME.

Figure 1—figure supplement 5. Sleep drives hemodynamic fluctuations larger than awake behaviors.

Figure 1—figure supplement 5.

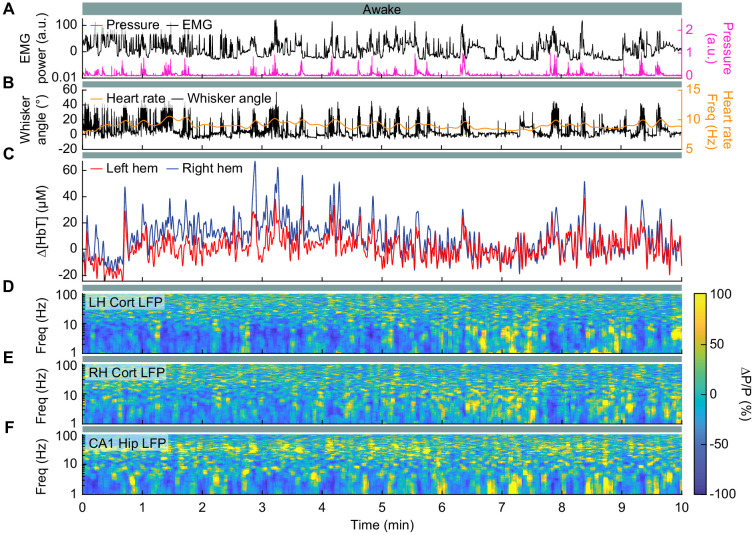
Examples showing the hemodynamic and neural changes accompanying transitions among the NREM, REM and awake states. (A) Plot of nuchal muscle EMG power and body motion via a pressure sensor located beneath the mouse. (B) Plot of the whisker position and heart rate. (C) Changes in total hemoglobin ∆[HbT] within the ROIs over the putative vibrissa cortex. (D) Normalized left vibrissae cortex LFP power (∆P/P). (E), Normalized right vibrissae cortex LFP power. (F) Normalized CA1 LFP power.

Figure 1—figure supplement 6. Sleep drives hemodynamic fluctuations larger than awake behaviors.

Figure 1—figure supplement 6.

Examples showing the hemodynamic and neural changes accompanying transitions among the NREM, REM and awake states. (A) Plot of nuchal muscle EMG power and body motion via a pressure sensor located beneath the mouse. (B) Plot of the whisker position and heart rate. (C) Changes in total hemoglobin ∆[HbT] within the ROIs over the putative vibrissa cortex. (D) Normalized left vibrissae cortex LFP power (∆P/P). (E) Normalized right vibrissae cortex LFP power. (F) Normalized CA1 LFP power.

Figure 1—figure supplement 7. Sleep drives hemodynamic fluctuations larger than awake behaviors.

Figure 1—figure supplement 7.

Examples showing the hemodynamic and neural changes accompanying transitions among the NREM, REM and awake states. (A) Plot of nuchal muscle EMG power and body motion via a pressure sensor located beneath the mouse. (B) Plot of the whisker position and heart rate. (C) Changes in total hemoglobin ∆[HbT] within the ROIs over the putative vibrissa cortex. (D), Normalized left vibrissae cortex LFP power (∆P/P). (E), Normalized right vibrissae cortex LFP power. (F), Normalized CA1 LFP power.

Figure 1—figure supplement 8. Sleep drives hemodynamic fluctuations larger than awake behaviors.

Figure 1—figure supplement 8.

Examples showing the hemodynamic and neural changes accompanying transitions among the NREM, REM and awake states. (A) Plot of nuchal muscle EMG power and body motion via a pressure sensor located beneath the mouse. (B) Plot of the whisker position and heart rate. (C), Changes in total hemoglobin ∆[HbT] within the ROIs over the putative vibrissa cortex. (D) Normalized left vibrissae cortex LFP power (∆P/P). (E) Normalized right vibrissae cortex LFP power. (F) Normalized CA1 LFP power.

Figure 1—figure supplement 9. Correction of slow drifts in reflectance during IOS imaging.

Figure 1—figure supplement 9.

(A) Image of bilateral hemispheres during IOS imaging with localized left, right ROIs as well as a region over the central cement that is used to correct a slow exponential drift in the camera’s sensitivity. The drift in reflectance of the cement (orange) is fit with an exponential (purple) and is used to correct the drifts in the lateral ROIs. (B) Raw pixel reflectance from the left hemisphere ROI. The exponential drift is clearly visible prior to correction. (C) Raw pixel reflectance from the right hemisphere ROI. (D) The exponential drift from the cement ROI is inverted and normalized to correct pixel reflectance in each hemisphere. (E) Original (red) vs. corrected (purple) pixel reflectance for the left hemisphere ROI. (F) Original (blue) vs. corrected (purple) pixel reflectance for the right hemisphere ROI.