Abstract
Deep learning has shown a great promise in classifying brain disorders due to its powerful ability in learning optimal features by nonlinear transformation. However, given the high-dimension property of neuroimaging data, how to jointly exploit complementary information from multimodal neuroimaging data in deep learning is difficult. In this paper, we propose a novel multilevel convolutional neural network (CNN) fusion method that can effectively combine different types of neuroimage-derived features. Importantly, we incorporate a sequential feature selection into the CNN model to increase the feature interpretability. To evaluate our method, we classified two symptom-related brain disorders using large–sample multi-site data from 335 schizophrenia (SZ) patients and 380 autism spectrum disorder (ASD) patients within a cross-validation procedure. Brain functional networks, functional network connectivity, and brain structural morphology were employed to provide possible features. As expected, our fusion method outperformed the CNN model using only single type of features, as our method yielded higher classification accuracy (with mean accuracy >85%) and was more reliable across multiple runs in differentiating the two groups. We found that the default mode, cognitive control, and subcortical regions contributed more in their distinction. Taken together, our method provides an effective means to fuse multimodal features for the diagnosis of different psychiatric and neurological disorders.
Keywords: Deep learning, Fusion, Multimodal neuroimaging, Classification
1. Introduction
Current diagnosis of mental illnesses heavily relies on clinical symptoms that do not reflect neurobiological substrate. Considerable effort has been made to identify mental disorders such as schizophrenia [1, 2] and autism spectrum disorder [3] by utilizing biologically meaningful features. Deep learning techniques have been applied to the neuroscience field [4] for differentiating brain disorders based on neuroimaging measures [5-9]. However, most previous work employs unimodal features, such as resting-state functional connectivity [10] or gray matter measures [11]. There has been evidence that fusion of different neuroimaging features can improve the ability in differentiating and predicting brain disorders [12, 13]. Unfortunately, jointly utilizing different types of neuroimaging measures in a deep learning model can be challenging.
Neuroimaging data has been widely used to investigate biomarkers of brain disorders and distinguish patients from healthy controls. The mostly used features include 1) brain functional networks and connectivity [14, 15] reflecting the interaction between separate brain regions and 2) brain structural morphology such as gray matter volume and density [16]. Among deep learning methods, convolutional neural network (CNN) model works well in automatically detecting important features through preserving spatial locality of neuroimaging measures. CNN has been applied to separate Alzheimer’s disease (AD) [17], mild cognitive impairment (MCI) [18], and schizophrenia (SZ) [19] from healthy group. However, most of the studies utilized a single type of features, likely due to the challenges of combining different high-dimensional measures.
Indeed, there has been some work which incorporates multimodal measures to differentiate mental disorders via deep learning. Salvador et al. [20] used gray matter volumes, functional activation maps, and resting-state low-frequency fluctuation and whole-brain connectivity maps, and then tested a set of strategies of fusing the classification results from unimodal classifiers. They suggested that a two-step sequential integration method performed better than other fusion methods but did not improve much beyond a unimodal classification approach. In the two-step method, an initial unimodal classification was used to select the most informative voxels from each 3D map, and then a second classification only considered those important voxels as inputs. Such an approach may not provide optimal use of joint information. Liu et al. [21] constructed cascaded CNNs to learn the multimodal features of magnetic resonance imaging (MRI) and positron emission tomography (PET) images for AD classification. In their method, multiple 3D CNNs were used on different local image patches, followed by a 2D CNN that helps generate multimodality correlated features. One of the challenges of this approach is the difficulty in explaining the contributing features. In this paper, we propose a new CNN fusion model to learn and combine different types of features for distinguishing patients with mental disorders, by taking advantage of a sequential forward feature selection and multi-level CNN fusion.
We evaluated our fusion method using neuroimaging data from schizophrenia (SZ) and autism spectrum disorder (ASD) patients, since the two disorders share similar clinical symptoms. Although SZ is defined as a psychiatric disorder and ASD comprises a range of neurodevelopmental disorders, SZ and ASD were previously considered to be the same disorder. Their differentiation has been a long-standing unsolved problem given the challenge of their heterogeneity and non-specificity [22-25]. Whole-brain functional connectivity [3, 26] has been used to compare and classify SZ (or ASD) from healthy population. Mastrovito et al. [27] classified SZ and ASD using brain effective connectivity estimated from resting functional magnetic resonance imaging (fMRI). In their study, a support vector machine (SVM) classifier was applied, resulting in a 75% SZ vs. ASD classification accuracy. No work has utilized both brain functional and structural information to classify the two disorders. In this paper, we evaluate our deep learning fusion model by applying it to the classification between SZ and ASD individuals based on multimodal neuroimaging measures.
2. Materials and Methods
2.1. Materials
We included fMRI and structural MRI (sMRI) data of 335 SZ and 380 ASD patients from the Bipolar-Schizophrenia Network for Intermediate Phenotypes-1 (BSNIP-1), Function Biomedical Informatics Research Network (FBIRN), Maryland Psychiatric Research Center (MPRC), and Autism Brain Imaging Data Exchange I (ABIDE I). For fMRI data, we removed the first six time points of volumes and then performed rigid body motion and slice-timing correction. The fMRI data were subsequently warped into standard Montreal Neurological Institute (MNI) space, resampled to 3 × 3 ×3 mm3 voxels, and smoothed using a Gaussian kernel with a full width at half maximum (FWHM) = 6 mm. For sMRI data, we segmented the structural images into gray matter, white matter and cerebral spinal fluid with modulated normalized parameters, and then smoothed the images using a Gaussian kernel with an FWHM = 6 mm. Finally, the preprocessed fMRI and sMRI data that passed the quality control were maintained.
2.2. Method
Our method can handle different neuroimaging measures represented as 3D/2D matrices and vectors for the classification between different groups. In this work, we employed multiple brain spatial functional networks, functional connectivity matrix, and brain structural morphology volume as the inputs. Specifically, for each subject, we estimated 53 brain functional networks and a functional network connectivity (FNC) matrix from resting-state fMRI data using our previously developed fully automated NeuroMark approach [28]. The data-driven independent component analysis (ICA) method is able to extract brain functional features with both individual-subject specificity and inter-subject correspondence, by taking advantaging of the network templates from a large sample of population as priors and a multiple objective optimization method [29]. The obtained 53 functional networks, each of which was represented by a 3D matrix, were assigned into seven functional domains including the sub-cortical (SC), auditory (AU), sensorimotor (SM), visual (VI), cognitive control (CC), default mode (DM), and cerebellar (CB) domains. Next, the FNC, represented by a 2D matrix, was obtained by computing the Pearson correlation coefficients between the time series of functional networks, thus reflecting the temporal interaction between different brain functional networks. In addition to the brain functional measures, we computed gray matter volume (GMV) from sMRI data, resulting in a 3D matrix for each subject. Finally, 53 brain functional networks (3D matrices), a 2D FNC matrix, and a 3D gray matter volume matrix were taken as inputs for each subject in the classification process.
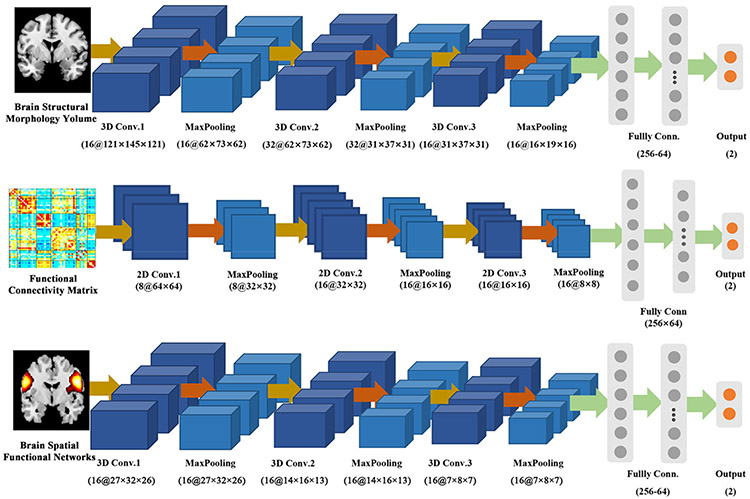
Regarding both our proposed CNN fusion model using multiple brain measures and the CNN model only using single type of measures, we tested their performance via a 5-fold cross-validation procedure. The training and testing samples were consistent between the classifications using different methods. Figure 1 shows the CNN models in the classification using single type of neuroimaging measures. For the unimodal comparison, 3D CNNs were taken as the model for brain functional networks and gray matter volume, while a 2D CNN was used for functional network connectivity. For the 2D/3D CNN, the input was convolved by 2D/3D convolutional layers with rectified linear unit (ReLU) [30] activation, and each convolutional layer was followed by a max-pooling layer to down-sample the feature maps.
Figure 1:
The CNN models in the classification using single type of neuroimaging measures. For brain functional networks and gray matter volume, 3D CNNs were used. For functional network connectivity, a 2D CNN was used.
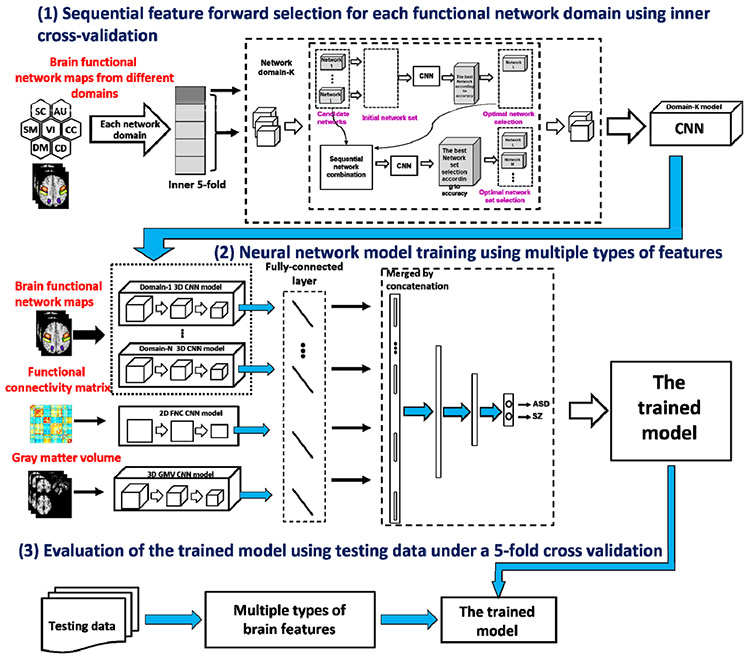
Figure 2 shows the pipeline of our method. We combine the characteristics from different types of measures to improve classification of brain disorders. We first pretrained a 3D CNN model for the brain functional networks of each functional domain, a 3D CNN model for the gray matter volume, and a 2D CNN for the FNC measures, separately. Next, the nine resulting CNN models were combined by adding additional fully-connected layers and then fine-tuning with the pre-trained CNN models fixed to build a unified model. The unified model was evaluated using the testing data. For the spatial functional networks in each domain, we performed a feature selection before pretraining, considering that the effects of different networks can be different.
Figure 2:
The pipeline of our proposed fusion model and the validation.
Feature selection plays a key role in classification, especially for the high-dimensional network measures. The features automatically transformed in deep learning are hard to decode. How to incorporate additional feature selection in deep learning is also difficult. In our method, a sequential forward network selection combined with the 3D CNN model was used to achieve the discriminative network set of each domain via an inner 5-fold cross-validation procedure within the training data. To do this, the spatial networks were added one by one as inputs for 3D CNN using the inner training data in each run to find a set of networks which maximized the classification accuracy on the inner testing data. Next, the networks that frequently presented in the optimal network sets across different runs were taken as discriminative networks. Finally, the selected networks were summed as inputs for pre-training 3D CNN.
To evaluate the classification performance for each method, we computed the accuracy, sensitivity, and specificity according to the predicted label of the testing data [31], and then recorded the mean and standard deviation of each metric across different runs for a comprehensive comparison between different methods. Furthermore, we also performed a two-sample t-test on the classification accuracy to compare the performance between our CNN fusion method and any single-modal method.
3. Results
3.1. The estimated neuroimaging measures
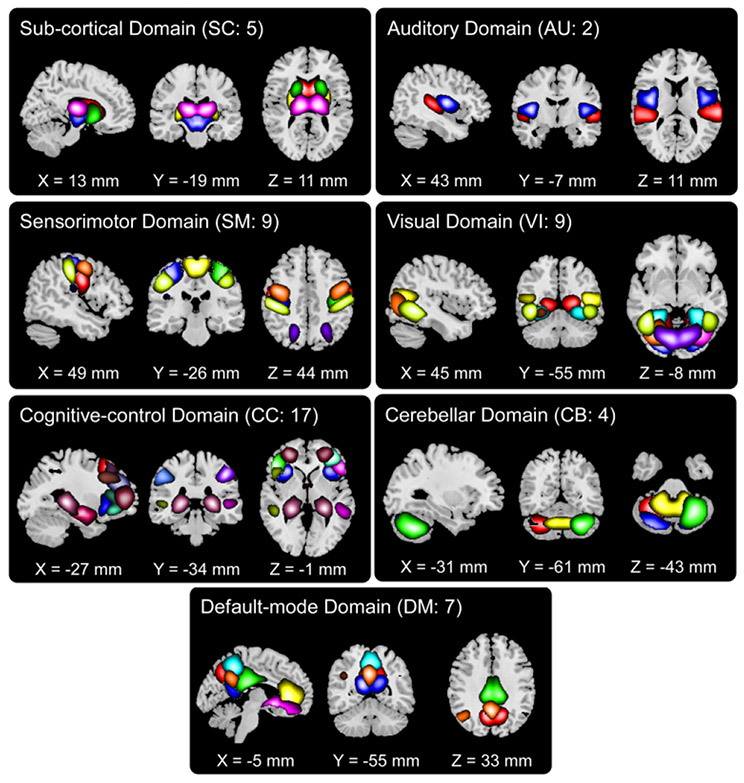
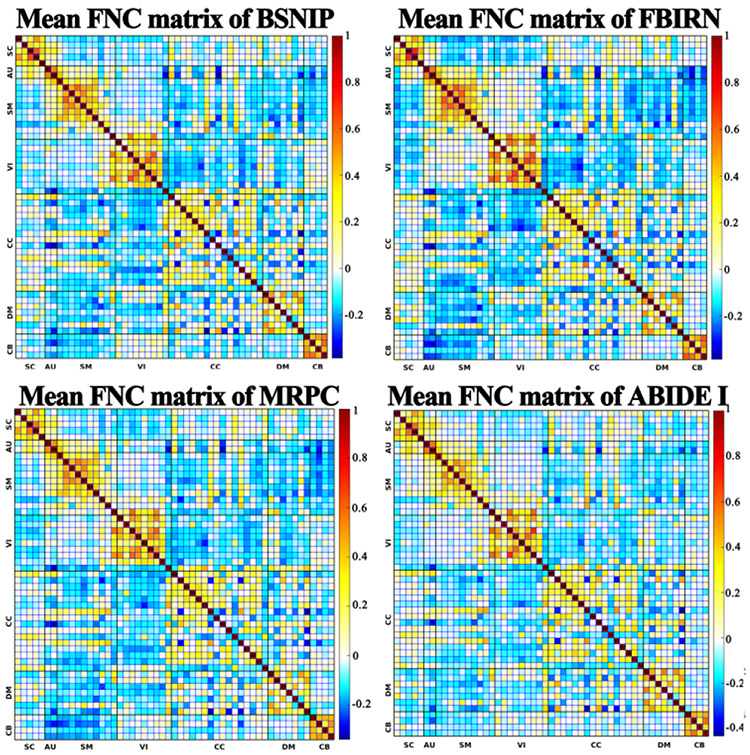
Figure 3 shows an example of the 53 brain spatial functional networks, including five SC, two AU, nine SM, nine VI, 17 CC, seven DM, and four CB networks. In our comparison experiments, each functional network was used as input for a 3D CNN model for classifying SZ and ASD. The FNC matrix reflects the temporal interactions between different functional networks, with a higher correlation strength representing stronger interaction between two networks. As demonstrated in Figure 4, the mean FNC matrixes showed a consistent pattern across datasets from different studies, indicating that the FNC strength was comparable between individuals and thus a good candidate for use in classification. It is also observed that functional connectivity between networks within the same functional domain (e.g. default mode domain) showed overall higher strength than those between networks from different domains. The blocky patterns motivate the use of a 2D CNN model for the single-type feature experiment. The 3D gray matter volume embedding voxel-based morphometry had larger dimensionality than each functional network. Similarly, the gray matter volume was used to train a 3D CNN model for distinguishing SZ and ASD patients, in order to compare with our fusion method.
Figure 3:
The 53 3D brain spatial functional networks that were assigned into seven functional domains. The networks in the same functional domain are displayed using different colors.
Figure 4:
The mean FNC matrix across subjects for BSNIP, FBRIN, MPRC, and ABIDE I, respectively. Each element in FNC matrix reflects the connectivity between two networks.
3.2. Our CNN fusion method outperformed the CNN models using single type of features
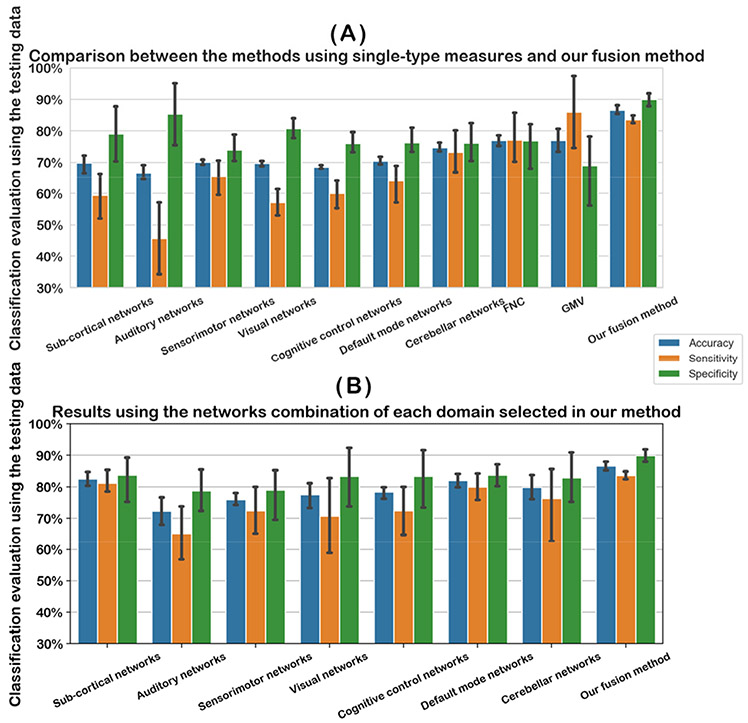
In the following, we report the results from both the CNN models using different single type of features and our fusion method. Regarding each evaluation measure (accuracy, specificity, and sensitivity), the mean and standard deviation across different runs are shown in Figure 5. Since different functional networks resulted in varied performances, we recorded the mean classification accuracy for networks in the same domain for a summary. Using single network, the cerebellar (mean accuracy =75%) and default mode (mean accuracy =70%) yielded a higher accuracy in differentiating the two disorders than other domains. FNC and GMV resulted in the same mean accuracy (77%) in the single-type feature methods; however GMV yielded higher sensitivity and lower specificity than FNC. As expected, the highest accuracy (mean accuracy = 87%) was achieved using our CNN fusion model by the combination use of multiple types neuroimaging features, compared to using single type of features alone. Furthermore, the standard deviation of each metric was smaller in our method relative to other methods, supporting that our fusion method was more robust.
Figure 5:
Classification evaluation using the testing data. In (A), we show the classification accuracy using different single type of measures and our fusion method. Since there were different networks, we averaged the classification accuracy across different networks in each domain for a summary. In (B), we show the classification accuracy obtained using the selected networks combination of each domain in our method for a comparison. Our fusion method is shown in parallel for comparison. In (A) and (B), for the classification accuracy, sensitivity, or specificity, the evaluation metrics in different runs were shown using an error bar.
As we mentioned, different networks in the same domain were utilized to search an optimal network combination through a sequential feature forward selection in our method. In Figure 5, we also show the classification accuracy using the network combination of each domain as the input of 3D CNN for an additional test. By using the optimal network set as input, the subcortical networks got the highest accuracy (mean accuracy = 83%), and default mode networks also performed well (the mean accuracy = 82%), both of which were higher than the accuracy of using single network.
Table 1 includes the statistical results from comparing our fusion method and the single-modal methods. The results show that our fusion method significantly outperformed any method using single-modal features, as all p-values from two-sample t-tests (fusion vs. single-modal methods) were smaller than 0.01. Also, we found that the improvement in our fusion method was greater relative to the functional network features than the GMV and FNC features.
Table 1:
Two-sample t-test results for comparing our fusion method and single-modal methods
| Comparison between our fusion method and single-modal method |
T-value | p-value |
|---|---|---|
| Fusion vs. Sub-cortical network features | 8.10 | 1.26e-03 |
| Fusion vs. Auditory network features | 29.59 | 7.76e-06 |
| Fusion vs. Sensorimotor network features | 20.14 | 3.59e-05 |
| Fusion vs. Visual network features | 34.47 | 4.24e-06 |
| Fusion vs. Cognitive control network features | 31.80 | 5.83e-06 |
| Fusion vs. Default mode network features | 59.88 | 4.66e-07 |
| Fusion vs. Cerebellar network features | 10.26 | 5.08e-04 |
| Fusion vs. FNC features | 10.60 | 4.49e-04 |
| Fusion vs. GMV features | 5.91 | 4.11e-03 |
Taken together, in our method the network combination took effect by jointly taking advantage of different networks, and the fusion of different types of features further improved the classification performance.
3.3. The discriminating brain functional networks selected by our method
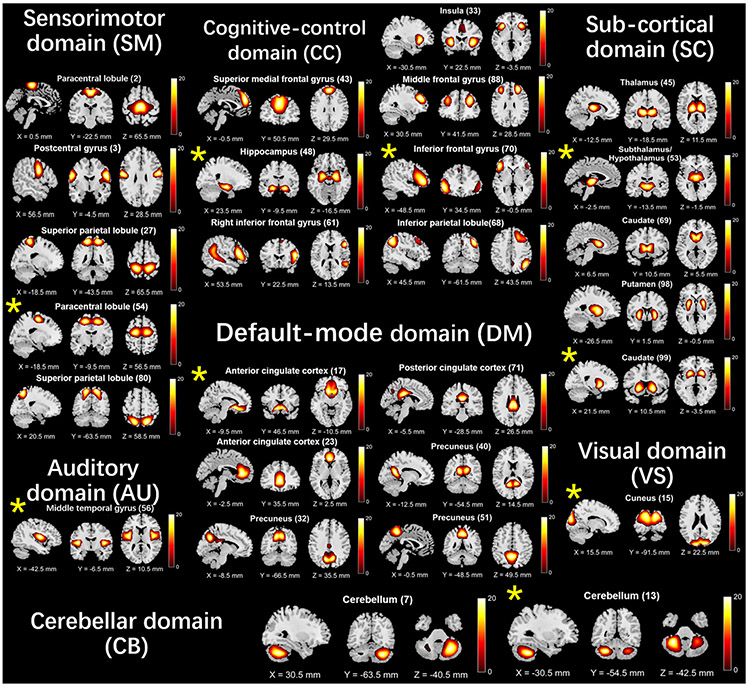
As described above, in each run, our method automatically selected one subset of functional networks in each domain by our proposed sequential forward selection algorithm. For each functional domain, we further summarized the identified network subsets across different runs to show which brain regions were mostly associated with the differences between the two disorders. Figure 6 shows the networks selected as features. Taking the default mode domain as an example, the anterior cingulate cortex, precuneus, and posterior cingulate cortex regions included the most discriminative features. For the cognitive control domain, the insula, middle frontal gyrus, supplementary motor areas were prominent. 20 of 53 networks presented in more than 80% frequency, and the default mode, cognitive control and sub-cortical networks occupied a large percentage among them.
Figure 6:
The summary of the discriminating network set in each functional domain selected by our method. The network denoted by an asterisk was selected in all runs.
4. Discussion and Conclusions
In this work, we proposed a novel deep learning method to jointly utilize different neuroimaging measures for disorder classification/diagnosis. Our method enables preserving the unique properties from different measures and the combination use of features with different dimensionalities. Importantly, our method provides a way to select the optimal features in CNN via a sequential forward selection, which improved the interpretability of features that is usually difficult in deep learning.
By taking the large-scale spatial functional networks, functional connectivity between networks, and gray matter volume as the joint input, our fusion method significantly outperformed the method using single-type of features in distinguishing SZ and ASD. Our method achieved the best classification accuracy and the strongest reliability compared to other methods. Furthermore, the combination of functional networks via feature selection in our method worked better than only using single network. Our results supported that the default mode, cognitive control and sub-cortical regions had more impacts in differentiating ASD and SZ. The discriminative regions primarily included anterior cingulate cortex, caudate, inferior frontal gyrus, paracentral lobule, and hippocampus. Previous work also supported their differences in default mode network [27, 32-33], which is consistent with our results. In summary, our proposed fusion CNN model shows promise for individualized classification of mental disorders and highlights the advantage of optimally combining multimodal features compared to only single-modal features. In future work, we will compare our fusion method with other fusion methods.
CCS CONCEPTS.
Artificial intelligence · Machine learning · Life and medical sciences
ACKNOWLEDGMENTS
This work was supported by National Natural Science Foundation of China (Grant No. 61703253 to YHD), National Institutes of Health grants 5P20RR021938/P20GM103472 & R01EB020407 and National Science Foundation grant 1539067 (to VDC), and the 1331 Engineering Project of Shanxi Province, China.
Footnotes
ACM Reference format:
Yuhui Du, Bang Li, Yuliang Hou, Vince D Calhoun. 2020. A deep learning fusion model for brain disorder classification: Application to distinguishing schizophrenia and autism spectrum disorder. In Proceedings of the 11th ACM conference on Bioinformatics, Computational Biology, and Health Informatics (ACMBCB ‘20). ACM, 7 pages.
Contributor Information
Yuhui Du, School of Computer & Information Technology, Shanxi University Taiyuan, China.
Bang Li, School of Computer & Information Technology, Shanxi University Taiyuan, China.
Yuliang Hou, School of Computer & Information Technology, Shanxi University Taiyuan, China.
Vince D Calhoun, Tri-Institutional Center for Translational Research in Neuroimaging and Data Science (TReNDS).
REFERENCES
- [1].Du Y, et al. 2017. Identifying functional network changing patterns in individuals at clinical high-risk for psychosis and patients with early illness schizophrenia: A group ICA study. Neuroimage Clinical. 17(C): p. 335–346. DOI: 10.1016/j.nicl.2017.10.018. [DOI] [PMC free article] [PubMed] [Google Scholar]
- [2].Arbabshirani MR, et al. 2013. Classification of schizophrenia patients based on resting-state functional network connectivity. Frontiers in neuroscience. 7: p. 133 DOI: 10.3389/fnins.2013.00133. [DOI] [PMC free article] [PubMed] [Google Scholar]
- [3].Chen H, et al. 2017. Shared atypical default mode and salience network functional connectivity between autism and schizophrenia. Autism Research. 10(11): p. 1776–1786. DOI: 10.1002/aur.l834. [DOI] [PMC free article] [PubMed] [Google Scholar]
- [4].Plis SM, et al. 2014. Deep learning for neuroimaging: a validation study. Frontiers in neuroscience. 8: p. 229 DOI: 10.3389/fnins.2014.00229. [DOI] [PMC free article] [PubMed] [Google Scholar]
- [5].Li H, et al. 2019. A deep learning model for early prediction of Alzheimer's disease dementia based on hippocampal magnetic resonance imaging data. Alzheimers Dement. 8: p. 1059–1070. DOI: 10.1016/j.jalz.2019.02.007. [DOI] [PMC free article] [PubMed] [Google Scholar]
- [6].Ju R, et al. 2019. Early Diagnosis of Alzheimer's Disease Based on Resting-State Brain Networks and Deep Learning. IEEE/ACM Trans Comput Biol Bioinform. 16(1): p. 244–257. DOI: 10.1109/TCBB.2017.2776910. [DOI] [PubMed] [Google Scholar]
- [7].Abrol A, et al. 2019. Deep Residual Learning for Neuroimaging: An application to Predict Progression to Alzheimer's Disease. bioRxiv: p. 470–252. DOI: 10.1101/470252. [DOI] [PMC free article] [PubMed] [Google Scholar]
- [8].Vieira S, Pinaya WHL, and Mechelli A. 2017. Using deep learning to investigate the neuroimaging correlates of psychiatric and neurological disorders: Methods and applications. Neuroscience and Biobehavioral Reviews. 74: p. 58–75. DOI: 10.1016/j.neubiorev.2017.01.002. [DOI] [PubMed] [Google Scholar]
- [9].Arbabshirani MR, et al. 2017. Single subject prediction of brain disorders in neuroimaging: Promises and pitfalls. Neuroimage. 145(Pt B): p. 137–165. DOI: 10.1016/j.neuroimage.2016.02.079. [DOI] [PMC free article] [PubMed] [Google Scholar]
- [10].Ju R, Hu C, and Li Q. 2017. Early diagnosis of Alzheimer's disease based on resting-state brain networks and deep learning. IEEE/ACM transactions on computational biology and bioinformatics. 16(1): p. 244–257. DOI: 10.1109/TCBB.2017.2776910. [DOI] [PubMed] [Google Scholar]
- [11].Abrol A, et al. 2020. Deep residual learning for neuroimaging: An application to predict progression to alzheimer’s disease. Journal of Neuroscience Methods: p. 108701 DOI: 10.1016/j.jneumeth.2020.108701. [DOI] [PMC free article] [PubMed] [Google Scholar]
- [12].Sui J, et al. 2018. Multimodal neuromarkers in schizophrenia via cognition-guided MRI fusion. Nature communications. 9(1): p. 1–14. DOI: 10.1038/s41467-018-05432-w. [DOI] [PMC free article] [PubMed] [Google Scholar]
- [13].Meng X, et al. 2016. Predicting individualized clinical measures by a generalized prediction framework and multimodal fusion of MRI data. Neuroimage. 145(Pt B): p. 218–229. DOI: 10.1016/j.neuroimage.2016.05.026 [DOI] [PMC free article] [PubMed] [Google Scholar]
- [14].Yuhui, et al. 2018. Classification and Prediction of Brain Disorders Using Functional Connectivity: Promising but Challenging. Frontiers in Neuroscience. DOI: 10.3389/fnins.2018.00525 [DOI] [PMC free article] [PubMed] [Google Scholar]
- [15].Heuvel MPVD and Pol HEH. 2010. Exploring the brain network: A review on resting-state fMRI functional connectivity. Eur Neuropsychopharmacol. 20(8): p. 519–534. DOI: 10.1016/j.euroneuro.2010.03.008. [DOI] [PubMed] [Google Scholar]
- [16].Ronny, et al. 2014. Brain morphometric biomarkers distinguishing unipolar and bipolar depression. A voxel-based morphometry-pattern classification approach. Jama Psychiatry. DOI: 10.1001/jamapsychiatry.2014.1100. [DOI] [PMC free article] [PubMed] [Google Scholar]
- [17].Khvostikov A, et al. 2018. 3D CNN-based classification using sMRI and MD-DTI images for Alzheimer disease studies.
- [18].Meszlényi RJ, Krisztian B, and Zoltán V. 2017. Resting State fMRI Functional Connectivity-Based Classification Using a Convolutional Neural Network Architecture. Frontiers in Neuroinformatics. 11: p. 61-. DOI: 10.3389/fninf.2017.00061. [DOI] [PMC free article] [PubMed] [Google Scholar]
- [19].Oh K, et al. 2019. Classification of schizophrenia and normal controls using 3D convolutional neural network and outcome visualization. Schizophrenia Research. 212: p. 519–534. DOI: 10.1016/j.schres.2019.07.034. [DOI] [PubMed] [Google Scholar]
- [20].Salvador R, et al. 2019. Multimodal Integration of Brain Images for MRI-Based Diagnosis in Schizophrenia. Frontiers in Neuroence. 13: p. 1203 DOI: 10.3389/fnins.2019.01203. [DOI] [PMC free article] [PubMed] [Google Scholar]
- [21].Liu M, et al. 2018. Multi-modality cascaded convolutional neural networks for Alzheimer’s disease diagnosis. Neuroinformatics. 16(3-4): p. 295–308. DOI: 10.1007/s12021-018-9370-4. [DOI] [PubMed] [Google Scholar]
- [22].King BH and Lord C. 2011. Is schizophrenia on the autism spectrum? Brain Research. 1380: p. 34–41. DOI: 10.1016/j.brainres.2010.11.031. [DOI] [PubMed] [Google Scholar]
- [23].Stone WS and Iguchi L. 2011. Do Apparent Overlaps between Schizophrenia and Autistic Spectrum Disorders Reflect Superficial Similarities or Etiological Commonalities? N Am J Med Sci (Boston). 4(3): p. 124–133. DOI: 10.7156/v4i3p124. [DOI] [PMC free article] [PubMed] [Google Scholar]
- [24].Hommer RE and Swedo SE. 2015. Schizophrenia and autism-related disorders. Schizophr Bull. 41(2): p. 313–314. DOI: 10.1093/schbul/sbu188. [DOI] [PMC free article] [PubMed] [Google Scholar]
- [25].Lanillos P, et al. 2020. A review on neural network models of schizophrenia and autism spectrum disorder. Neural Netw. 122: p. 338–363. DOI: 10.1016/j.neunet.2019.10.014. [DOI] [PubMed] [Google Scholar]
- [26].Andriamananjara A, Muntari R, and Crimi A. 2018. Overlaps in brain dynamic functional connectivity between schizophrenia and autism spectrum disorder. Scientific African, p. e00019,DOI: 10.1016/j.sciaf.2018.e00019. [DOI] [Google Scholar]
- [27].Mastrovito D, Hanson C, and Hanson SJ. 2018. Differences in atypical resting-state effective connectivity distinguish autism from schizophrenia. Neuroimage Clin. 18: p. 367–376. DOI: 10.1016/j.nicl.2018.01.014. [DOI] [PMC free article] [PubMed] [Google Scholar]
- [28].Du Y, et al. 2019. NeuroMark: a fully automated ICA method to identify effective fMRI markers of brain disorders. medRxiv: p. 19008631 DOI: 10.1101/19008631. [DOI] [Google Scholar]
- [29].Du Y and Fan Y. 2013. Group information guided ICA for fMRI data analysis. Neuroimage. 69: p. 157–197. DOI: 10.1016/j.neuroimage.2012.11.008. [DOI] [PubMed] [Google Scholar]
- [30].Krizhevsky A, Sutskever I, and Hinton GE. 2012. ImageNet classification with deep convolutional neural networks. Advances in neural information processing systems, p. 1097–1105. DOI: 10.1145/3065386. [DOI] [Google Scholar]
- [31].Cuadros-Rodríguez L, Pérez-Castaño E, and Ruiz-Samblás C. 2016. Quality performance metrics in multivariate classification methods for qualitative analysis. TrAC Trends in Analytical Chemistry. 80: p. 612–624. DOI: 10.1016/j.trac.2016.04.021. [DOI] [Google Scholar]
- [32].Chen H, et al. 2017. Shared atypical default mode and salience network functional connectivity between autism and schizophrenia. Autism Research. 10(11): p. 1776–1786. DOI: 10.1002/aur.l834. [DOI] [PMC free article] [PubMed] [Google Scholar]
- [33].Rabany L, et al. 2019. Dynamic functional connectivity in schizophrenia and autism spectrum disorder: Convergence, divergence and classification. Neuroimage Clin. 24: p. 101966 DOI: 10.1016/j.nicl.2019.101966. [DOI] [PMC free article] [PubMed] [Google Scholar]


