

Abstract
Diabetes mellitus (DM) is a chronic metabolic disease, the third killer of mankind. The finding of potent drugs against diabetes remains challenging. In the present study, coumarin derivatives with known biological activity against diabetic protein have been used to predict functional groups’ positions on coumarin derivatives. α-Glucosidase is a brush border membrane-bound lysosomal enzyme from the hydrolase enzyme family. It plays an important role in the metabolism of glycoproteins. Inhibitors of lysosomal α-glucosidase can reduce postprandial hyperglycemia. Due to this, lysosomal α-glucosidase is a good therapeutic target for drugs. A total of 116 coumarin derivatives with IC50 values against lysosomal α-glucosidase were selected for a CADD (computer-aided drug design) approach to identify more potent drugs. Pharmacophore modeling and atom-based 3-QSAR of 116 active compounds against lysosomal α-glucosidase were performed and identified positions and types of groups to increase activity. We performed molecular docking of 116 coumarin derivatives against the lysosomal α-glucosidase enzyme, and three compounds (isorutarine, 10_, and 36) resulted in a docking score of −7.64, −7.12, and −6.86 kcal/mol. The molecular dynamics simulation of the above three molecules and protein complex performed for 100 ns supported the interaction stability of isorutarine, 10_, and 36 with the lysosomal binding site α-glucosidase.
Highlights
Coumarin derivatives as promising antidiabetic drugs against lysosomal α-glucosidase
116 biologically active coumarin derivatives used to generate a pharmacophore model
AANRR, ANRR, AAANR, and AANR hypotheses generated with a best survival score of 4.79
Highly significant IC50 QSAR model of coumarin derivatives with an R2 of 0.94
Promising drug-like derivatives against lysosomal α-glucosidase with binding energy exceeding −7.50 kcal/mol
Highly stable lysosomal α-glucosidase inhibitors with an average RMSD below 0.3 nm over 100 ns
Introduction
Diabetes mellitus (DM) is characterized by elevated blood glucose levels known as hyperglycemia, a chronic metabolic illness caused by low insulin secretion or insulin resistance.1 An International Diabetes Federation (IDF) estimate indicated that 151 million adults lived with diabetes in 2000 with an estimate of 438 million by 2025, although 25 million with 463 million diabetic patients had already surpassed it.2 In diabetes, slow reduction in the blood glucose level and control of subsequent complications in tissues independent of insulin cause serious issues such as the lens glomerulus, nerves, vascular cells, and retinal disorders.3,4 Lysosomal α-glucosidase, an enzyme from the hydrolase enzyme family (EC 3.2.1.20), plays an important role in the metabolic process such as cellular glycosylation of proteins and food storage and utilization and breakdown of α-(1–4)-glycosidic linkage of sugar (glycoprotein and carbohydrates).5−9 Lysosomal α-glucosidase is a ubiquitous brush border membrane-bound enzyme majorly present in the intestine.8−10 α-Glucosidase inhibitors (AGIs) can suppress postprandial hyperglycemia. Thus, lysosomal α-glucosidase is an effective curative target for the treatment of diabetes, cancer, obesity, human immunodeficiency virus (HIV/AIDS), and other degenerative diseases.11−16 There are several inhibitors of lysosomal α-glucosidase, such as acarbose, nojirimycin, voglibose, N-butyldeoxy nojirimycin, and miglitol, clinically used for the treatment of diabetes mellitus/target for type-II diabetes.16−22 Acarbose, miglitol, and voglibose, inhibitors of lysosomal α-glucosidase, have a similar structure to saccharides (sugar moieties); thus, the carbohydrate site of lysosomal α-glucosidase binds with these inhibitors.23−25 IFD and AACE (American Association of Clinical Endocrinologists) recommended AGIs as first-line antidiabetic drugs.26 However, side effects like liver disorders such as lactic acidosis, abdominal and flatulence discomfort, and diarrhea are common for prescribed antidiabetic drugs in most cases. These side effects of the present drug have prompted scientists to investigate and design new inhibitors of lysosomal α-glucosidase with fewer side effects.27,28 Recently, heterocyclic compounds like triazole, quinazoline, luteolin, coumarin, and their derivatives have been documented as AGIs.29−31
Oxygen-containing molecules such as coumarin (benzopyran-2-one) derivatives are well known to possess various medicinal activities such as antiacetylcholinesterase, anticancer, anti-HIV activity and HIV-1 protease inhibition, antiviral, lipoxygenase inhibition, and anticlotting activities.32−37 Naturally and synthetically derived coumarin derivatives have been experimentally proven as antidiabetic agents.38−40 Moreover, coumarin hybrid/derivatives molecules have widely been found to possess various pharmacological properties including lysosomal α-glucosidase inhibition. In the literature study, we found coumarin derivatives as potent inhibitors of lysosomal α-glucosidase.39,41,42 It is known that a high dose (7000 mg daily) of coumarins may cause toxicity like carcinogenicity and hepatotoxicity.43 In view of this, incorporating new or more pharmacophore properties in the existing molecules of coumarin derivatives may help create new structural entities that increase the activity with a minimum side effect.
Investigation and identification of drugs using wet-lab methods are time-consuming and expensive work. Thus, the prediction of inhibitors against the new target using computational methods based on theoretical models is important. Several computation methods have also been used to develop and design AGIs such as docking, QSAR (dimensional quantitative structure–activity relationship), pharmacophore modeling,44,45 etc.
In the present study, we have performed a computational analysis of coumarin derivatives as AGIs (compounds are taken from the literature). Lysosomal α-glucosidase crystal structure enzymes are used in this study, and the study is performed by evaluating molecular docking, the pharmacophore analysis, and functional group properties of compounds involved in the activity. The pharmacophore properties/features are used for pharmacophore modeling and 3D-QSAR (three-dimensional quantitative structure–activity relationship), which will increase the activity after incorporating in the structures.
Result and Discussion
Determination of the Pharmacophore Model
Ligand-based molecular drug design depends on the compassion of known drugs with the biological activity against the target of interest. A molecule is a required minimum basic characteristic of the structure to bind to the target, and a pharmacophore model can be developed using these molecules.46 The coumarin derivatives tested as inhibitors for lysosomal α-glucosidase39,47−52 were used in the present study to develop a pharmacophore model and find out basic features of chemicals for the inhibitory activity effect. Approaches based on ligands consider pharmacophoric points to check analogy, 3D or 2D shape, and chemical features. About four to six variants of molecules were used to generate pharmacophore models. With these filtering criteria, 32 molecules were matched out of the 33 active compounds. A, H, R, N, and D pharmacophoric features were selected for creating sites. Pharmacophore models with AANRR, ANRR, AAANR, and AANR hypotheses were generated for all dataset molecules. Then all pharmacophoric molecules were finally scored by scoring function analysis. The scoring method comprises the alignment of volume overlap, selectivity score, number of ligands matched, vectors, and site scores. The selection of the pharmacophore hypothesis model was based on the variant with a survival score of 4.789, volume score of 0.517, and selectivity score of 2.291. The best model (i.e., the AANRR hypothesis model) has two hydrogen bond acceptors (A), one atom with a negative charge (N), and two aromatic rings (R) and was related to the 5-point hypothesis. Figure 1 presents the (AANRR) pharmacophore hypothesis with alignment, and this hypothesis was used for the generation of the 3D-QSAR model of lysosomal α-glucosidase.
Figure 1.
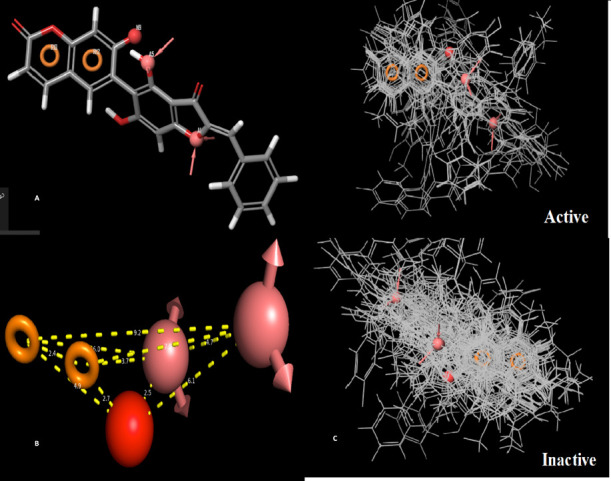
Alignment of the best pharmacophore model for active molecules and inactive molecules. (A) The included feature of the selected hypothesis: AANRR the hydrogen bond acceptor (sphere with arrow A1 and A5 with pink color), negative group (red sphere N9), and aromatic ring (circle R10 and R12). (B) The distances between various features in the generated pharmacophore models. (C) The alignment of active and inactive ligands on pharmacophoric properties.
The generated alignment and distances of the best pharmacophore model for active molecules and inactive molecules are shown in Figure 1. Distance between features may help in the activity by substitution of appropriate groups.
Building and Validation of Atom-Based 3D-QSAR
Atom-based 3D-QSAR studies for coumarin derivatives were performed using the Phase module of Maestro to figure out the effect of dimensional adjustment of structural features on lysosomal α-glucosidase inhibition. For the lysosomal α-glucosidase model, the molecules with the experimental dataset were randomly divided into a test set of 33 molecules and a training set of 78 molecules. A total of 9 PLS factors were taken to perform statistical data. Table 2 shows the statistical details of the atom-based 3D QSAR model based on the random selection method of the test set. Predicted activities of the training and test sets of compounds are similar, indicating that the hypothetically derived model of coumarin will show better activity than taken coumarin derivatives. The predictive ability and statistical significance of the QSAR model increase with the number of PLS factors up to 9. The squared predictive correlation coefficient (Q2) should be more than 0.60 for a good model.53 In the selection of the best model, it was found that a statistically significant regression model of hypothesis AANRR was supported by values of F of 136.0 and of variance ratio of P = 6.26 × 10–43, which indicates a high degree of confidence. Standard deviation (SD) with a lower value of 0.26 and RMSE (root-mean-square error) value of 0.66 indicates that the dataset taken for the QSAR model generation was significant to be considered for analysis. An R2 value of 0.94 of random set selection shows a good pharmacological activity correlation. Figure 2 reveals the linear plot of actual pIC50 values versus predicted activity for the test set and training set. Each of the models’ effectiveness was predicted from the calculated coefficient of correlation for the randomly selected test set with diverse structures of base (coumarin) compound. A Q2 value of 0.39 of the test set (squared correlation) also suggests better predictability of the atom-based 3D-QSAR model. The Q2 value is a more reliable and robust statistical parameter than R2 since it is obtained by the randomly divided external validation of the test set model.
Table 2. Statistics for Pharmacophore AANRR.
| factor | SD | R2 | R2 CV | R2 scramble | stability | F | P | RMSE | Q2 | Pearson-r |
|---|---|---|---|---|---|---|---|---|---|---|
| 1 | 0.6432 | 0.6217 | 0.5576 | 0.2071 | 0.99 | 133.1 | 8.91 × 10⁻¹⁹ | 0.66 | 0.6147 | 0.8008 |
| 2 | 0.5147 | 0.7608 | 0.6507 | 0.317 | 0.969 | 127.2 | 1.41 × 10⁻²⁵ | 0.67 | 0.6133 | 0.799 |
| 3 | 0.4389 | 0.8282 | 0.6886 | 0.4326 | 0.937 | 126.9 | 3.97 × 10⁻³⁰ | 0.66 | 0.6226 | 0.8005 |
| 4 | 0.4135 | 0.8494 | 0.6953 | 0.5202 | 0.924 | 110 | 2.92 × 10⁻³¹ | 0.7 | 0.5734 | 0.7741 |
| 5 | 0.3702 | 0.8809 | 0.6901 | 0.5946 | 0.863 | 113.8 | 4.21 × 10⁻³⁴ | 0.71 | 0.5641 | 0.7739 |
| 6 | 0.3429 | 0.8991 | 0.6781 | 0.6536 | 0.853 | 112.9 | 8.94 × 10–36 | 0.73 | 0.531 | 0.7528 |
| 7 | 0.3107 | 0.9183 | 0.6533 | 0.715 | 0.831 | 120.4 | 3.88 × 10–38 | 0.76 | 0.501 | 0.7455 |
| 8 | 0.288 | 0.9307 | 0.6423 | 0.7583 | 0.808 | 124.2 | 1.02 × 10–39 | 0.78 | 0.4637 | 0.7214 |
| 9 | 0.2613 | 0.9437 | 0.6347 | 0.7941 | 0.765 | 136 | 6.26 × 10–42 | 0.83 | 0.397 | 0.6972 |
Figure 2.

Regression plot of experimental vs predicted pIC50 values for the training set (A) and test set (B).
Atom-Based PHASE 3D-QSAR Model Analysis
Substituent group and atom contribution in the biological activity whether negatively and or positively could be estimated by the three-dimensional virtualization characteristics of the atom-based 3D-QSAR model. Figure 3 reveals the three-dimensional characteristics of the atom-based QSAR model and models represented by color cubes, and the coefficient value is coded by color (Table 3).
Figure 3.

Visual representation of atom-based 3D-QSAR human GAA models. (A) H-bond donor - light blue color indicates a positive coefficient or increase in activity and light orange shade cubes indicate a negative coefficient or decrease inactivity. (B) Hydrophobic - green shade indicates a positive coefficient, and purple shade cubes indicate a negative coefficient. (C) Negative ionic - light red cubes indicate a positive coefficient, and yellow cubes indicate a negative coefficient. (D) Electron-withdrawing - pale red cubes indicate a positive coefficient, and light green cubes indicate a negative coefficient. (E) Others, bluer shade cubes indicate a positive coefficient, and pink cubes indicate a negative coefficient.
Table 3. Colors for the Positive and Negative Coefficients.
| S.N. | parameter | color of the positive coefficient | color of the negative coefficient |
|---|---|---|---|
| 1 | H-bond donor (D) | light blue | light orange |
| 2 | hydrophobic (H) | green | purple |
| 3 | negative ionic (N) | light red | yellow |
| 4 | electron-withdrawing (W) | pale-red | light-green |
| 5 | other (X) | cyan | pink |
Positive coefficient colors indicate an increase in the biological activity, while the negative coefficient’s color indicates decreased inactivity. The visualization of coefficient color helps characterize a decrease and increase in the activity of the ligand. This visualization might prove which functional groups were favorable and unfavorable at particular positions in a compound.
The cubes by color code represent the atom-based 3D-QSAR model for lysosomal α-glucosidase shown by the volume of occlusion maps in Figure 3 (H-bond donor, hydrophobic, negative ionic, electron-withdrawing, and others). The favorable and unfavorable regions of interactions are symbolized in occlusion maps. Figure 3A shows the maps of H-bond donor groups in which light blue color cubes indicate the suitable position of H-bond donor groups in the benzopyrone ring and phenyl ring with oxygen. Improvements in the binding affinity of lysosomal α-glucosidase inhibitors can be gained by substituting H-bond donor groups on the benzopyrone ring (coumarin ring) moieties at the C3, C5, and C7 positions, while activity can also increase by the addition of the H-bond donor in the attached carbon rings and oxygen atoms. This suggests that this analysis points toward the positive potential of the H-bond donor quality of compounds. It was fundamental for the lysosomal α-glucosidase inhibition activity at a specific position. However, the C4 and C7 positions were not supportive of H-bond donor groups.
Figure 3B reveals the volume occlusion map for a hydrophobic feature, which illustrates the 3D arrangement of favorable hydrophobic interaction. The green cubes show positive coefficients. The addition of hydrophobic groups at the C4 and C5 positions of the coumarin ring may increase molecules’ activity, and substitution at carbon atoms in the third and fifth phenyl rings can also increase the activity. However, positions 1, 2, 3, 6, 7, and 8 of the coumarin ring were not favorable for the hydrophobic substation, and it may decrease the activity. Overall, the green cubes are more so, the hydrophobic substitution can increase the lysosomal α-glucosidase inhibition activity.
The negative ionic feature’s volume occlusion map is shown in Figure 3C in which the light red color indicates the positive coefficients. It illustrates the spatial geometry of supportive ionic interactions to the acceptor groups at the C3, C4, and C5 of the coumarin ring. Moreover, two carbon positions of the attached third ring are favoring the negative ionic group’s substitution, and it can increase the activity, while positions C2 and C8 of coumarin were not favorable for negative ionic substitution.
Electron-withdrawing volume occlusion maps (Figure 3D) show pale red cubes. These red-colored cubes on the C3, C7, and C8 positions of the coumarin ring and some carbons on the third and fifth attached phenyl ring favor the substitution of electron-withdrawing groups, which can increase the lysosomal α-glucosidase inhibition activity. However, other positions have not supported electron-withdrawing groups’ substitution, and it may decrease the activity.
Figure 3E reveals the volume occlusion map for other features. The cyan-colored cubes favor the lysosomal α-glucosidase inhibition activity, while pink-colored cubes were not considered for the activity prediction.
Overall, the all-atom model generated by atom-based 3D-QSAR depicts that substitution at all positions of the coumarin ring except 1 and 2 and oxygen and carbon atoms of attached phenyl rings by different groups like the H-bond donor, hydrophobic, negative ionic, and electron-withdrawing groups play an important role in the lysosomal α-glucosidase inhibition activity.
Molecular Docking Study
A molecular docking study was performed to investigate the molecules’ mode of binding against the human diabetes mellitus enzyme. Lysosomal α-glucosidase (PDB ID: 5KZX) has a good resolution of 2.0 Å. The docking analysis of coumarin derivatives’ dataset showed a good docking score and interaction with central residues of amino acids in the active site of the receptor (Table S1). The negative energy value manifests the molecular docking results that minimize the binding energy value.54 Docking results with lysosomal α-glucosidase protein, compound isorutarine, 10_, and 36 were good compounds and revealed a better docking score at the target protein site. If we study the binding mode of the isorutarine molecule, it showed a good docking score of −7.64 kcal/mol and made hydrogen bonds with Phe490, Thr491, and Arg608 amino acids with an oxygen atom and hydroxide groups. A docking score of −7.12 kcal/mol is shown for compound 10_ forming hydrogen bonds with Val358, Arg608, and Tyr609 amino acids with an oxygen atom and a hydroxyl group. The binding mode of molecule 36 showed a docking score of −6.86 kcal/mol, and hydroxyl groups of the molecule form hydrogen binding with Val358 and Arg608 amino acids. The molecules were also interacting with other amino acids by forming hydrophobic interactions; this interaction also plays a significant role in the activity. The 2D and 3D ligand interaction and binding surface (3D) diagrams are shown in Figure 4A–C.The protein and 3D ligand–protein interaction diagram structure is given in Figure S2.
Figure 4.

2D ligand interaction diagram (left) and binding solid surface diagram (right): (A) isorutarine, (B) compound 10_, and (C) compound 36.
Binding Free Energy Analysis
The binding free energies of docked complexes were calculated by using the MM/GBSA Prime module of Maestro 12.0. Molecular mechanics assess the enthalpic contribution of docked complexes. A DGbind negative value of MM/GBSA indicates better binding of the receptor and ligand molecules. The free binding energy value obtained from MM/GBSA calculations of ligand–protein complex interactions is highly reproducible and stable and separate from the solvation of the receptor.55 The free binding energy of the docked ligand–protein complex is shown in Table S2. The best three docked complexes show DGbind of −76.74, −52.26, and −45.38 with isorutarine, 10_, and 36 ligands, respectively. These complexes showed better binding energy; they show stable binding, and modification according to the QSAR model may increase the activity against lysosomal α-glucosidase. A post docking program, MD simulation analysis of the best three docked complexes was performed to employ the accurate ranking of binding affinities.
ADME Analysis
The QikProp module of Maestro 12.0 was used to perform the computational prediction of adsorption, distribution, metabolism, and excretion (ADME) properties. ADME properties of drug molecules have garnered considerable attention from researchers for new drug development and discovery, and they are cost-effective and high-throughput.56 About 17 pharmacologically significant and physically relevant parameters of all the docked 116 ligand molecules were determined (Table S1). Some parameters like molecular weight, octanol/water partition coefficient (QP log(Po/w)), water/gas partition coefficient (QP log Kp), accept HB, donor HB, percentage human oral absorption, brain–blood partition coefficient (QP log BB), solubility, dipole, and SASA calculated values of drugs within the range show drug-likeness of compounds. These properties give information that the ligand/s are showing drug-likeness properties. For all 116 compounds, the calculated values of parameters are in the range of drug-likeness (Table S1). So, the ADME properties show that all the compounds may be considered as a drug on the animal.
Another web tool, SWISS ADME, was also used to predict the best docked three molecules’ drug-likeness. Isorutarine is predicted to not cross the brain barrier and adsorb as it is present outside of the predicted egg model (white circle), whereas molecule 10_ and 36 showed good absorbance based on the location of molecules inside the egg (Figure 5 A). Compound 10_ showed accessibility to the blood–brain barrier (inside the egg yolk). Compound isorutarine is estimated to be actively effluxed by P-glycoprotein (P-gp) (blue dot), while molecule 10_ and 36 are predicted as nonsubstrate of P-gp (red dot).57 Analysis of bioavailability radar exhibits that isorutarine is polar (Figure 5B), and it may not be orally bioavailable. All three compounds isorutarine, 10_, and 36 possess most of the drug-likeness properties (range is pink color) (Figure 5B–D).
Figure 5.

Plots as generated by Swiss ADME: (A) the boiled-egg model, (B) properties of isorutarine, (C) properties of compound 10_, and (D) properties of compound 36.
MD Simulation Analysis
To complement the docking results, molecular dynamics simulations of the protein and the protein–ligand complexes were performed to study the interactions’ dynamic behavior. The molecular dynamics help analyze several factors, including the conformation of ligands, cofactors, protonation states, and entropies that affect in silico predictions. The Ramachandran map of the simulated structures suggests their stability exhibiting strong stereochemical geometries.
The maps containing the residues in the favored, allowed, and outlier regions for the studied systems are shown in Figure 6. It is seen that the complexes of the protein ligated with isorutarine, compound 10_, and compound 36 show three (Val-547, Leu-769, 881), ten (Met-122, Thr-175, Thr-191, Tyr-209, Asp-282, Asp-404, Ala-565, Gln-776, 794, 863), and eight (Thr-80, Ala-97, Met-122, Leu-208, Leu-291, His-395, Asp-404, Glu-471) outlier residues in the general region, respectively, while there were no outlier residues in the unligated protein.
Figure 6.

Ramachandran plot depicting stereochemical geometry for (A) unligated protein, (B) protein ligated with isorutarine, (C) protein ligated with compound 10_, and (D) protein ligated with compound 36.
Further, the RMSD graphs of the simulations were analyzed to study the amino acid trajectories; it is seen that no significant change in the Cα atoms from the initial structure was shown during MD simulations. With the complex of ligand 36 showing a maximum of around 0.35 nm deviation from the initial structure while the protein and other complexes showing deviations below 0.3 nm, it is observed that the trajectories were stable for the whole simulation time (Figure 7A). To understand the stability of the ligand, the RMSD plots of the ligand for Cα atoms of the protein were generated. These ligand RMSD plots suggest that the ligand interactions with the protein were very stable throughout the simulation time except for isorutarine, which showed major deviations ranging below 0.5 nm (Figure 7B). Thus, these protein–ligand complexes were considered for further analysis.
Figure 7.

Graphs as generated during molecular dynamics: (A) RMSD-Cα atoms, (B) RMSD-Ligands, (C) RMSF-Cα atoms, and (D) RMSF-Ligands.
To further evaluate the protein stability and understand the effects of ligand on the protein structure’s flexibility, the mean per residue fluctuation of the protein backbone was studied using RMSF analysis. The root-mean-square fluctuation (RMSF) of all the Cα atoms of the protein over the simulation time indicated that the protein showed high fluctuation when ligated with isorutarine as compared to other ligands. The results also indicate that the protein gained flexibility due to the ligation of isorutarine (Figure 7C) significantly affecting the overall binding of isorutarine with the protein. To understand the ligand’s changes, the RMSF of the ligands was generated and analyzed for the atom-wise fluctuations of the molecule. These residues majorly showed RMSF values of <0.2 nm suggesting their stability in interactions (Figure 7D).
Further, to understand the protein’s stability with respect to its secondary structure, the distribution of the secondary structure elements (SSE) was generated using DSSP. The secondary structure timeline evolution (Figure S3A–D) and the SSE percentage (Figure 8A–D) for compounds 10_, 36, isorutarine, and unligated protein indicate that the deviation in the secondary and tertiary structure conformations was negligible with a 100 ns simulation period. All the SSE were found to be persistent and transient, further revealing the protein stability.
Figure 8.

SSE plots generated using DSSP: (A) unligated protein, (B) isorutarine ligated protein (C), protein ligated with compound 10_, and (D) protein ligated with compound 36.
The radius of gyration (Rg) revealing the mass-weighted root-mean-square distance of atoms from their center of mass is studied to analyze the compounds’ stability. The competence and shape of the protein structures throughout the simulation time of 100 ns can be seen in the plot of Rg (Figure 9A). Throughout the simulation, the unligated protein and protein ligated with compounds 10_, 36, and isorutarine displayed a similar pattern in terms of the Rg value with Rg scores ranging majorly below 2.90 nm. To further examine, the solvent-accessible surface area (SASA) was studied to analyze the changes in the hydrophilic and hydrophobic residues (Figure 9B). The SASA results showed that all the ligated proteins showed a similar or higher SASA value than the unligated protein, retaining accessibility throughout the simulation time.
Figure 9.

Structural and interaction plots generated during molecular dynamics: (A) the radius of gyration Rg, (B) solvent-accessible surface area SASA, (C) H-bond protein–ligand, and (D) H-bond protein–protein.
To quantify the strength of the interactions between the ligand and receptor, the nonbonding energies and hydrogen bonding between protein and the ligands throughout the simulation time were also studied and are presented in Figure 9C,D. The graph reveals that the ligand residues interacted with the protein for the whole simulation time. Ligand 36 shows significantly better binding energy than ligand 10_ and isorutarine in terms of Coulomb interaction energy, while isorutarine shows better interactions with protein in terms of Lennard-Jones interaction energy. Overall, the contacts and binding energies between the studied ligands and the protein suggest that the ligated protein complexes are stable (Figure 10A,B).
Figure 10.

Nonbonded interaction energy graphs: (A) short-range Coulombic potential and (B) short-range Lennard-Jones potential.
The essential dynamic analysis was performed using large-scale motion data during the simulation to support the results. The data was assessed using PCA analysis. The eigenvectors’ plot revealed that all the ligated proteins acted similarly to the unligated protein, confirming the ligation’s stability at 300 K (Figure 11). The subspace pertaining to the eigenvectors is considered from the largest associated eigenvalues during the protein dynamics. The ligated and unligated proteins’ overall flexibility was investigated using a covariance matrix generated from the Cα atomic positional fluctuations.
Figure 11.

Projection of the motion of the protein in the phase space along the first two principal eigenvectors at 300 K: (A) unligated protein, (B) protein ligated with isorutarine, (C) protein ligated with compound 10_, (D) protein ligated with compound 36, and (E) unligated protein (black) vs ligated protein (isorutarine – red, 10 _ – green, 36 – blue).
Conclusions
In recent times, due to lifestyle changes, diabetes has become a global burden on human health, making it a major area of biological research. Lysosomal α-glucosidase (GAA) is a therapeutic target for drugs involved in diabetes. Given this, to inhibit GAA activities, we generated the pharmacophore and atom-based QSAR models of 116 coumarin derivatives using experimental IC50 values. The results of QSAR based on the test set suggest that it is a capable and reliable model for a wide range of structures related to coumarin. We further predicted these coumarin derivatives’ binding capability against lysosomal α-glucosidase to determine their inhibitory activities using molecular docking studies. The molecular docking studies suggest that the coumarin derivatives could act as promising agents toward inhibiting GAA.
Further, the ADMET properties of the coumarin derivatives suggest their drug-likeliness. The top three scoring compounds from molecular docking studies were subjected to molecular dynamics simulations to study their binding stability. With an average RMSD of 0.25 nm, all the ligated proteins showed promising binding stabilities with isorutarine showing the highest stability with RMSD below 0.25 nm for the whole simulation time. The RMSF changes in interaction energies, hydrogen bond formation, and secondary structure evolution were studied among other simulation studies to validate the protein–ligand binding stability further. With an average RMSF and radius of gyration of about 0.10 and 2.87 nm, respectively, the ligands are said to show high binding stability toward the protein. The PCA analysis and binding energy studies suggest that among the studied compounds, majorly, compound 10_ could be considered as a promising drug toward lysosomal α-glucosidase.
Materials and Methods
Dataset and Tools
All 116 structures of coumarin derivatives with their IC50 (μM) against lysosomal α-glucosidase selected for the present study were taken from the reported literature39,47−52 (Table 1). The enzyme lysosomal α-glucosidase inhibition study was performed spectrophotometrically using the same literature from where the activities of coumarin derivative compounds were taken.47 DMSO (10% final concentration) as control and acarbose as the standard inhibitor of lysosomal α-glucosidase were used. The percentage of enzyme lysosomal α-glucosidase inhibition for each compound was calculated using the following formula
Table 1. Pharmacophoric Model of QSAR Building Datasets and Results.
| title of the ligand | pharm set | QSAR Set | num sites matched | site score | vector score | volume score | fitness | experimental IC50 (μM) | experimental pIC50 (μM) | predicted activity pIC50 (μM) |
|---|---|---|---|---|---|---|---|---|---|---|
| 1 | active | training | 5 | 0.956 | 0.576 | 0.591 | 2.124 | 8.32 | 5.08 | 5.721 |
| 4c | active | training | 5 | 0.956 | 0.576 | 0.582 | 2.115 | 4.43 | 5.354 | 5.747 |
| 5a | active | training | 5 | 0.935 | 0.577 | 0.585 | 2.097 | 1.47 | 5.833 | 5.781 |
| 5b | active | training | 5 | 0.935 | 0.577 | 0.576 | 2.088 | 3.38 | 5.471 | 5.806 |
| 9b | active | training | 5 | 0.954 | 0.892 | 0.89 | 2.736 | 6.42 | 5.192 | 5.889 |
| 9c | active | training | 5 | 0.954 | 0.892 | 0.878 | 2.724 | 1.71 | 5.767 | 5.904 |
| 10a | active | test | 5 | 0.934 | 0.893 | 0.866 | 2.693 | 4.61 | 5.336 | 5.958 |
| 10b | active | training | 5 | 0.934 | 0.893 | 0.842 | 2.67 | 2.11 | 5.676 | 5.941 |
| 14a | active | training | 5 | 0.926 | 0.792 | 0.595 | 2.313 | 3.55 | 5.45 | 5.718 |
| 17a | active | test | 5 | 1 | 1 | 1 | 3 | 3.87 | 5.412 | 5.839 |
| 17c | active | training | 5 | 1 | 0.881 | 0.973 | 2.854 | 4.17 | 5.38 | 5.865 |
| 18b | active | training | 5 | 0.958 | 0.882 | 0.952 | 2.791 | 9.35 | 5.029 | 5.927 |
| 10_ | active | training | 5 | 0.616 | 0.421 | 0.376 | 1.413 | 0.86 | 6.066 | 5.466 |
| 11_ | active | test | 5 | 0.387 | 0.791 | 0.436 | 1.614 | 2.82 | 5.55 | 5.527 |
| 6a | active | training | 5 | 0.145 | 0.622 | 0.386 | 1.153 | 0.12 | 6.921 | 5.866 |
| 6e | active | test | 5 | 0.039 | 0.85 | 0.409 | 1.298 | 0.59 | 6.229 | 6.064 |
| 6f | active | training | 5 | 0.039 | 0.85 | 0.409 | 1.298 | 0.11 | 6.959 | 6.058 |
| 6h | active | test | 5 | 0.273 | 0.798 | 0.295 | 1.366 | 0.51 | 6.292 | 5.415 |
| 6k | active | training | 5 | 0.137 | 0.623 | 0.382 | 1.142 | 0.12 | 6.921 | 5.888 |
| 6l | active | training | 5 | 0.039 | 0.85 | 0.406 | 1.295 | 0.51 | 6.292 | 6.083 |
| 6n | active | test | 5 | 0.039 | 0.85 | 0.401 | 1.29 | 0.14 | 6.854 | 6.075 |
| 3f | active | training | 5 | 0.221 | 0.763 | 0.265 | 1.248 | 2.53 | 5.597 | 5.609 |
| 3h | active | test | 5 | 0.322 | 0.823 | 0.382 | 1.527 | 9.27 | 5.033 | 5.69 |
| 3i | active | test | 5 | 0.219 | 0.762 | 0.264 | 1.244 | 5.83 | 5.234 | 5.6 |
| 4 | inactive | test | 4 | 0.309 | 0 | 0.465 | 0.773 | 2567 | 2.591 | 3.94 |
| 5 | inactive | training | 4 | –0.022 | 0 | 0.415 | 0.393 | 280.38 | 3.552 | 4.136 |
| 6 | inactive | test | 4 | 0.202 | 0 | 0.279 | 0.481 | 60.88 | 4.216 | 3.953 |
| 7 | inactive | test | 3 | 0.414 | 0 | 0.237 | 0.525 | 1000 | 3 | 3.86 |
| 8 | inactive | training | 4 | –0.022 | 0 | 0.471 | 0.449 | 69.6 | 4.157 | 4.252 |
| 9 | inactive | training | 4 | 0.309 | 0 | 0.515 | 0.823 | 118.29 | 3.927 | 4.065 |
| 10_ | inactive | training | 4 | –0.022 | 0 | 0.426 | 0.404 | 1000 | 3 | 4.152 |
| 11 | inactive | training | 4 | 0.309 | 0 | 0.48 | 0.789 | 16.39 | 4.785 | 3.983 |
| 13 | inactive | training | 4 | 0.309 | 0 | 0.461 | 0.77 | 13.46 | 4.871 | 3.956 |
| 14 | inactive | training | 4 | 0.202 | 0 | 0.293 | 0.495 | 212.72 | 3.672 | 3.943 |
| 15 | inactive | training | 4 | 0.309 | 0 | 0.465 | 0.774 | 29.05 | 4.537 | 3.919 |
| 18 | inactive | training | 4 | 0.309 | 0 | 0.479 | 0.788 | 86.91 | 4.061 | 3.953 |
| 19 | inactive | training | 4 | –0.022 | 0 | 0.438 | 0.416 | 1000 | 3 | 4.157 |
| 20 | inactive | training | 4 | 0.309 | 0 | 0.47 | 0.778 | 1000 | 3 | 4.041 |
| 22 | inactive | training | 4 | 0.202 | 0 | 0.304 | 0.506 | 1000 | 3 | 3.9 |
| 23 | inactive | training | 4 | 0.309 | 0 | 0.514 | 0.823 | 25.48 | 4.594 | 4.041 |
| 24 | inactive | test | 4 | 0.309 | 0 | 0.494 | 0.803 | 27.42 | 4.562 | 4.136 |
| 25 | inactive | training | 4 | 0.309 | 0 | 0.51 | 0.818 | 11.49 | 4.94 | 4.075 |
| 26 | inactive | training | 4 | 0.309 | 0 | 0.496 | 0.805 | 1000 | 3 | 3.94 |
| 27 | inactive | test | 4 | 0.257 | 0 | 0.219 | 0.477 | 70.26 | 4.153 | 3.962 |
| 29 | inactive | training | 4 | 0.551 | 0 | 0.248 | 0.799 | 29.89 | 4.524 | 3.941 |
| 30 | inactive | training | 4 | 0.309 | 0 | 0.48 | 0.789 | 19.04 | 4.72 | 3.949 |
| 31 | inactive | test | 4 | 0.309 | 0 | 0.475 | 0.784 | 19.08 | 4.719 | 3.965 |
| 32 | inactive | training | 4 | 0.309 | 0 | 0.48 | 0.789 | 1000 | 3 | 3.929 |
| 35 | inactive | test | 4 | 0.309 | 0 | 0.49 | 0.799 | 10.81 | 4.966 | 4.149 |
| 38 | inactive | training | 4 | 0.551 | 0 | 0.259 | 0.81 | 20.23 | 4.694 | 3.925 |
| 39 | inactive | test | 4 | 0.551 | 0 | 0.259 | 0.81 | 13.09 | 4.883 | 3.926 |
| 40 | inactive | test | 3 | 0.415 | 0 | 0.235 | 0.523 | 1000 | 3 | 3.842 |
| 41 | inactive | training | 4 | 0.202 | 0 | 0.275 | 0.477 | 13.43 | 4.872 | 4.166 |
| 42 | inactive | training | 4 | 0.551 | 0 | 0.254 | 0.804 | 39.08 | 4.408 | 3.922 |
| 44 | inactive | training | 4 | 0.309 | 0 | 0.484 | 0.793 | 1000 | 3 | 4 |
| 45 | inactive | training | 4 | –0.022 | 0 | 0.442 | 0.42 | 1000 | 3 | 4.209 |
| 46 | inactive | training | 4 | 0.309 | 0 | 0.48 | 0.789 | 1000 | 3 | 4.013 |
| 47 | inactive | test | 4 | 0.309 | 0 | 0.484 | 0.793 | 35.71 | 4.447 | 3.982 |
| nodakenin | inactive | test | 4 | 0.097 | 0 | 0.163 | 0.26 | 250 | 3.602 | 3.825 |
| nodakenetin | inactive | training | 4 | 0.055 | 0 | 0.287 | 0.342 | 720.29 | 3.142 | 3.906 |
| umbelliferone | inactive | test | 4 | 0.309 | 0 | 0.331 | 0.639 | 629.87 | 3.201 | 3.855 |
| 3’R-O-acetyl-4’S-tigloylkhellactone | inactive | training | 4 | 0.549 | 0 | 0.363 | 0.912 | 93.39 | 4.03 | 4.016 |
| isorutarine | inactive | training | 4 | 0.551 | 0 | 0.301 | 0.852 | 250 | 3.602 | 3.947 |
| decursidin | inactive | training | 4 | 0.849 | 0 | 0.51 | 1.359 | 79.09 | 4.102 | 4.096 |
| 22’-isopropyl psoralene | inactive | training | 4 | 0.982 | 0 | 0.591 | 1.573 | 85.82 | 4.066 | 4.266 |
| 4a | inactive | training | 4 | 0.982 | 0 | 0.62 | 1.602 | 11.57 | 4.937 | 4.27 |
| 9a | inactive | training | 4 | 1 | 0 | 0.973 | 1.973 | 22.73 | 4.643 | 4.685 |
| 13a | inactive | training | 4 | 0.922 | 0 | 0.584 | 1.505 | 16.99 | 4.77 | 4.207 |
| 13b | inactive | training | 4 | 0.922 | 0 | 0.57 | 1.492 | 14.44 | 4.84 | 4.208 |
| 13c | inactive | test | 4 | 0.922 | 0 | 0.557 | 1.478 | 17.98 | 4.745 | 4.208 |
| 17b | inactive | training | 4 | 0.996 | 0 | 0.864 | 1.86 | 11.62 | 4.935 | 4.66 |
| 18a | inactive | training | 4 | 0.957 | 0 | 0.845 | 1.801 | 13.65 | 4.865 | 4.505 |
| 1_ | inactive | training | 4 | 0.309 | 0 | 0.348 | 0.657 | 52.7 | 4.278 | 3.853 |
| 2_ | inactive | training | 4 | 0.502 | 0 | 0.279 | 0.781 | 94.25 | 4.026 | 4.017 |
| 4’ | inactive | test | 4 | 0.308 | 0 | 0.365 | 0.673 | 96.1 | 4.017 | 3.828 |
| 5_ | inactive | training | 4 | 0.308 | 0 | 0.349 | 0.657 | 50.53 | 4.296 | 3.845 |
| 8_ | inactive | training | 3 | 0.537 | 0 | 0.314 | 0.673 | 35.3 | 4.452 | 4.137 |
| 6b | inactive | training | 4 | 0.473 | 0 | 0.186 | 0.659 | 100 | 4 | 4.055 |
| 6j | inactive | training | 4 | 0.473 | 0 | 0.184 | 0.656 | 100 | 4 | 4.045 |
| 6o | inactive | training | 4 | 0.473 | 0 | 0.184 | 0.657 | 100 | 4 | 4.047 |
| 3a | inactive | test | 4 | 0.364 | 0 | 0.393 | 0.757 | 12.71 | 4.896 | 4.237 |
| 3d | inactive | training | 4 | 0.364 | 0 | 0.386 | 0.75 | 46.42 | 4.333 | 4.23 |
| 3e | inactive | training | 4 | 0.364 | 0 | 0.408 | 0.771 | 44.76 | 4.349 | 4.241 |
| 9d | active | training | 5 | 0.954 | 0.772 | 0.865 | 2.591 | 3.1 | 5.509 | 5.887 |
| 6c | active | training | 5 | 0.039 | 0.85 | 0.41 | 1.299 | 0.92 | 6.036 | 6.054 |
| 6d | active | test | 5 | 0.137 | 0.623 | 0.389 | 1.149 | 1.62 | 5.79 | 5.877 |
| 6g | active | training | 5 | 0.501 | 0.807 | 0.311 | 1.618 | 0.09 | 7.046 | 5.46 |
| 6i | active | test | 5 | 0.039 | 0.85 | 0.4 | 1.289 | 0.42 | 6.377 | 6.051 |
| 6m | active | training | 5 | 0.039 | 0.85 | 0.401 | 1.29 | 0.13 | 6.886 | 6.067 |
| 3g | active | training | 5 | –0.086 | 0.608 | 0.246 | 0.768 | 5.64 | 5.249 | 5.225 |
| 3j | active | training | 5 | 0.218 | 0.762 | 0.265 | 1.245 | 5.21 | 5.283 | 5.609 |
| 12 | inactive | training | 4 | 0.309 | 0 | 0.48 | 0.788 | 19.39 | 4.712 | 3.97 |
| 16 | inactive | training | 4 | 0.309 | 0 | 0.474 | 0.783 | 10.16 | 4.993 | 3.94 |
| 17 | inactive | training | 4 | 0.202 | 0 | 0.273 | 0.474 | 11.54 | 4.938 | 3.953 |
| 21 | inactive | test | 4 | –0.022 | 0 | 0.411 | 0.389 | 1000 | 3 | 4.181 |
| 33 | inactive | training | 4 | 0.309 | 0 | 0.472 | 0.781 | 1000 | 3 | 3.976 |
| 34 | inactive | training | 4 | 0.309 | 0 | 0.494 | 0.803 | 18.8 | 4.726 | 4.116 |
| 36 | inactive | training | 4 | 0.551 | 0 | 0.242 | 0.793 | 247.34 | 3.607 | 3.942 |
| 43 | inactive | test | 4 | 0.551 | 0 | 0.253 | 0.804 | 1000 | 3 | 3.924 |
| angeloylkhellactone | inactive | training | 4 | 0.549 | 0 | 0.362 | 0.911 | 264.26 | 3.578 | 4.011 |
| 4-hydroxy Pd-C-III | inactive | training | 4 | 0.568 | 0 | 0.376 | 0.944 | 77.3 | 4.112 | 4.057 |
| 4′-methoxy Pd-C I | inactive | test | 4 | 0.568 | 0 | 0.371 | 0.94 | 89.19 | 4.05 | 4.055 |
| decursinol | inactive | training | 4 | 0.849 | 0 | 0.426 | 1.275 | 65.29 | 4.185 | 3.956 |
| umbelliferon 6-carboxylic acid | inactive | test | 4 | 0.748 | 0 | 0.365 | 1.113 | 172.1 | 3.764 | 3.998 |
| 4b | inactive | test | 4 | 0.982 | 0 | 0.605 | 1.588 | 14.37 | 4.843 | 4.268 |
| 14b | inactive | training | 4 | 0.924 | 0 | 0.567 | 1.491 | 11.83 | 4.927 | 4.199 |
| 4_ | inactive | test | 4 | 0.308 | 0 | 0.347 | 0.655 | 38.85 | 4.411 | 3.861 |
| 7_ | inactive | test | 4 | 0.309 | 0 | 0.345 | 0.654 | 56.2 | 4.25 | 3.874 |
| 3b | inactive | training | 4 | 0.364 | 0 | 0.394 | 0.757 | 34.35 | 4.464 | 4.237 |
| 3c | inactive | test | 4 | 0.644 | 0 | 0.229 | 0.873 | 25.35 | 4.596 | 3.956 |
IC50 values of inhibitors were calculated from the nonlinear regression curve using the Logit method.
All the taken compound structures were drawn using 2D Sketcher of Maestro 12.0 of Schrödinger LCC, 2019 (Figure S1). All the in silico studies were performed on Window 10 operating systems with 12GB RAM, 1 TB hard disc, and NVIDIA graphics. The pharmacophore hypothesis and 3D-QSAR model were generated in the Phase module, and docking and free binding calculation were performed using glide and Prime modules of Maestro. The molecular dynamics (MD) simulation was performed using GROMACS 2018 set up at the Central Computing Facility of Indian Institute of Information Technology Allahabad. The human lysosomal α-glucosidase enzyme’s crystal structure was retrieved from the Protein Data Bank (PDB) and was used for the molecular docking study.
Data Preparation
The 2D drawn structures of coumarin derivatives were converted to a 3D structure using the LigPrep module of Maestro 12.0 (Schrödinger 2019 LLC, USA), using the default settings. The specified chirality was retained, salts were removed, hydrogens were added, stereoisomers were generated, the ionization states were generated at a pH range of 7.0 ± 2.0 using the Epik module, and the energy minimization of molecules was performed using the OPLS2005 force field.58 The X-ray crystal structure of protein lysosomal α-glucosidase (PDB ID: 5KZX) with 2.0 Å resolution was downloaded from the RSCB Protein Data Bank (PDB) (https://www.rcsb.org/search). The retrieved protein structure of lysosomal α-glucosidase was prepared using the protein preparation wizard of Schrödinger Maestro 12.0.59 The process includes preprocessing by using ionization states, assigning bond orders, creating disulfide bonds, adding side-chain residues and missing atoms, and creating zero-order bonds to metals. PROPKA pH 7.0 and sample water orientations were used to optimize the structure, and restrained minimization was performed using the force field OPLS2005 until RSMD reached 0.30 Å.
Creating Pharmacophore-Based Models
The Phase module of Maestro has a tool to develop a pharmacophore model. The IC50 (μM) values of compounds were converted into pIC50 (μM) using a negative logarithm. The activity threshold of pIC50 = 5.0 μM was applied to set active from inactive compounds; i.e., the molecules with a pIC50 value above 5 μM are active (32 molecules) and below are inactive (79 inactive). Each ligand structure is elaborated by a set of pharmacophore sites representing various features of the structure. The type of structure, position of atoms, and the direction of characters defined the pharmacophore sites. In the hypothesis, the setting phase has acceptor of H-bond (A), donor of H-bond (D), hydrophobic (H), positive ionizable (P), negative ionizable (N), and aromatic ring (R) pharmacophore features. The method of pharmacophore was to find the best alignment and common features. To identify the common hypothesis of the pharmacophore, an active analog method was used, in which common pharmacophores were plucked from the set of active ligand conformers using a partitioning method that groups common pharmacophores according to their inner site distances. The generated pharmacophores were scored to identify active molecules and to obtain the best hypothesis.60 Common pharmacophores with statistically significant values were chosen for molecular alignments.
Building of 3D-QSAR Models
The Phase module of Maestro 12.0 provides the basis for generating the 3D-QSAR models by using molecules’ activity. 3D-QSAR based on pharmacophore does not consider molecule features beyond the model of the pharmacophore. This requires the attention of the whole molecular structure; therefore, an atom-based 3D-QSAR model is adventitious in analyzing the structure–activity relationships. In the atom-based model, 3D-QSAR alignment of the Phase module was used, where a ligand is treated as a set of overlapping van der Waals spheres.60,61 In this alignment, each atom is set into a simple rule, which are the following six categories:
-
1.
Atoms with a positive ionic charge (P);
-
2.
Atoms with negative ionic charges (N);
-
3.
Hydrogens attached to polar atoms classified as hydrogen bond donors (D);
-
4.
Nonionic nitrogen and oxygen classified as electron-withdrawing (W);
-
5.
Carbons, halogens, and C–H hydrogens classified as hydrophobic (H); and
-
6.
Other types of atoms classified as miscellaneous (X).
Atom-based 3D-QSAR modeling was performed using the selected hypothesis by splitting the dataset of compounds into training and test sets in a ratio of 70% training and 30% test set by using the random selection method. Atom-based 3D-QSAR models were developed for lysosomal α-glucosidase inhibitory activities by using the AANRR hypothesis. The model has generated using 78 ligands as a training set and a grid spacing of 1.0 Q. Three PLS factors were developed by 3D-QSAR modeling and further predicted ligands’ prediction activities with the test set.
Molecular Docking and ADME/T
Maestro’s glide module was used to perform molecular docking with the lysosomal α-glucosidase (PDB ID: 5KZX) enzyme receptor binding site. The receptor grid’s binding site was predicted using the SiteMap module of glide Maestro 12.0, and the receptor grid was generated using the receptor grid generation wizard with the first site predicted by Sitemap. The docking of the ligands with grid generated receptor lysosomal α-glucosidase (PDB ID: 5KZX) was performed on the virtual screening workflow in which QikPro was used for ADME/T properties of ligands in filtering. Epik was used to generate possible states at pH 7.0 ± 2, and flexible docking with glide Extra Precision (XP) was used to obtain the best and accurate result of docking. QikProp of Maestro was used to calculate the various descriptor values used in this study that provide information about the ligand/s regarding their drug-likeness.
Free Binding Energy/MM-GBSA Calculation
The prime module of Maestro 12.0 (Schrödinger, LLC, New York, NY, USA) calculates the binding free energy of docked ligand/s using the molecular mechanics-generalized Born surface area (MM-GBSA) method. MM-GBSA has a continuum solvent model, the solvent model of VSGB.62 The following equation was used to calculate the binding energy
where Ec is the enegy of the complex, EL is the energy of the ligand, and ER is the energy of the receptor.
Molecular Dynamics Simulation
The ligands with promising docking scores were subjected to MD simulations to study their conformational flexibility and binding stability using GROMACS (2018.2).62 As the force field parameters in the CHARMM3663,64 are largely available only for protein molecules, the force field parameters for the ligands used in this study were generated using CHARMM General Force Field (CGenFF) version 4.1.65 The CGenFF interface66 was used to generate topological, atomic, and charge parameters. Later, the proteins and the ligands topologies were merged, solvated, minimized, and equilibrated by an ad-hoc bash script. The TIP3P water model was used to solvate the protein–ligand complex. The system was further neutralized by adding Cl-/Na+ ions as required before minimizing the structure complex until the maximum force per atom was below 10.0 kJ/mol subjecting to the steepest descent algorithm. Further, to equilibrate the system, the NVT and NPT conserved ensembles were generated under constant temperature, volume, and pressure of 300 K and 1 bar, respectively, with a simulation time of 100 ps for each. After the equilibrated system was subjected to production runs of 100 ns with a time step of 2 fs using the leapfrog algorithm at a constant temperature and pressure of 300 K and 1 bar, respectively. The generated trajectory snapshots were analyzed using GROMACS analysis toolkit utilities, and the graphs were generated using MATLAB.
Acknowledgments
The authors thank the Department of Applied Sciences, Indian Institute of Information Technology Allahabad, Prayagraj – 211015, India, for providing the laboratory space and software facility. The authors also thank the Central Computing Facility (CCF) of IIITA, for providing the supercomputing facility for performing molecular dynamics simulation.
Supporting Information Available
The Supporting Information is available free of charge at https://pubs.acs.org/doi/10.1021/acsomega.0c03871.
Figure S1 Structures of the 116 coumarin derivatives. Figure S2 3D protein and 3D ligand interaction diagram (left) and 3D binding surface area diagram (right). Figure S3 The secondary structure timeline evolution using DSSP. Table S1 Docking of coumarin derivatives with lysosomal α-glucosidase and ADME/T properties of ligands. Table S2 MM-GBSA of docked poses of ligand and lysosomal α-glucosidase (PDF)
Author Contributions
A.K.M. provided the idea of work and took part in data collection, pharmacophore and QSAR modeling, molecular docking, and writing and formatting of the manuscript. V.M. took part in molecular dynamics simulation and writing and formatting of the manuscript. N.M. provided guidance of work and reviewed the manuscript.
The authors declare no competing financial interest.
Supplementary Material
References
- Imam K.Clinical Features, Diagnostic Criteria and Pathogenesis of Diabetes Mellitus. In Diabetes; Ahmad S. I., Ed.; Springer New York: New York, NY, 2013; Vol. 771, pp. 340–355, 10.1007/978-1-4614-5441-0_25. [DOI] [PubMed] [Google Scholar]
- International Diabetes Federation . IDF Diabetes Atlas. Brussels, Belgium: International Diabetes Federation.
- Brownlee M. Biochemistry and Molecular Cell Biology of Diabetic Complications. Nature 2001, 414, 813–820. 10.1038/414813a. [DOI] [PubMed] [Google Scholar]
- López-Candales A. Metabolic Syndrome X: A Comprehensive Review of the Pathophysiology and Recommended Therapy. J Med 2001, 32, 283–300. [PubMed] [Google Scholar]
- Lillelund V. H.; Jensen H. H.; Liang X.; Bols M. Recent Developments of Transition-State Analogue Glycosidase Inhibitors of Non-Natural Product Origin. Chem. Rev. 2002, 102, 515–554. 10.1021/cr000433k. [DOI] [PubMed] [Google Scholar]
- Pearson M. S. M.; Mathé-Allainmat M.; Fargeas V.; Lebreton J. Recent Advances in the Total Synthesis of Piperidine Azasugars. Eur. J. Org. Chem. 2005, 2005, 2159–2191. 10.1002/ejoc.200400823. [DOI] [Google Scholar]
- Hirsh A.; Yao S.; Young J.; Cheeseman C. Inhibition of Glucose Absorption in the Rat Jejunum: A Novel Action of Alpha-D-Glucosidase Inhibitors. Gastroenterology 1997, 113, 205–211. 10.1016/S0016-5085(97)70096-9. [DOI] [PubMed] [Google Scholar]
- Dove A. Seeking Sweet Relief for Diabetes. Nat. Biotechnol. 2002, 20, 977–981. 10.1038/nbt1002-977. [DOI] [PubMed] [Google Scholar]
- Davies G. J.; Wilson K. S. Trapped in the act of catalysis. Nat. Struct. Biol. 1999, 6, 406–408. 10.1038/8200. [DOI] [PubMed] [Google Scholar]
- Abuelizz H. A.; Anouar E. H.; Ahmad R.; Azman N. I. I. N.; Marzouk M.; Al-Salahi R. Triazoloquinazolines as a New Class of Potent α-Glucosidase Inhibitors: In Vitro Evaluation and Docking Study. PLoS One 2019, 14, e0220379 10.1371/journal.pone.0220379. [DOI] [PMC free article] [PubMed] [Google Scholar]
- Braun C.; Brayer G. D.; Withers S. G. Mechanism-Based Inhibition of Yeast α-Glucosidase and Human Pancreatic α -Amylase by a New Class of Inhibitors: 2-DEOXY-2,2-DIFLUORO-α-GLYCOSIDES. J. Biol. Chem. 1995, 270, 26778–26781. 10.1074/jbc.270.45.26778. [DOI] [PubMed] [Google Scholar]
- Jacob G. S. Glycosylation Inhibitors in Biology and Medicine. Curr. Opin. Struct. Biol. 1995, 5, 605–611. 10.1016/0959-440X(95)80051-4. [DOI] [PubMed] [Google Scholar]
- Mehta A.; Zitzmann N.; Rudd P. M.; Block T. M.; Dwek R. A. α-Glucosidase Inhibitors as Potential Broad Based Anti-Viral Agents. FEBS Lett. 1998, 430, 17–22. 10.1016/S0014-5793(98)00525-0. [DOI] [PubMed] [Google Scholar]
- Sou S.; Takahashi H.; Yamasaki R.; Kagechika H.; Endo Y.; Hashimoto Y. α-Glucosidase Inhibitors with a 4,5,6,7-Tetrachlorophthalimide Skeleton Pendanted with a Cycloalkyl or Dicarba-Closo-Dodecaborane Group. Chem. Pharm. Bull. 2001, 49, 791–793. 10.1248/cpb.49.791. [DOI] [PubMed] [Google Scholar]
- Khan M.; Yousaf M.; Wadood A.; Junaid M.; Ashraf M.; Alam U.; Ali M.; Arshad M.; Hussain Z.; Khan K. M. Discovery of Novel Oxindole Derivatives as Potent α-Glucosidase Inhibitors. Bioorg. Med. Chem. 2014, 22, 3441–3448. 10.1016/j.bmc.2014.04.033. [DOI] [PubMed] [Google Scholar]
- Dwek R. A.; Butters T. D.; Platt F. M.; Zitzmann N. Targeting Glycosylation as a Therapeutic Approach. Nat Rev Drug Discov 2002, 1, 65–75. 10.1038/nrd708. [DOI] [PubMed] [Google Scholar]
- Winchester B.; Fleet G. W. J. Amino-Sugar Glycosidase Inhibitors: Versatile Tools for Glycobiologists. Glycobiology 1992, 2, 199–210. 10.1093/glycob/2.3.199. [DOI] [PubMed] [Google Scholar]
- Fischer P. B.; Karlsson G. B.; Dwek R. A.; Platt F. M. N-Butyldeoxynojirimycin-Mediated Inhibition of Human Immunodeficiency Virus Entry Correlates with Impaired Gp120 Shedding and Gp41 Exposure. J. Virol. 1996, 70, 7153–7160. 10.1128/JVI.70.10.7153-7160.1996. [DOI] [PMC free article] [PubMed] [Google Scholar]
- Fischer P. B.; Karlsson G. B.; Butters T. D.; Dwek R. A.; Platt F. M. N-Butyldeoxynojirimycin-Mediated Inhibition of Human Immunodeficiency Virus Entry Correlates with Changes in Antibody Recognition of the V1/V2 Region of Gp120. J. Virol. 1996, 70, 7143–7152. 10.1128/JVI.70.10.7143-7152.1996. [DOI] [PMC free article] [PubMed] [Google Scholar]
- Walker B. D.; Kowalski M.; Goh W. C.; Kozarsky K.; Krieger M.; Rosen C.; Rohrschneider L.; Haseltine W. A.; Sodroski J. Inhibition of Human Immunodeficiency Virus Syncytium Formation and Virus Replication by Castanospermine. Proc. Nat. Acad. Sci. 1987, 84, 8120–8124. 10.1073/pnas.84.22.8120. [DOI] [PMC free article] [PubMed] [Google Scholar]
- Martin A. E.; Montgomery P. A. Acarbose: An α-Glucosidase Inhibitor. Am. J. Health-Syst. Pharm. 1996, 53, 2277–2290. 10.1093/ajhp/53.19.2277. [DOI] [PubMed] [Google Scholar]
- Chaudhry F.; Naureen S.; Huma R.; Shaukat A.; Al-Rashida M.; Asif N.; Ashraf M.; Munawar M. A.; Khan M. A. In Search of New α -Glucosidase Inhibitors: Imidazolylpyrazole Derivatives. Bioorg. Chem. 2017, 71, 102–109. 10.1016/j.bioorg.2017.01.017. [DOI] [PubMed] [Google Scholar]
- Salar U.; Taha M.; Khan K. M.; Ismail N. H.; Imran S.; Perveen S.; Gul S.; Wadood A. Syntheses of New 3-Thiazolyl Coumarin Derivatives, in Vitro α -Glucosidase Inhibitory Activity, and Molecular Modeling Studies. Eur. J. Med. Chem. 2016, 122, 196–204. 10.1016/j.ejmech.2016.06.037. [DOI] [PubMed] [Google Scholar]
- Liu Z.; Ma S. Recent Advances in Synthetic α-Glucosidase Inhibitors. ChemMedChem 2017, 12, 819–829. 10.1002/cmdc.201700216. [DOI] [PubMed] [Google Scholar]
- Imran S.; Taha M.; Ismail N. H.; Kashif S. M.; Rahim F.; Jamil W.; Hariono M.; Yusuf M.; Wahab H. Synthesis of Novel Flavone Hydrazones: In-Vitro Evaluation of α-Glucosidase Inhibition, QSAR Analysis and Docking Studies. Eur. J. Med. Chem. 2015, 105, 156–170. 10.1016/j.ejmech.2015.10.017. [DOI] [PubMed] [Google Scholar]
- Kalra S. Alpha Glucosidase Inhibitors. JPMA, J. Pak. Med. Assoc. 2014, 64, 474–476. [PubMed] [Google Scholar]
- Preston P.; Synthesis N. Reactions, and Spectroscopic Properties of Benzimidazoles. Chem. Rev. 1974, 74, 279–314. 10.1021/cr60289a001. [DOI] [Google Scholar]
- Taha M.; Ismail N. H.; Lalani S.; Fatmi M. Q.; Atia-tul-Wahab; Siddiqui S.; Khan K. M.; Imran S.; Choudhary M. I. Synthesis of Novel Inhibitors of α-Glucosidase Based on the Benzothiazole Skeleton Containing Benzohydrazide Moiety and Their Molecular Docking Studies. Eur. J. Med. Chem. 2015, 92, 387–400. 10.1016/j.ejmech.2015.01.009. [DOI] [PubMed] [Google Scholar]
- Al-Salahi R.; Ahmad R.; Anouar E.; Iwana Nor Azman N. I.; Marzouk M.; Abuelizz H. A. 3-Benzyl(Phenethyl)-2-Thioxobenzo[g]Quinazolines as a New Class of Potent α-Glucosidase Inhibitors: Synthesis and Molecular Docking Study. Future Med. Chem. 2018, 10, 1889–1905. 10.4155/fmc-2018-0141. [DOI] [PubMed] [Google Scholar]
- Abuelizz H. A.; Iwana N. A. N. I.; Ahmad R.; Anouar E.-H.; Marzouk M.; Al-Salahi R. Synthesis, Biological Activity and Molecular Docking of New Tricyclic Series as α-Glucosidase Inhibitors. BMC Chem. 2019, 13, 52. 10.1186/s13065-019-0560-4. [DOI] [PMC free article] [PubMed] [Google Scholar]
- Wang G.; Wang J.; He D.; Li X.; Li J.; Peng Z. Synthesis and Biological Evaluation of Novel 1,2,4-Triazine Derivatives Bearing Carbazole Moiety as Potent α-Glucosidase Inhibitors. Bioorg. Med. Chem. Lett. 2016, 26, 2806–2809. 10.1016/j.bmcl.2016.04.071. [DOI] [PubMed] [Google Scholar]
- Raza A.; Saeed A.; Ibrar A.; Muddassar M.; Khan A. A.; Iqbal J. Pharmacological Evaluation and Docking Studies of 3-Thiadiazolyl- and Thioxo-1,2,4-Triazolylcoumarin Derivatives as Cholinesterase Inhibitors. ISRN Pharmacology 2012, 2012, 1–11. 10.5402/2012/707932. [DOI] [PMC free article] [PubMed] [Google Scholar]
- Thakur A.; Singla R.; Jaitak V. Coumarins as Anticancer Agents: A Review on Synthetic Strategies, Mechanism of Action and SAR Studies. Eur. J. Med. Chem. 2015, 101, 476–495. 10.1016/j.ejmech.2015.07.010. [DOI] [PubMed] [Google Scholar]
- Trenor S. R.; Shultz A. R.; Love B. J.; Long T. E. Coumarins in Polymers: From Light Harvesting to Photo-Cross-Linkable Tissue Scaffolds. Chem. Rev. 2004, 104, 3059–3078. 10.1021/cr030037c. [DOI] [PubMed] [Google Scholar]
- Kirkiacharian S.; Thuy D. T.; Sicsic S.; Bakhchinian R.; Kurkjian R.; Tonnaire T. Structure–Activity Relationships of Some 3-Substituted-4-Hydroxycoumarins as HIV-1 Protease Inhibitors. Il Farmaco 2002, 57, 703–708. 10.1016/S0014-827X(02)01264-8. [DOI] [PubMed] [Google Scholar]
- Hwu J. R.; Lin S.-Y.; Tsay S.-C.; De Clercq E.; Leyssen P.; Neyts J. Coumarin–Purine Ribofuranoside Conjugates as New Agents against Hepatitis C Virus. J. Med. Chem. 2011, 54, 2114–2126. 10.1021/jm101337v. [DOI] [PubMed] [Google Scholar]
- Hofmanová J.; Kozubík A.; Dušek L.; Pacherník J. Inhibitors of Lipoxygenase Metabolism Exert Synergistic Effects with Retinoic Acid on Differentiation of Human Leukemia HL-60 Cells. Eur. J. Pharmacol. 1998, 350, 273–284. 10.1016/S0014-2999(98)00264-7. [DOI] [PubMed] [Google Scholar]
- Soni R.; Soman S. S. Design and Synthesis of Aminocoumarin Derivatives as DPP-IV Inhibitors and Anticancer Agents. Bioorg. Chem. 2018, 79, 277–284. 10.1016/j.bioorg.2018.05.008. [DOI] [PubMed] [Google Scholar]
- Adib M.; Peytam F.; Rahmanian-Jazi M.; Mohammadi-Khanaposhtani M.; Mahernia S.; Bijanzadeh H. R.; Jahani M.; Imanparast S.; Faramarzi M. A.; Mahdavi M.; Larijani B. Design, Synthesis and in Vitro α-Glucosidase Inhibition of Novel Coumarin-Pyridines as Potent Antidiabetic Agents. New J. Chem. 2018, 42, 17268–17278. 10.1039/C8NJ02495B. [DOI] [Google Scholar]
- Durgapal S. D.; Soman S. S. Evaluation of Novel Coumarin-Proline Sulfonamide Hybrids as Anticancer and Antidiabetic Agents. Synth. Commun. 2019, 1–15. 10.1080/00397911.2019.1647439. [DOI] [Google Scholar]
- Singh A.-K.; Patel P. K.; Choudhary K.; Joshi J.; Yadav D.; Jin J.-O. Quercetin and Coumarin Inhibit Dipeptidyl Peptidase-IV and Exhibits Antioxidant Properties: In Silico, In Vitro, Ex Vivo. Biomolecules 2020, 10, 207. 10.3390/biom10020207. [DOI] [PMC free article] [PubMed] [Google Scholar]
- Zhao D.-G.; Zhou A.-Y.; Du Z.; Zhang Y.; Zhang K.; Ma Y.-Y. Coumarins with α-Glucosidase and α-Amylase Inhibitory Activities from the Flower of Edgeworthia Gardneri. Fitoterapia 2015, 107, 122–127. 10.1016/j.fitote.2015.10.012. [DOI] [PubMed] [Google Scholar]
- Sun H.; Song X.; Tao Y.; Li M.; Yang K.; Zheng H.; Jin Z.; Dodd R. H.; Pan G.; Lu K.; Yu P. Synthesis & α-Glucosidase Inhibitory & Glucose Consumption-Promoting Activities of Flavonoid–Coumarin Hybrids. Future Med. Chem. 2018, 10, 1055–1066. 10.4155/fmc-2017-0293. [DOI] [PubMed] [Google Scholar]
- Abraham K.; Wöhrlin F.; Lindtner O.; Heinemeyer G.; Lampen A. Toxicology and Risk Assessment of Coumarin: Focus on Human Data. Mol. Nutr. Food Res. 2010, 54, 228–239. 10.1002/mnfr.200900281. [DOI] [PubMed] [Google Scholar]
- Mbarki S.; Elhallaoui M.; Dguigui K.. 3D-QSAR for α-Glucosidase Inhibitory Activity of N-(Phenoxyalkyl) Phthalimide Derivatives. IJRRAS , 11, 395–401. [Google Scholar]
- Dixon S. L.; Smondyrev A. M.; Knoll E. H.; Rao S. N.; Shaw D. E.; Friesner R. A. PHASE: A New Engine for Pharmacophore Perception, 3D QSAR Model Development, and 3D Database Screening: 1. Methodology and Preliminary Results. J. Comput.-Aided Mol. Des. 2006, 20, 647–671. 10.1007/s10822-006-9087-6. [DOI] [PubMed] [Google Scholar]
- Nikookar H.; Mohammadi-Khanaposhtani M.; Imanparast S.; Faramarzi M. A.; Ranjbar P. R.; Mahdavi M.; Larijani B. Design, Synthesis and in Vitro α-Glucosidase Inhibition of Novel Dihydropyrano[3,2-c]Quinoline Derivatives as Potential Anti-Diabetic Agents. Bioorg. Chem. 2018, 77, 280–286. 10.1016/j.bioorg.2018.01.025. [DOI] [PubMed] [Google Scholar]
- Hu Y.; Wang B.; Yang J.; Liu T.; Sun J.; Wang X. Synthesis and Biological Evaluation of 3-Arylcoumarin Derivatives as Potential Anti-Diabetic Agents. J. Enzyme Inhib. Med. Chem. 2019, 34, 15–30. 10.1080/14756366.2018.1518958. [DOI] [PMC free article] [PubMed] [Google Scholar]
- Ibrar A.; Zaib S.; Khan I.; Shafique Z.; Saeed A.; Iqbal J. New Prospects for the Development of Selective Inhibitors of α -Glucosidase Based on Coumarin-Iminothiazolidinone Hybrids: Synthesis, in-Vitro Biological Screening and Molecular Docking Analysis. J. Taiwan Inst. Chem. Eng. 2017, 81, 119–133. 10.1016/j.jtice.2017.09.041. [DOI] [Google Scholar]
- Shen Q.; Shao J.; Peng Q.; Zhang W.; Ma L.; Chan A. S. C.; Gu L. Hydroxycoumarin Derivatives: Novel and Potent α-Glucosidase Inhibitors. J. Med. Chem. 2010, 53, 8252–8259. 10.1021/jm100757r. [DOI] [PubMed] [Google Scholar]
- Yousof Ali M. Y.; Jung H. A.; Choi J. S. Anti-Diabetic and Anti-Alzheimer’s Disease Activities of Angelica Decursiva. Arch. Pharmacal Res. 2015, 38, 2216–2227. 10.1007/s12272-015-0629-0. [DOI] [PubMed] [Google Scholar]
- Chaudhry F.; Choudhry S.; Huma R.; Ashraf M.; Al-Rashida M.; Munir R.; Sohail R.; Jahan B.; Munawar M. A.; Khan M. A. Hetarylcoumarins: Synthesis and Biological Evaluation as Potent α -Glucosidase Inhibitors. Bioorg. Chem. 2017, 73, 1–9. 10.1016/j.bioorg.2017.05.009. [DOI] [PubMed] [Google Scholar]
- Ali M. Y.; Jannat S.; Jung H. A.; Jeong H. O.; Chung H. Y.; Choi J. S. Coumarins from Angelica Decursiva Inhibit α-Glucosidase Activity and Protein Tyrosine Phosphatase 1B. Chem.-Biol. Interact. 2016, 252, 93–101. 10.1016/j.cbi.2016.04.020. [DOI] [PubMed] [Google Scholar]
- Greenwood J. R.; Calkins D.; Sullivan A. P.; Shelley J. C. Towards the Comprehensive, Rapid, and Accurate Prediction of the Favorable Tautomeric States of Drug-like Molecules in Aqueous Solution. J. Comput.-Aided Mol. Des. 2010, 24, 591–604. 10.1007/s10822-010-9349-1. [DOI] [PubMed] [Google Scholar]
- Shelley J. C.; Cholleti A.; Frye L. L.; Greenwood J. R.; Timlin M. R.; Uchimaya M. Epik: A Software Program for PK( a ) Prediction and Protonation State Generation for Drug-like Molecules. J. Comput.-Aided Mol. Des. 2007, 21, 681–691. 10.1007/s10822-007-9133-z. [DOI] [PubMed] [Google Scholar]
- Daina A.; Michielin O.; Zoete V. SwissADME: A Free Web Tool to Evaluate Pharmacokinetics, Drug-Likeness and Medicinal Chemistry Friendliness of Small Molecules. Sci. Rep. 2017, 7, 42717. 10.1038/srep42717. [DOI] [PMC free article] [PubMed] [Google Scholar]
- Teli M.; K R. G. Pharmacophore Generation and Atom-Based 3D-QSAR of N-Iso-Propyl Pyrrole-Based Derivatives as HMG-CoA Reductase Inhibitors. Org. Med. Chem. Lett. 2012, 2, 25. 10.1186/2191-2858-2-25. [DOI] [PMC free article] [PubMed] [Google Scholar]
- Li J.; Abel R.; Zhu K.; Cao Y.; Zhao S.; Friesner R. A. The VSGB 2.0 Model: A next Generation Energy Model for High Resolution Protein Structure Modeling. Proteins 2011, 79, 2794–2812. 10.1002/prot.23106. [DOI] [PMC free article] [PubMed] [Google Scholar]
- Abraham M. J.; Murtola T.; Schulz R.; Páll S.; Smith J. C.; Hess B.; Lindahl E. GROMACS: High Performance Molecular Simulations through Multi-Level Parallelism from Laptops to Supercomputers. SoftwareX 2015, 1-2, 19–25. 10.1016/j.softx.2015.06.001. [DOI] [Google Scholar]
- Huang J.; MacKerell A. D. Jr. CHARMM36 All-Atom Additive Protein Force Field: Validation Based on Comparison to NMR Data. J. Comput. Chem. 2013, 34, 2135–2145. 10.1002/jcc.23354. [DOI] [PMC free article] [PubMed] [Google Scholar]
- Maurya A. K.; Mishra N. In Silico Validation of Coumarin Derivatives as Potential Inhibitors against Main Protease, NSP10/NSP16-Methyltransferase, Phosphatase and Endoribonuclease of SARS CoV-2. J. Biomol. Struct. Dyn. 2020, 1–16. 10.1080/07391102.2020.1808075. [DOI] [PMC free article] [PubMed] [Google Scholar]
- Genheden S.; Ryde U. The MM/PBSA and MM/GBSA Methods to Estimate Ligand-Binding Affinities. Expert Opin. Drug Discovery 2015, 10, 449–461. 10.1517/17460441.2015.1032936. [DOI] [PMC free article] [PubMed] [Google Scholar]
- Kumar V.; Rane K. S.; Wierzchowski S.; Shaik M.; Errington J. R. Evaluation of the Performance of GAFF and CGenFF in the Prediction of Liquid–Vapor Saturation Properties of Naphthalene Derivatives. Ind. Eng. Chem. Res. 2014, 53, 16072–16081. 10.1021/ie503346m. [DOI] [Google Scholar]
- Underwood T. R.; Greenwell H. C. The Water-Alkane Interface at Various NaCl Salt Concentrations: A Molecular Dynamics Study of the Readily Available Force Fields. Sci. Rep. 2018, 8, 352. 10.1038/s41598-017-18633-y. [DOI] [PMC free article] [PubMed] [Google Scholar]
- Pharmacophore Perception , Development, and Use in Drug Design; Güner O. F., Ed.; IUL biotechnology series; International University Line: LaJolla, CA, 2000. [Google Scholar]
- Rathee D.; Lather V.; Dureja H. Pharmacophore Modeling and 3D QSAR Studies for Prediction of Matrix Metalloproteinases Inhibitory Activity of Hydroxamate Derivatives. Biotechnol. Res. Innovation 2017, 1, 112–122. 10.1016/j.biori.2017.10.002. [DOI] [Google Scholar]
Associated Data
This section collects any data citations, data availability statements, or supplementary materials included in this article.