

Abstract

Telmisartan suffers from low oral bioavailability due to its poor water solubility. The research work presents a formulation of solid dispersed (SD) telmisartan formulation as a ternary mixture of a drug, a polymeric carrier (poly(vinylpyrrolidone) (PVP) K30), and an alkalizer (Na2CO3). The preparation method, which was lyophilization of an aqueous solution containing the ingredients, was free from any organic solvent. The developed SD formulations resulted in a significant improvement in in vitro dissolution (>90% drug dissolution in 15 min) compared to pure telmisartan. Solid-state characterization by scanning electron microscopy (SEM), differential scanning calorimetry (DSC), and X-ray diffraction (XRD) studies indicated the conversion of crystalline telmisartan into an amorphous form. Fourier transform infrared (FTIR) spectroscopy revealed the drug–polymer interaction that was responsible for reducing the chances of recrystallization. A short-term stability study showed that selected SD formulations were stable in terms of in vitro dissolution and retained their amorphous structure in ambient and accelerated conditions over 2 months. Selected formulations (drug/PVP K30/Na2CO3 as 1:1:2 or 1:2:2 weight ratio) resulted in >2.48 times relative oral bioavailability compared to marketed formulations. It was considered that the incorporation of an alkalizer and a hydrophilic polymer, and amorphization of telmisartan by lyophilization, could enhance in vitro dissolution and improve oral bioavailability.
Introduction
Low aqueous solubility of active pharmaceutical ingredients (APIs) causes poor dissolution in the gastrointestinal tract, which in turn may hinder its oral bioavailability.1 Hence, the formulation scientists need to overcome the challenge of low aqueous solubility, especially for oral dosage form design. More specifically, drugs that undergo dissolution rate-limited absorption, mainly biopharmaceutical classification system (BCS) class-II drugs with poor solubility but high permeability, are common candidates for solubility or dissolution rate enhancement.2 Different approaches to developing formulations or drug delivery systems for such a class of drugs have been adopted by pharmaceutical researchers and industries. The approaches include but not limited to micronization of APIs,3 nanoemulsions,4 self-emulsifying delivery systems,5 inclusion complexes,6 solid dispersion (SD),7 etc. Solid dispersion or dispersion of API in a fully or partially amorphous form or solid solution in a suitable carrier matrix is one of the effective and easy-to-adopt techniques to improve the apparent solubility of the API.
Solid dispersion can be prepared by many ways such as melt mixing, hot-melt extrusion, and solvent evaporation by a rotary evaporator or spray dryer or freeze dryer. It is not wise to conclude which method is the best because each has its pros and cons. For instance, melt extrusion is an industrially scalable method and free from solvent use but needs a low-melting-point polymeric carrier and requires that the API should be heat-stable at the melting temperature of the carrier.8 In the other hand, spray drying could use low temperatures but its inherited complexity in terms of process optimization and final product attributes are among the major challenges.9 Lyophilization or freeze-drying is another method of preparing solid dispersion.10 Principally, it works on prefreezing and sublimation under low pressures and hence devoid of applying heat. Therefore, it is suitable for formulating heat-sensitive APIs into solid dispersion. Lyophilization allows a fully aqueous solution to be converted into powder, which has made it an environmentally friendly “green” approach. The method of preparation of solid dispersion has a significant impact on product properties such as the degree of amorphization and stability. Hence, the selection of a desirable method is very important for solid dispersion.9 In our research, we have adopted the lyophilization technique to prepare a telmisartan (TEL) solid dispersion system.
Telmisartan (TEL) (chemical name, 4′-((1,4′-dimethyl-2′-propyl(2,6′-bi-1H-benzimidazol)-1′-yl)methyl)-(1,1′-biphenyl)-2-carboxylic acid) is an angiotensin receptor II blocker.11 Therapeutically, it is used as an antihypertensive medication in cardiac patients. It is manufactured or supplied as a free acid form. Telmisartan has poor aqueous solubility and high permeability, and hence, it is classified under BCS II. The oral bioavailability of telmisartan is retarded due to its inherited poor aqueous solubility. Therefore, if the solubility of telmisartan could be improved, the oral bioavailability would also improve.12 Telmisartan is amphoteric in nature and readily ionizable, indicating pH-dependent solubility.13 Within the range of pH 3–9, telmisartan is poorly soluble with reported solubility as low as less than 1 μg/mL. The pKa value of telmisartan was reported as 4.45 ± 0.09.14 Several attempts have been made by different researchers to enhance telmisartan solubility and oral availability such as inclusion complex formation with cyclodextrin,15 solid dispersion with chitosan,16 a nanostructured lipid carrier,17 solid dispersed telmisartan with sn alkalizer.12 In all of the cases, telmisartan in “special” formulations had resulted in higher dissolution and, in some reported cases, higher bioavailability.
Modulation or alteration of the intrinsic pH of a system is an established concept that has been applied to control the solubility of a poorly soluble drug. It has been evidenced that pH modification of the dosage forms can effectively improve the dissolution rate of readily ionizable weakly acidic or basic drugs.18 A pH modifier can change the microenvironmental pH of a system that could manipulate the release rate of an API if it is readily ionizable. The use of an alkalizer as a pH modifier in a solid dispersion system has been studied by different researchers.18,19 Recently, there is a study that used tartaric acid (weak acid) as a pH modifier to improve the dissolution (%) rate of telmisartan solid dispersion prepared by the solvent evaporation method using ethyl alcohol.20
A solid dispersion system usually contains a hydrophilic carrier that not only helps to keep the amorphous dispersion stable but also helps in solubility improvement of the API. In general, the apparent solubility of the API from solid dispersion increased with increasing concentration of the carrier in the system. However, the use of a carrier above certain concentration is not well practicable because of the less desirability of the formulation in terms of excess excipients. More specifically, this is a disadvantage of the solid dispersion approach. Hence, if modulation of microenvironmental pH is enhanced, resulting in improvement of the solubility of the API, then the inclusion of an alkalizer can reduce the amount of the polymeric carrier in the system. The reduced carrier amount combined with the alkalizer can produce a better solid dispersion system with improved dissolution.
In this research, we have developed a solid dispersion (SD) formulation containing telmisartan, a polymeric carrier (poly(vinylpyrrolidone) (PVP) K30), and an alkalizer (sodium carbonate, Na2CO3). The use of an alkalizer has proved effective by another research work using telmisartan by Marasini et al.19 They have dissolved the drug in methanol and employed the spray drying technique. Compared to his work, in our research, we have employed the freeze-drying technique using the only aqueous vehicle. The use of organic solvents has been avoided. The innovator’s telmisartan tablet formulation, Micardis (Boehringer Ingelheim) consists of sodium hydroxide as an alkalizer and meglumine and sorbitol as a solubilizing agent or water-soluble inactive excipients. The tablet also contains povidone and magnesium stearate. In the developed formulation by the present research, we have reduced the number of excipients using one alkalizer and one hydrophilic polymer only. The developed formulation was characterized for the solid-state property by diffusion thermal calorimetry (DSC), Fourier transform infrared (FTIR) spectroscopy, scanning electron microscopy (SEM), and powder X-ray diffractometry (PXRD). Two separate 2 months of stability studies in accelerated and ambient conditions were carried out. Finally, the developed formulation was subjected to an in vivo study in an animal model to assess the oral bioavailability and compare it with the marketed product.
Results and Discussion
Solubility of Telmisartan
Telmisartan, classified as a poorly water-soluble drug, resulted in 0.004 g/L solubility in water. However, it showed higher solubility in an acidic medium (pH 1.2) due to the presence of two imidazole groups. The resulting solubility values of telmisartan in our experiments were 0.524, 0.026, and 0.007 g/L in 0.1 N HCl, phosphate buffer pH 7.5, and phosphate buffer pH 6.8, respectively, which mean that the lowest solubility was in normal distilled water and the highest was in the acidic medium. Due to poor solubility but high permeability, telmisartan is categorized as a drug under BCS class II and exhibits pH-dependent solubility.21 The saturation solubility of telmisartan is quite higher in the acidic medium. Again, in a basic medium with increasing pH, telmisartan solubility increases. At pH 7.5, telmisartan solubility is higher than that at pH 6.8. The solubility of ionizable telmisartan increases with highly acidic or highly basic pH, but at neutral pH, it decreases. A similar fashion of pH-dependent telmisartan solubility was observed by other researchers.21
Miscibility with PVP K30
Miscibility study results showed that with increasing polymer concentration from 1 to 7%, the solubility of telmisartan in the aqueous polymeric medium increases in a good linear fashion (Figure 1). In the previous study also, we have observed the same phenomena with PVP K30 and other polymers.7 The ΔG0t values calculated from the miscibility study were all negative and within the range of −0.697 to −0.105 J/mol. Gibbs energy values changed in ascending order with increasing polymer concentration.
Figure 1.

Miscibility of telmisartan with PVP K30 (polymer) at varying concentrations; polymer conc w/w: concentration of PVP K30 in water.
The increasing amount of the hydrophilic polymer can increase drug solubility. Although the exact mechanism is not clear, it can be assumed that a weak drug–polymer complex is one of the reasons. The drug and polymer may interact by forming different types of interactions such as hydrogen bonds, electrostatic interactions like ion-ion or dipole–dipole interactions, etc.22 PVP K30 was chosen as a polymeric carrier because of its high compatibility with many drugs, high melting point, high tolerance in the human body, and high popularity as a carrier in solid dispersion to prevent crystalline drug precipitation while maintaining supersaturated state in the gastrointestinal medium.23 The linear relationship between the PVP K30 concentration and drug solubility has strengthened the selection of PVP K30 for the research. The Gibbs free energy is calculated to assess the spontaneity of the solubilization process. In this study, all ΔG0t values are negative at all polymeric concentrations, indicating the spontaneous nature of solubilization. Generally, decreasing negative values of ΔG0 (<0) indicates better solubilization and the values are also proportionate to the concentration of polymeric carriers.24 In accordance with the theory, in our research, the highest concentration of PVP K30 (7%) has resulted in the lowest Gibbs energy value and the highest drug solubility, indicating a favourable reaction. The studies could go beyond 7% polymeric concentration, but to restrict the amounts of inactive ingredients or carrier, we have not studied PVP K30 concentrations beyond 7%.
Lyophilization
The major advantages of the lyophilization method include the ability to use no organic solvent and the formation of fine amorphous particles. In our reported method of preparing solid dispersion, we have not used any organic solvent. We have introduced one homogenization step by an overhead homogenizer in preparing colloidal dispersion of the ingredients before prefreezing. In our preliminary study (data not shown), we have observed that lyophilized dry powder, obtained from homogenized dispersion, resulted in higher drug solubility compared to that of nonhomogenized one. High-speed homogenization can reduce the size of solutes in the medium, which could be distributed evenly at fine particle size throughout the medium. Homogenization at a high pressure followed by lyophilization is often applied to prepare a nanoparticulate system such as solidified nanodispersion.25 Valsartan has been prepared a nanosuspension by homogenization followed by lyophilization, which showed enhanced drug release as a result of reduced particle size and increased surface area.1 In our research, we have used high-speed homogenization for better formation of colloidal dispersion before freeze-drying, which has eventually resulted in enhanced dissolution compared to nonhomogenization (data not shown). All of the solid dispersion formulations reported in this article have been prepared following the same methodology. The final powder was loose, white powder that could be easily recoverable from the glass apparatus. The yield of the final product recovered from the glass container was >92% in all cases.
%Drug Content
The results of the analysis of the drug content (%) considering the quantity of powders equivalent to 40 mg of telmisartan for solid dispersion formulations was found to be within the range of (99.15 ± 1.16)–(101.2 ± 1.23), and these values are within the acceptable range (Table 1). Low values of standard deviation (SD) for the drug content indicate uniformity in drug distribution in all of the solid dispersion formulations.
Table 1. Drug Content of Telmisartan in Different Solid Dispersion Formulations.
| formulations | % drug content |
|---|---|
| F1 | 101.2 ± 1.23 |
| F2 | 100.5 ± 0.92 |
| F3 | 101.05 ± 0.79 |
| F4 | 99.2 ± 1.31 |
| F5 | 99.59 ± 1.91 |
| F6 | 101.24 ± 0.66 |
| F7 | 99.88 ± 1.55 |
| F8 | 99.15 ± 1.16 |
| F9 | 100.79 ± 0.48 |
| F10 | 99.95 ± 1.33 |
| F11 | 100.22 ± 0.55 |
| F12 | 99.59 ± 1.19 |
| F13 | 99.53 ± 1.12 |
Selection of Optimum Formulation Based on In Vitro Dissolution Study
The dissolution medium as per the compendia for telmisartan is phosphate buffer pH 7.5. The same medium was used to screen the developed SDtelmi formulations prepared as per Table 4 with varying concentrations of Na2CO3 and PVP K30. Two formulations (F12, F13) were prepared without Na2CO3 to compare the effect of alkalizer on in vitro dissolution. The result of the in vitro dissolution study is presented in Figure 2. It was observed that there were significant differences in the in vitro dissolution profile between F12, F13, and other SDtelmi. While the lowest percent dissolution from SDtelmi was 73% in 60 min (F8), F12 and F13 showed percent drug dissolution of only 26.14 and 30.33% in 60 min. The results showed that without the alkalizer, only PVP K30 in low concentrations (2 and 3 g with respect to 1 g of telmisartan) was not able to enhance the telmisartan dissolution significantly. Being a hydrophilic carrier matrix, PVP K30 has the ability to enhance dissolution of the poorly water-soluble drug, but in the case of telmisartan, a drug with pH-dependent solubility, the presence of an alkalizer matters significantly. In another study, the same phenomena have been reported, where without the alkalizer, PVP K30 alone (drug/PVP K30, 1:3 weight ratio) could not enhance telmisartan dissolution significantly.26 This dissolution enhancement occurred due to the modulation of microenvironmental pH by the alkalizer in the formulation. In the presence of the hydrophilic carrier, when the SDtelmi becomes wet by the dissolution medium, Na2CO3 starts dissolving immediately. The pH of the surrounding microenvironment increases to a high basic level, which makes telmisartan soluble at a higher rate and extent.19 This enhanced dissolution is attributed to the enhanced solubility of telmisartan in the presence of Na2CO3.
Table 4. Compositions of the Solid Dispersion.
| formulations | TEL (g) | PVP K30 (g) | Na2CO3 (g) |
|---|---|---|---|
| F1 | 1 | 1 | 2 |
| F2 | 1 | 2 | 2 |
| F3 | 1 | 3 | 2 |
| F4 | 1 | 3 | 3 |
| F5 | 1 | 3 | 4 |
| F6 | 1 | 5 | 2 |
| F7 | 1 | 5 | 3 |
| F8 | 1 | 5 | 4 |
| F9 | 1 | 7 | 2 |
| F10 | 1 | 7 | 3 |
| F11 | 1 | 7 | 4 |
| F12 | 1 | 1 | |
| F13 | 1 | 2 |
Figure 2.

In vitro dissolution profile of telmisartan solid dispersion with the alkalizer (F1, F2) and without the alkalizer (F12, F13). The value within parentheses against each formulation represents the composition by weight ration of telmisartan/PVP K30/Na2CO3. Each time point is representative of mean data ± SD (n = 3).
In vitro dissolution profiles with respect to time for all formulations studied have been described in Figure 3. Out of all 11 SDtelmi formulations, except F8, all of the 10 SDtelmi formulations resulted in more than 90% dissolution within 15 min. However, the marketed product resulted in 76.57% drug release within 15 min. Pure telmisartan powder resulted in very low (less than 5%) drug dissolution within 60 min. Out of the 11 SDtelmi formulations (F1–F11), the lowest concentration of Na2CO3 was 2 g with respect to 1 g of drug. Statistical analysis using one-way analysis of variance (ANOVA) (Tukey test) showed no significant difference in the dissolution of F1–F11 except for F8 at 15 min with the p-value <0.05 (Figure S1). Despite the insignificant improvement in dissolution from F12 and F13, in the presence of only PVP K30, it can be said that PVP K30 has a major role in drug dissolution. The results from F12 and F13 might be due to insufficient polymer concentration to make an amorphous solid dispersion.
Figure 3.
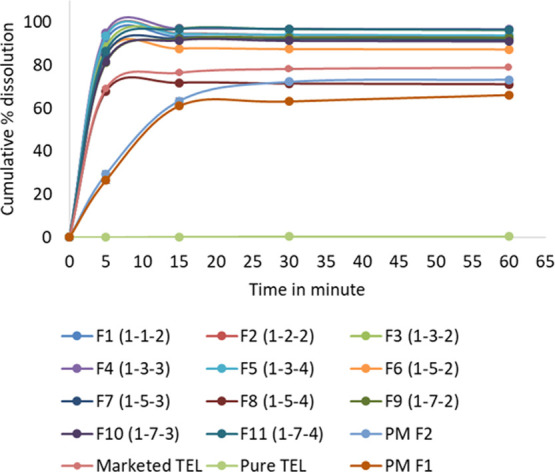
In vitro dissolution profile of all SDtelmi formulations, marketed formulation (marketed TEL), pure telmisartan (pure TEL), physical mixture (PM F1 and PM F2). The value within parentheses against each formulation represents the composition by weight ratio of telmisartan/PVP K30/Na2CO3. Each time point is representative of mean data ± SD (n = 3).
Although the drug–polymer miscibility study showed that increasing polymer concentration shall increase drug solubility in the aqueous medium, but from the dissolution profile derived in this research, no such effect of polymer concentration–solubility relationships in in vitro dissolution could be established. By Figure 4, if we compare the dissolution at 5 min between different formulations of fixed Na2CO3 but varying PVP K30, we can see that increasing PVP K30 causes lesser dissolution. For instance, in Figure 4A, the order of drug dissolution at 5 min is F1 > F2 > F3 > F6 > F9 with the highest at 91.56% (F1) and the lowest at 81.67% (F9). The same trend was observed in the case of F4, F7, and F10 (Figure 4B). PVP K30, due to its hydrophilic nature, reduces interfacial tension to dissolution medium that contributes to drug wettability. Increased drug wettability causes the formation of a microenvironment surrounding the particles and enhances solubilization. PVP K30 solubilizes the drug and maintains a supersaturated state in the gastrointestinal fluid without precipitation.27 But after a certain level of concentration, PVP K30 forms a gel-like layer surrounding the particle. Water penetrates slowly through the layer and drug dissolution occurs via erosion.24 After a certain time, erosion becomes complete and drug dissolution occurs rapidly. That is why at 15 min or later time points drug dissolution becomes almost equal in all SDs (Figure 4C). Only F8 showed a cumulative dissolution of 71.24% within 60 min, which is the lowest among all SDtelmi formulations with the highest concentration of the alkalizer.
Figure 4.

In vitro dissolution profile of all solid dispersed telmisartan coded as (A) F1, F2, F3, F6, F9; (B) F4, F7, F10; and (C) F5, F8, F11. The value within parentheses against each formulation represents the composition by weight ration of telmisartan/PVP K30/Na2CO3. Each time point is representative of mean data ± SD (n = 3).
To assess the effect of freeze-drying on the dissolution of solid dispersion, we have compared in vitro dissolution of the physical mixture of telmisartan, Na2CO3, and PVP K30 in two compositions like F1 and F2, termed as PMF1 and PMF2, respectively. The cumulative percent dissolution of telmisartan from PMF1 and PMF2 was 69.18 and 73.34%, respectively, in 60 min (Figure 3). The result was comparable with the marketed tablet but lower than all SDtelmi. These results indicated that other than the presence of PVP K30 and Na2CO3, the nature of the lyophilized powder also influences the drug dissolution. Here comes the benefit of solid dispersion. In solid dispersion, the drug either remains completely miscible with the carrier to form a homogeneous amorphous dispersion or it forms an amorphous suspension in the carrier.28 Such molecular-level dispersion or amorphization increases drug solubility that eventually enhances drug dissolution.
Hence, the enhancement of dissolution from lyophilized SDtelmi is attributed to three different factors: modulation of microenvironmental pH by Na2CO3, beneficial effects from PVP K30, and conversion of the crystalline drug to amorphous or molecular dispersion. Therefore, further solid-state characterization was carried out with selected SDtelmi to evaluate the physical state of lyophilized powder. From in vitro dissolution study, three SDtelmi were chosen which are F1, F2, and F3 due to the three lowest concentrations of inactive ingredients with the highest benefits as the most suitable formulations.
Functional Group Analysis
Functional group analysis has been done by attenuated total reflection (ATR)-FTIR study to assess the interaction between telmisartan–PVP K30 and Na2CO3. If any structural change in telmisartan occurs within SDtelmi, then it may lead to change in functional groups. That is why change or loss in crystallinity can be assumed from infrared spectra. In pure telmisartan spectra (Figure 5), the characteristic peak was obtained at 1694.11 cm–1, which is attributed to the C=O stretching of the carboxyl group. Other significant peaks observed in pure telmisartan spectra include 3059.60 cm–1 (aromatic C–H stretching), 2956.04 cm–1 (aliphatic C–H stretching), and 1603 cm–1 (aromatic C=C bending and stretching). All of the characteristic peaks are in close agreement with previously reported functional group analysis for telmisartan.15 PVP K30 is characterized by strong absorption bands at 1658.72, 2948.29, and 1283.84 cm–1 as a result of C=O stretching of the carbonyl group, C–H, and N–C stretching, respectively (Figure 5A).29 The adsorbed moisture in PVP K30 had caused an absorption band of 3250–3500 cm–1 with a peak at 3411.12 cm–1. All of the peaks including the absorbed moisture peak were also evidenced in our previous study.7 The spectra of Na2CO3 showed the characteristic band at 1423.15, 1065.99, and 878.08 cm–1, indicating similarity with the reported Na2CO3 spectrum.30 In both of the physical mixture (1:1 weight ratio) of telmisartan individually with PVP K30 and Na2CO3, major characteristic peaks of the drug are visible, indicating no significant interaction of telmisartan with other components in the dry mix state. In PMtelmi, which is an equimolar physical mixture of three components (Figure 5A), peaks of telmisartan at 3059.60, 2956.04, and 1603 cm–1 remain unchanged. However, the peak at 1694.11 cm–1 was present with reduced intensity. There might be two reasons: either peaks responsible for the amide group of PVP K30 suppresses the telmisartan peak in the surrounding region of 1600 cm–1 infrared wave number or H bonding has been taken place involving the −COOH group. However, in the telmisartan–PVP K30 mixture spectra, the peak at 1694.11 cm–1 was visible, which is adjoined with C=O stretching spectra of PVP K30 at 1658 cm–1. So, it nullifies the first reason. Therefore, it can be assumed that some degree of interaction occurred during the physical mixing of telmisartan with the other two components. In the spectra of SDtelmi of F1, F2, and F3, telmisartan peaks at 1694.11, 3059.60, and 1603 cm–1 are completely absent, which are indicative of interaction involving −COOH group (Figure 5B). A decrease in the peak intensity due to the lowering of vibration or the absence of carbonyl stretching from the −COOH group along with an absence of the O–H band at 3100 cm–1 indicates the formation of strong H bonding between two components.14 PVP K30 can form H bonding either through nitrogen or carbonyl group of pyrrole ring present in its structure.31 Absence of the C=O peak at 1694.11 cm–1 indicates the formation of H bonding between −COOH of telmisartan and the carbonyl functional group of PVP K30 in SDtelmi. The dominant peak visible at around 1600 cm–1 was the peak of C=O stretching of PVP K30 at 1658.72 cm–1. There was no difference of characteristic peaks of telmisartan in terms of the position or intensity between F1, F2, and F3, which means that the different ratio of PVP K30 did not cause any difference in interaction with telmisartan, visible by infrared spectra.
Figure 5.

FTIR spectra of (A) pure telmisartan, PVP K30, Na2CO3, and individual binary mixture of telmisartan with PVP K30 and Na2CO3 and (B) pure telmisartan and solid dispersion formulations of telmisartan (F1, F2, and F3). The value within parentheses against each formulation represents the composition by weight ration of telmisartan/PVP K30/Na2CO3. The encircled zone of spectra indicated the characteristic telmisartan peak at 1694.11 cm–1.
Drugs in an amorphous state in a solid dispersion have a tendency to precipitate rapidly into the dissolution medium because of the supersaturated solution state. A polymeric carrier like PVP K30 inhibits such precipitation by prolonging supersaturation.32 The exact mechanism of how the polymer acts as a precipitation inhibitor is still not fully clear, but it is established that polymers like PVP K30 cause some interaction with the drug. Drug precipitation or recrystallization occurs by nucleation followed by crystal growth. A suitable polymeric carrier in solid dispersion interrupts either nucleation or crystal growth by interaction with the drug.33 Hydrogen bonding is the most possible way of drug–polymer interaction that not only increases the activation energy for nucleation but also inhibits crystal growth. Hence, in this research, possible H bonding between PVP K30 and telmisartan, evidenced by FTIR study, can be responsible for enhanced dissolution as well as inhibition of recrystallization of solid dispersed telmisartan. Further structural change of telmisartan in SDtelmi was evaluated by SEM followed by thermal analysis and finally PXRD study.
Surface Morphology Study
The morphologies of all three components, PMtelmi, and three different SDtelmi (F1, F2, and F3) were evaluated by SEM analysis, and the micrographs were obtained as the results (Figure 6). Pure telmisartan is observed as a long needle-shaped homogeneous crystal with a smooth texture in the SEM image, which is similar to previous studies.26 Na2CO3 and PVP K30 were observed as irregular fragments and round-shaped particles, respectively, in the individual micrograph. In the ternary physical mixture of telmisartan, Na2CO3, and PVP K30, needle-shaped telmisartan crystals and irregular fragments of Na2CO3 are distributed on the surface of round-shaped PVP K30. It can be said that telmisartan still retains its crystalline structure in the ternary mixture. The micrograph of SDtelmi (F1, F2, and F3) showed the absence of any definite structural shape of the telmisartan crystal. There was no difference observed apparently between SEM images of three formulations. The absence of the telmisartan crystal image indicates the structural change of the drug crystal that might be attributed to the conversion of the crystalline drug to the amorphous state by lyophilization. However, the SEM micrograph is not very conclusive in this case. Therefore, the change in crystallinity is further assessed by thermal analysis and PXRD study.
Figure 6.

SEM micrographs of pure telmisartan, PMtelmi (physical mixture 1:1:1 weight ratio of telmisartan, Na2CO3, and PVP K30), and solid dispersion formulations (F1, F2, F3). The value within parentheses against each formulation represents the composition by weight ratio of telmisartan/PVP K30/Na2CO3.
Thermal Analysis
Thermal analysis gives an idea of the physical nature of solid dispersed powder and melting and crystallization behavior. In this research, the DSC study was done to analyze the samples with the application of controlled heat. The results are recorded as DSC thermograms (Figure 7). Pure TEL presented a sharp endothermic peak at about 271.74 °C, which corresponded to its intrinsic melting point, indicating that all TEL crystals melted at that temperature and there was no moisture adsorbed due to its highly hydrophobic nature.34 PVP K30 had shown a broad endothermic band from 90 to 150 °C with a curve at 142 °C, which corresponds to the melting range of PVP K30. During thermal scanning of PVP K30, evaporation of residual moisture was observed by a broad band due to the extremely hygroscopic nature of the PVP polymer.7 Physical mixture (PM) had shown one small endothermic band at around 140 °C and a small endothermic peak at 269.99 °C, corresponding to PVP K30 and telmisartan, respectively. The endothermic peak in the physical mixture for TEL shifted a little bit from 271.74 to 269.99 °C. This little peak shifting occurs due to melting point depression, which may occur for an individual component if mixed with another component. The endothermic peak of TEL in the physical mixture was sharp but with reduced intensity. Such reduction of intensity might happen from partial amorphization of telmisartan in the physical mixture during sample preparation, which was also evidenced by PXRD but contradicted with the SEM image. Another reason might be partial solubilization of telmisartan in melted PVP K30 during DSC analysis.24 There was no new peak generated in the physical mixture, indicating no physical incompatibility between the components of a ternary mixture containing the drug, PVP K30, and Na2CO3. There was no intrinsic characteristic peak for Na2CO3 over the entire range of temperature tested from 25 to 300 °C in the physical mixture due to its high melting point of 851 °C, as reported in other studies.19 In the thermogram of SDtelmi (F1, F2, and F3), no sharp endothermic peak of telmisartan was visible. It is inferred that there was no presence of telmisartan crystals in the sample. We have assumed the formation of an amorphous particle in the lyophilized solid dispersion. However, the DSC study alone is not capable of determining the physical state of the developed product alone. Therefore, the lyophilized dispersions were further evaluated by PXRD analysis.
Figure 7.

DSC thermograms of pure telmisartan, PVP K30, ternary physical mixture of telmisartan/PVP K30/Na2CO3 (PM), and solid dispersion of telmisartan (F1, F2, F3).
Crystallinity Analysis
PXRD tests were done to evaluate the structural change of telmisartan in the physical mixture and lyophilized formulations (F1, F2, and F3). Telmisartan, as observed in the SEM image, remains as a distinct homogeneous shaped crystal. In XRD diffractograms (Figure 8), distinctive peaks with noticeable intensities were visible for telmisartan at 2θ angles of 6.8, 14.2, 19.1, and 22.3° with intensities (cps) of 1095(33), 702(26), 166(13), and 252(16), respectively. Such peaks have been observed for telmisartan by other researchers also,26 which indicated its sharp crystal nature. PVP K30, being an amorphous polymer did not show any distinct peak (Figure 8). In the diffractogram of Na2CO3 (Figure 8), many peaks are visible but all above the 2θ angle of 23.76°, which means that these peaks would not interfere with telmisartan peaks. In an equimolar ternary physical mixture containing telmisartan, PVP K30, and Na2CO3, characteristic peaks of telmisartan were observed but with lower intensities. For instance, the peak at a 2θ angle of 6.8° had come up with an intensity (cps) of 92 (10), which is considerably lower than that of pure telmisartan. Again, the peak at 19.1° was absent in the physical mixture diffractogram. The absence of a distinct characteristic peak or reduction in the peak intensity in the diffractogram indicates complete or partial loss of crystallinity.18 During the preparation of the physical mixture sample for PXRD, a mild degree of cogrinding was performed using a mortar and pestle. Possibly during cogrinding, some loss of crystallinity occurred to telmisartan in the physical mixture. Cogrinding of the drug and inactive ingredients such as the polymer can cause partial amorphization of the crystalline drug. Zhong et al. has reported reduced peak intensity at a 2θ angle of 6.8° for telmisartan indicating conversion of the crystalline structure to amorphous by cogrinding with chitosan.16 However, such reduction in crystallinity in the physical mixture in our sample is not well correlated with SEM images, where the physical mixture showed a clear presence of telmisartan crystals. It can be said that SEM images are not capable of detecting partial loss of crystallinity, which is observed in the diffractogram.
Figure 8.

Powder X-ray diffractograms of (A) telmisartan, (B) PVP K30, (C) Na2CO3, (D) ternary physical mixture of equal weight ratio of telmisartan/PVP K30/Na2CO3, and (E–G) solid dispersion formulations of telmisartan (F1, F2, and F3).
All SDtelmi formulations (F1, F2, and F3) showed the same pattern in PXRD analysis. Characteristic telmisartan peaks at the above-mentioned 2θ angles were absent in all three lyophilized formulations. Peaks of Na2CO3 were present in the PXRD diffractogram. The absence of distinct characteristic peaks indicates the presence of a large amount of drug in the solution in solid state, and a reduction of a large number of characteristic peaks indicates amorphization of drug crystals.14 Therefore, it can be said that by lyophilization, telmisartan has been converted to an amorphous form in the presence of PVP K30 and Na2CO3 as a solid dispersion. This result is in close agreement with SEM images and FTIR analysis. In the SEM image, SDtelmi did not show any trace of telmisartan crystalline structure. In the FTIR spectrum, alteration in the functional group indicated possible structural change. Moreover, in in vitro dissolution studies, higher dissolution rates have been achieved from SDtelmi, behind which amorphization of telmisartan by lyophilization is one of the significant contributing factors. The poor water-soluble crystalline drug, when present in the amorphous form, usually has better aqueous solubility, which results in higher dissolution. This is because no energy is required to break the lattice structure, unlike the crystal form. It is speculated that in solid dispersion after dissolution if drugs precipitate, they remain in a metastable state, which has higher solubility.28 It is possible to convert the poorly soluble crystalline drug to amorphous solid dispersion using a suitable polymer and method of preparation. In this research, amorphization of telmisartan was observed for F1, F2, and F3, despite the different amounts of the carrier, i.e., PVP K30 by the lyophilization method. Lyophilization is a well-established technique for amorphization of crystalline drugs, and therefore, it has been adopted to prepare solid dispersions.35 In this research, we have managed to cater to the advantages of lyophilization through the enhanced dissolution of telmisartan amorphous solid dispersion.
Stability Evaluation
A short-term stability study for 2 months was carried out under ambient and accelerated conditions with three SDtelmi formulations (F1, F2, and F3). In vitro dissolution profiles of three SDtelmi formulations (F1, F2, and F3) at 0 days and 1 and 2 months of time point are presented in Figure 9. Functional group analysis by FTIR and crystallinity study by PXRD has been done at 2 months of time point.
Figure 9.

In vitro dissolution study of THE short-term stability sample for solid dispersionS of telmisartan (F1, F2, and F3) in ambient and accelerated conditions. Each time point is representative of mean data ± SD (n = 3).
An amorphous system is thermodynamically unstable and tends to convert into a more stable crystalline form, which is termed as recrystallization.28 The amorphous nature of the drug is one of the main contributing factors behind the improved dissolution of telmisartan from SDtelmi. Such improvement can be compromised by recrystallization of the drug in the solid dispersed system, which are induced by humidity and temperature.36 Such lyophilized solid dispersed powder particles had a wide surface area that is susceptible to adsorb moisture. Therefore, considering its importance, an assessment of the stability of SDtelmi was carried out in both ambient temperature/humidity as well as under elevated temperature/humidity (accelerated conditions). It is observed from the dissolution profile (Figure 9) that the plots of time vs cumulative percent drug dissolved at three different time points, in both types of studies, are almost super-imposable on one another for every single formulation. These results indicate that no change in the in vitro dissolution of telmisartan happened during two months of storage. It was assumed that there was no or negligible occurrence of recrystallization in the solid dispersed system. To confirm this assumption, PXRD study was done at 2 months of time point. It was observed from the PXRD diffractogram (Figure 10) that none of the characteristic peaks, mentioned in Section 3.8, had come out in any of the SDtelmi at 2 months of time point, indicating no recrystallization of the drug. Such a result is following the almost constant dissolution profile until the last sampling point.
Figure 10.

Powder X-ray diffractograms of the stability study sample of three solid dispersions of telmisartan (F1, F2, and F3) at 2 months time point kept under accelerated conditions. The value within parentheses against each formulation represents the composition by weight ratio of telmisartan/PVP K30/Na2CO3.
The stability of solid dispersed amorphous powder depends on the type and concentration of the polymeric carrier.36 Two related factors are responsible for the stability of amorphous powder: molecular mobility and glass transition temperature (Tg). Molecular mobility is essential for molecular diffusion and surface integration. Diffusion causes amorphous phase separation inside the system. A drug rich with the amorphous phase is formed, which can relax toward molecular conformation and induces nucleation. Thereby, crystal growth starts and recrystallization occurs.37 Polymers, such as PVP, plays an important role in decreasing molecular mobility by increasing the Tg of the solid dispersed system. At low Tg values, an amorphous system can have sufficient molecular mobility to induce nucleation and crystal growth. Incorporating polymer with high Tg insufficient amount can thereby make amorphous dispersion stable.36 In our study, PVP K30, used as the polymeric carrier, has played the role of a stabilizer for amorphous solid dispersions of telmisartan. Another factor of reducing crystal growth is strong drug–polymer interactions to form H bonding. To assess the H bonding between telmisartan and PVP K30, FTIR analysis was done at the last time point. From the infrared spectra (Figure S2), it was observed that the formation of H bonding was consistently evidenced by the absence of the characteristic telmisartan peak at 1695 cm–1 throughout the course of stability study for all three formulations at both conditions. Such strong H bonding between the drug and polymer is another responsible factor behind the stability of lyophilized solid dispersed telmisartan developed in this research. Adsorbed moisture on the solid dispersed system may act as a plasticizer for the polymer and can also break H bonding, weakening drug–polymer interaction.38 This may promote recrystallization. In our research, despite the presence of two moisture-sensitive components, hydrophilic polymer and Na2CO3, moisture adsorption was not so much to cause crystallization, as evidenced in FTIR and PXRD studies. Suitable packaging is thus required to make amorphous dispersion stable for a long time.
Pharmacokinetic Study
The in vitro dissolution studies were followed by solid-state characterization and short-term (2 months) stability study of the developed SDtelmi. The results of all of these in vitro characterizations indicate the formation of lyophilized amorphous solid dispersion of telmisartan with enhanced in vitro dissolution. These results influenced us to proceed with in vivo pharmacokinetic studies to evaluate whether the in vitro beneficial effects of SDtelmi persist in in vivo conditions. From the three selected SDtelmi formulations (F1, F2, and F3), we have chosen F1 and F2 for pharmacokinetic study in the rat animal model because of lesser inactive ingredients compared to F3 with the same solid-state characters and benefits. A validated high-performance liquid chromatography (HPLC)–UV method within a linear range of 0.07–10 μg/mL and with 92.34–99.87% accuracy was employed to quantify telmisartan in rat plasma. The plasma concentration vs time profile for F1, F2, raw telmisartan powder, and marketed formulation is presented in Figure 11. Mean pharmacokinetic parameters, derived by noncompartmental analysis, with standard deviation, are presented in Table 2.
Figure 11.

Plasma concentration vs time profile for raw telmisartan (raw TEL), marketed formulation (marketed TEL), and solid dispersion of telmisartan (F1, F2). Each data is represented as mean data ± SD (n = 3). The value within parentheses against each formulation represents the composition by weight ratio of telmisartan/PVP K30/Na2CO3. The sample was collected at 12 h after 8 h. However, no telmisartan was detected at 12 h.
Table 2. Pharmacokinetic Parameters of Telmisartan Derived after Oral Administration of Different Formulations of Telmisartana.
| parameters | raw telmisartan | marketed formulation | F1 (1-1-2) | F2 (1-2-2) |
|---|---|---|---|---|
| Cmax (μg/mL) | 0.164 ± 0.016 | 0.409 ± 0.175 | 0.611 ± 0.303 | 1.363 ± 0.229 |
| tmax (h) | 1 ± 0.000 | 1.167 ± 0.764 | 1.667 ± 0.577 | 0.5 ± 0.00 |
| AUC0–t (μg h/mL) | 0.306 ± 0.080 | 1.206 ± 0.256 | 3.071 ± 1.189 | 4.161 ± 0.727 |
| AUC0–∞ (μg h/mL) | 0.333 ± 0.078 | 1.981 ± 0.493 | 4.876 ± 0.556 | 5.564 ± 0.630 |
| Kel (h–1) | 0.448 ± 0.074 | 0.252 ± 0.194 | 0.198 ± 0.110 | 0.241 ± 0.031 |
| T1/2 (h) | 1.575 ± 0.256 | 4.124 ± 2.917 | 4.802 ± 3.619 | 2.910 ± 0.390 |
Each data is represented as mean data ± SD (n = 3). F1 and F2: solid dispersion formulations of telmisartan. The value within parentheses against each formulation represents the composition by weight ratio of telmisartan/PVP K30/Na2CO3.
In terms of Cmax, the order of different formulations is F2 > F1 > marketed telmisartan > raw telmisartan. Cmax determines the extent of drug absorption to the system. It was quite expected that raw telmisartan would generate the lowest Cmax because of its poor solubility. Although Cmax of F1 is higher than marketed telmisartan formulation, both values were the same statistically. The Cmax value of F2 is more than 2 times compared to that of F1, indicating a statistically significant difference. This result is not in good correlation with in vitro dissolution results, where both of the formulations have shown >90% drug dissolution within 5 min. We assumed that the lower concentration of PVP K30 in F1 might be the reason. An amorphous dispersion, after administration, “springs out” the drug in the gastric medium causing a supersaturated zone around.32 In the gastrointestinal tract, PVP K30 prevents the drug to precipitate out as crystals from the supersaturated solution, which is termed as the “parachute” effect. The low amount of PVP K30 in F1, compared to that in F2, was not sufficient enough to inhibit the precipitation of telmisartan in the gastrointestinal tract, although in the in vitro medium, it did not cause any difference. The concentration of Na2CO3 was the same in F1 and F2. Therefore, it may be affirmed that the amount of PVP K30 in the F2 formulation made a difference in the plasma concentration of telmisartan compared to that in F1. However, such variation from in vitro to in vivo studies is a common occurrence. An in-depth study and replication of the study with a large number of animals could effectively evaluate the case. The values of tmax in ascending order is F2 < raw telmisartan < marketed formulation < F1 (Table 2). Statistically, there was no difference in tmax between raw telmisartan, marketed formulation, and F1. The tmax of F2 was the lowest (0.5 h) among all four formulations, but it was statistically the same with the marketed formulation. tmax determines the time taken to reach the Cmax, and it stands for the rate of absorption. For BCS II class of drugs, if absorption is dissolution-rate-limited, then it enters the circulation immediately once a drug becomes soluble. Telmisartan, a BCS class II drug candidate, has excellent permeability.39 That is why, even from raw telmisartan, tmax was quite faster regardless of the maximum concentration reached. However, the fastest absorption with the lowest tmax was derived from lyophilized SDtelmi (F2).
AUC0–t and AUC0–∞ were calculated to assess the total drug exposure to the system from various formulations and their relative bioavailability. As shown in Table 2, AUC0-t values of F1 and F2 were 2.54 times and 3.45 times higher than the marketed formulation, respectively. The AUC0–∞ value was the highest for F2, followed by those for F1, marketed formulation, and raw telmisartan.
Relative bioavailability, calculated using AUC0–∞ values, is represented in Table 3. It showed that F2 and F1 resulted in 2.8 and 2.5 times higher relative bioavailability for the marketed formulation. Compared to raw telmisartan, their bioavailability was much higher (Table 3).
Table 3. Relative Bioavailability of Solid Dispersion Formulation of Telmisartan (F1 and F2) for Raw Telmisartan and Marketed Formulation.
| formulations | % relative bioavailability (w.r.t. raw telmisartan) | % relative bioavailability (w.r.t. marketed telmisartan) |
|---|---|---|
| raw telmisartan | 100 | 16.81 |
| marketed formulation | 594.87 | 100 |
| SD F1 (1-1-2) | 1464.31 | 246.15 |
| SD F2 (1-2-2) | 1670.86 | 280.88 |
The improved relative bioavailability is a result of enhanced solubility and dissolution of telmisartan from lyophilized solid dispersion in the presence of the polymer and alkalizer. Improvement of aqueous solubility and dissolution, in turn, results in higher bioavailability because of the rapid and higher extent of absorption.40 Not only higher bioavailability but also point to point comparison from the plasma concentration vs time profile (Figure 11) also showed higher telmisartan absorption from F1 and F2 compared to the raw drug or marketed formulation.
Conclusions
A solid dispersed formulation of telmisartan was prepared using PVP K30 as a polymeric carrier and Na2CO3 as an alkalizer by a lyophilization method. The preparation method came up with its advantage of not using any organic solvent or no application of heat. Telmisartan was converted to an amorphous form from its original crystalline structure, which helps in the improvement of solubility in the in vitro medium as well as in vivo. The pharmacokinetic study revealed that the lyophilized telmisartan formulation composed of a ternary system of the drug/polymer/alkalizer (1:2:2 weight ratio) had the highest relative bioavailability in rat with respect to the marketed formulation. It can be concluded that improved dissolution and enhanced bioavailability from SDtelmi occurred due to the presence of the alkalizer, the presence of a hydrophilic polymeric carrier, and the amorphous form of telmisartan. The role of each factor could be critically evaluated by an extensive in vivo study with a larger number of animals and different compositions of the formulation. Nevertheless, our results suggest that a lyophilized telmisartan solid dispersion with an alkalizer could effectively improve the drug’s oral bioavailability. This study can be further extended to human volunteers after necessary toxicity evaluation and other ethical considerations.
Materials and Methods
Materials
Telmisartan (TEL) (assay on the anhydrous basis, 99.8%) was purchased from Hangzhou Hyper Chemicals Limited, China, in the form of a white crystalline powder. PVP K30 was generously donated by IKOP Sdn Bhd, Malaysia. Na2CO3, potassium dihydrogen phosphate (KH2PO4), potassium hydroxide (KOH), and hydrochloric acid (37%) were procured from Merck KGaA, Germany. Acetonitrile for chromatography (HPLC grade), ethanol for plasma extraction (absolute for analysis), and methanol for dissolving telmisartan to prepare the standard solution (absolute for analysis) were also purchased from Merck KGaA, Germany. Purified water for HPLC was obtained from a Millipore system (18.2 MΩ/cm resistivity, Milli-Q) (Millipore Corporation). Marketed telmisartan formulation, Teleact 40 mg tablet (Sun Pharma, Malaysia), was purchased from a local pharmacy.
Solubility Study
The solubility of raw telmisartan was determined in distilled water, 0.1 N HCl (pH 1.2), phosphate buffer solution pH 6.8, and phosphate buffer solution pH 7.5. An excess amount of telmisartan was added to 5 mL of each of the medium in a capped glass bottle and shaken by an incubator shaker (Innova 4000) for 36 h at 100 rpm and 37 ± 2 °C. The aliquots were then centrifuged at 3000 rpm for 10 min. The supernatant layer was collected and filtered through 0.45 μm poly(tetrafluoroethylene) (PTFE) syringe filter (Thermo scientific, Germany) followed by measurement of absorbance by a UV spectrophotometer (Shimadzu 1800, Tokyo, Japan) at a wavelength of 231 nm after the required dilution. The concentration of the samples was determined using a suitably constructed linearity plot. Each study was done in triplicate.
Miscibility Study
Miscibility study of telmisartan with PVP K30 was done following the method reported by Kyaw et al. (2017). In short, an excess amount of telmisartan was added in 10 mL of different concentrations of PVP K30 solutions ranging from 1 to 7% (w/w) in a capped glass bottle. Then, the bottles were shaken by an incubator shaker following the same conditions as the solubility study. Aliquots were taken and the same process of sample preparation and measurements were followed as per the solubility study. The Gibbs free energy equation was applied to indicate the process transfer of telmisartan to the polymeric solution.22 Values of Gibbs free energy were calculated as per the following equation
| 1 |
where R, T, and S0/Ss are the universal gas constant, the temperature in kelvin, and the ratio of molar solubility of telmisartan in an aqueous polymeric solution to that of pure water without the polymer, respectively.
Preparation of Solid Dispersion
Solid dispersion of telmisartan, henceforth termed as SDtelmi (F1–F11), was prepared by a lab-scale lyophilization or freeze-drying method incorporating PVP K30 and Na2CO3 in an aqueous medium. First, the aqueous solution of Na2CO3 was prepared according to the desired concentration. Then, the required amount of PVP K30 was dissolved in the Na2CO3 solution by constant stirring. After that, 1 g of telmisartan was added to the solution with constant stirring for 25 min, which is followed by homogenization for 5 min (4000 rpm) using an overhead homogenizer (WT130 Success Technic Industries, Malaysia). The colloidal dispersion was then kept for prefreezing at −80 °C for 24 h. After that, it was lyophilized or freeze-dried in a lab-scale freeze dryer (Alpha 1-2 LD plus Christ, Germany). The white powder, derived from a freeze dryer, was then hand-pulverized by a mortar and pestle, passed through a 350–500 μm sieve, and stored in a sealed air-tight plastic pouch in a vacuum desiccator until further evaluations. The composition of the formulation prepared is described in Table 4.
Determination of Drug Content
Appropriate weight of telmisartan solid dispersion equivalent to 40 mg of telmisartan was dissolved in 50 mL of methanol and diluted appropriately to obtain a final concentration of 40 μg/mL. The samples were analyzed by the HPLC method. The drug content of the solid dispersions was determined in triplicate.
In Vitro Dissolution Study
In vitro dissolution studies were carried out by a USP type II (paddle type) dissolution tester (Copley DIS 8000, U.K.). Phosphate buffer of pH 7.5 in a volume of 900 mL/basket was chosen as a dissolution study medium following the USP procedure.41 Other relevant parameters were as follows: speed of the stirrer, 75 rpm; temperature of the medium, 37 ± 0.5 °C; aliquot volume, 5 mL. At a predetermined time intervals of 5, 15, 30, and 60 min, sample aliquots (5 mL) from the dissolution basket were withdrawn and an equivalent amount (5 mL) of the fresh dissolution medium was immediately added to maintain a constant dissolution volume. The aliquots were filtered through a 0.45 μm syringe filter and analyzed by a predeveloped high-performance liquid chromatography (HPLC) method. Raw telmisartan powder (40 mg), marketed formulation 40 mg, ternary physical mixture of telmisartan–PVP K30–Na2CO3 (equivalent to 40 mg, composition as per F1 and F2), termed as PM1 and PM2, and all SDtelmi (equivalent to 40 mg) were used for in vitro dissolution studies.
In the HPLC method, used for dissolution sample analysis, the separation was achieved on a ZORBAX Eclipse Plus C18 column (250 mm length and 4.6 mm internal diameter with 5 μm pore size). The isocratic elution method consists of 70:30 (v/v%) mixture of acetonitrile and 10 mM phosphate buffer solution (pH 3.8) as mobile phase, 1 mL/min flow rate, 10 μL injection volume, and UV detection system at 231 nm. Telmisartan was detected at approximately 4.8 min within a total chromatographic run time of 7 min.
Functional Group Analysis
Attenuated total reflectance Fourier transform infrared spectroscopy (ATR-FTIR) study was done to analyze functional groups present in telmisartan and SDtelmi to evaluate interactions between the drug and carriers. In this study, each of the components including telmisartan, physical mixture of all three components of the formulation in 1:1:1 weight ratio (henceforth termed as PMtelmi), and SDtelmi formulations were subjected to scanning over an IR range of 4000–400 cm–1 with accumulations of 15 scans at a resolution of 2 cm–1 by an IR spectrometer (PerkinElmer, Waltham, MA). IR spectra were compared visually and analyzed to derive the outcome.
Surface Morphology Study
Scanning electron microscopy (SEM) was carried out to assess the surface and shapes morphology of SDtelmi particles. Pure telmisartan, pure PVP K30, pure Na2CO3, PMtelmi, and SDtelmi were analyzed by SEM, and the generated micrographs were compared visually. In short, the method was as follows: using a pair of thumb forceps, double-sided carbon adhesive tape was placed on the flat surface of the SEM sample stub followed by a sprinkling of a very small amount of sample powder on it. Then, the sample particles were gold-coated and scanned for images using a scanning electron microscope (ZEISS EVO 50, Germany).
Thermal Analysis
Thermal analysis was done by differential scanning calorimetry (DSC) study. For this study, the sample (5–8 mg) was enclosed in an aluminum crucible and exposed to a thermal range of 10–300 °C (for PVP K30, up to 200 °C) (10 °C/min increment) in a differential scanning calorimeter (1-STARe, Mettler Toledo, Columbus, OH) under a constant nitrogen flow (10–20 mL/min). Pure telmisartan, PVP K30, PMtelmi, and SDtelmi were used as samples. Na2CO3 alone was not studied by DSC due to its high melting point (around 850 °C),42 which is beyond the capacity of the instrument used.
Crystallinity Analysis
Assessment of crystallinity was done by powder X-ray diffraction (PXRD) analysis. The method followed was the method narrated by Tran et al. with minor modifications.14 Each of the individual components of the formulations including telmisartan, PMtelmi, and SDtelmi was scanned using an X-ray diffractometer (Rigaku Ultima IV, TX) in increments of 0.02° from 3 to 80° at a rate of 1 s/step, where Cu Kα radiation used was 30 kV and 15 mA. Diffraction angles (2θ) were recorded along with intensity (counts), and an individual diffractogram for each sample was derived.
Short-Term Stability Study
Two short-term stability studies (2 months of duration) were done with the final SDtelmi formulations in ambient (30 °C/75% relative humidity) and accelerated (40 °C/75% relative humidity) conditions using a stability chamber (M 1400, Capromax Sdn. Bhd., Malaysia) to evaluate significant changes during storage of the SDs if any. Samples were analyzed at 1 and 2 months by in vitro dissolution and compared to that of the 0 day result. PXRD and FTIR studies were also done at 2 months of time point.
Pharmacokinetic Study
A pharmacokinetic study was done in an animal model (rat) to evaluate the in vivo performances of developed SDtelmi formulations as well to determine their relative bioavailability compared to the raw drug and marketed formulation. The animal study protocol was prior approved by the Institutional Animal Care and Use Committee (IACUC-IIUM), International Islamic University Malaysia (reference no.: IIUM/504/14/2/IACUC-Approval/2017(17)). This animal study had been carried out following the National Institutes of Health guide for the care and use of laboratory animals (NIH Publications no. 8023, revised 1978).
Animal Husbandry and Maintenance
Male Sprague–Dawley rats weighing 280 ± 20 g and aged 9–10 weeks were purchased from Sapphire Enterprise, Selangor, Malaysia. The rats were housed as three rats per cage and acclimatized with the laboratory environment for one week on a standard 12 h light/dark cycle at a room temperature of 25 ± 3 °C and relative humidity of 50 ± 10%. The rats were provided with sufficient food and water during the acclimatization period. However, they were kept in the fasting condition with free access to water overnight (12 h) before the start of the experiment.
Study Design and Sample Collection
A total of 12 rats were divided into four groups (n = 3). Each of the groups received either pure telmisartan powder, marketed formulation or F1 and F2 (two different SDtelmi preparations selected after in vitro studies) by oral administration at a dose of 4 mg/kg body weight. For SDtelmi formulations, the equivalent amount to the required dose was calculated and used for oral administration. The animal dose was calculated following the method described by Sengupta et al.43 considering 40 mg as a human adult dose. The total study duration was 12 h.
At predetermined time intervals of 0.5, 1, 2, 4, 6, 8, and 12 h after dosing, 0.3–0.4 mL of blood sample was collected into ethylenediaminetetraacetic acid (EDTA) containing tubes from each rat through a retro-orbital artery. The rats were anesthetized every time by intraperitoneal pentobarbital injection. The samples were immediately centrifuged at 3000 rpm for 10 min. Separated plasma was collected and stored under −20 °C.
Plasma Extraction and Sample Analysis
Before extraction, frozen plasma samples were thawed to ambient temperature. Pioglitazone (10 μL) as an internal standard (IS), equivalent to 5 μg/mL in plasma, was pipetted to 90 μL of each plasma sample in a centrifuge tube and vortexed for 1 min. The sample was then extracted with 1.5 mL of ethanol by vortex mixing for 5 min. The mixture was then centrifuged at 3000 rpm for 10 min to separate the organic layer. This organic layer was subjected to drying under a gentle stream of nitrogen. The dried residue was reconstituted with 200 μL of mobile phase and injected onto the HPLC system after filtering through a 0.22 μm PTFE syringe filter.
Quantitation of telmisartan was done by the HPLC method. The method was developed for biological sample analysis with slight modification in the mobile phase composition and run time of the analytical HPLC method, as described earlier (Selection of Optimum Formulation Based on In Vitro Dissolution Study) in this article. The HPLC parameters of the employed method were the following: reversed-phase; elution mode, isocratic; column, ZORBAX Eclipse Plus C18 (250 mm length, 4.6 mm internal diameter, 5 μm pore size); column temperature, ambient; mobile phase, 50:50 (v/v%) mixture of acetonitrile and 10 mM phosphate buffer solution (pH 3.8); flow rate, 1 mL/min; injection volume, 10 μL; chromatographic run time, 14 min; and detection, UV at 231 nm wavelength. The HPLC method was validated before analysis with a linear response within a range of 0.07–10 μg/mL. The accuracy and intraday and interday precision of the method were established following the standard acceptance criteria of bioanalytical method validation.44 The developed linearity plot was used to quantitate telmisartan in the plasma sample.
Pharmacokinetic Parameters and Relative Bioavailability
Plasma concentrations of telmisartan vs time point data were analyzed by noncompartmental analysis. The maximum plasma concentration (Cmax) and time to reach Cmax (tmax) were derived from the constructed plasma concentrations vs time plot. The area under curve (AUC0–t) was calculated for every animal using the trapezoidal rule. AUC0–∞ were calculated from AUC0–t, last detectable concentration, and elimination rate constant (kel). kel was calculated from the slope of the elimination phase. Finally, relative bioavailability was calculated comparing AUC0–∞ data of one formulation with another following eq 2.
| 2 |
where rel. bio. of formulation 1 is the relative bioavailability of “formulation 1” with respect to that of “formulation 2.”
All pharmacokinetic data were subjected to ANOVA analysis (t-test) to evaluate the statistical significance of the difference between “means” of each group considering a 5% level of significance (p value < 0.05).
Acknowledgments
The research was partially supported by the research grant provided by the Ministry of Higher Education, Malaysia (FRGS-17-006-572).
Supporting Information Available
The Supporting Information is available free of charge at https://pubs.acs.org/doi/10.1021/acsomega.0c04588.
Statistical analysis of in vitro dissolution of solid dispersion (SD) formulation of telmisartan at 15 min by one-way ANOVA (Figure S1) and FTIR spectra of three solid dispersed telmisartan A (F1), B (F2), and C (F3) at three-time points of the accelerated stability study (Figure S2) (PDF)
Author Contributions
The manuscript was written through the contribution of all authors. All authors have given approval to the final version of the manuscript.
The authors declare no competing financial interest.
Supplementary Material
References
- Gora S.; Mustafa G.; Sahni J. K.; Ali J.; Baboota S. Nanosizing of valsartan by high pressure homogenization to produce dissolution enhanced nanosuspension: pharmacokinetics and pharmacodyanamic study. Drug Delivery 2016, 23, 930–940. 10.3109/10717544.2014.923066. [DOI] [PubMed] [Google Scholar]
- Khan A.; Iqbal Z.; Shah Y.; Ahmad L.; Ismail; Ullah Z.; Ullah A. Enhancement of dissolution rate of class II drugs (Hydrochlorothiazide); a comparative study of the two novel approaches; solid dispersion and liqui-solid techniques. Saudi Pharm. J. 2015, 23, 650–657. 10.1016/j.jsps.2015.01.025. [DOI] [PMC free article] [PubMed] [Google Scholar]
- Chatterjee B.; Pal T. Development and in vitro evaluation of micronized sustained release matrix tablet of carvedilol. Int. J. Pharm. Sci. Res. 2010, 1, 96–102. [Google Scholar]
- Choudhury H.; Gorain B.; Chatterjee B.; Mandal U.; Sengupta P.; Tekade R. K. Pharmacokinetic and pharmacodynamic features of nanoemulsion following oral, intravenous, topical and nasal route. Curr. Pharm. Des. 2017, 23, 2504–2531. 10.2174/1381612822666161201143600. [DOI] [PubMed] [Google Scholar]
- Chatterjee B.; Hamed Almurisi S.; Ahmed Mahdi Dukhan A.; Mandal U. K.; Sengupta P. Controversies with self-emulsifying drug delivery system from pharmacokinetic point of view. Drug Delivery 2016, 23, 3639–3652. 10.1080/10717544.2016.1214990. [DOI] [PubMed] [Google Scholar]
- Wei Y.; Zhang J.; Zhou Y.; Bei W.; Li Y.; Yuan Q.; Liang H. Characterization of glabridin/hydroxypropyl-β-cyclodextrin inclusion complex with robust solubility and enhanced bioactivity. Carbohydr. Polym. 2017, 159, 152–160. 10.1016/j.carbpol.2016.11.093. [DOI] [PubMed] [Google Scholar]
- Oo M. K.; Mandal U. K.; Chatterjee B. Polymeric behavior evaluation of PVP K30-poloxamer binary carrier for solid dispersed nisoldipine by experimental design. Pharm. Dev. Technol. 2017, 22, 2–12. 10.3109/10837450.2015.1116568. [DOI] [PubMed] [Google Scholar]
- Thiry J.; Lebrun P.; Vinassa C.; Adam M.; Netchacovitch L.; Ziemons E.; Hubert P.; Krier F.; Evrard B. Continuous production of itraconazole-based solid dispersions by hot melt extrusion: preformulation, optimization and design space determination. Int. J. Pharm. 2016, 515, 114–124. 10.1016/j.ijpharm.2016.10.003. [DOI] [PubMed] [Google Scholar]
- Singh A.; Van den Mooter G. Spray drying formulation of amorphous solid dispersions. Adv. Drug Delivery Rev. 2016, 100, 27–50. 10.1016/j.addr.2015.12.010. [DOI] [PubMed] [Google Scholar]
- Sawicki E.; Schellens J.; Beijnen J.; Nuijen B. Pharmaceutical development of an amorphous solid dispersion formulation of elacridar hydrochloride for proof-of-concept clinical studies. Drug Dev. Ind. Pharm. 2017, 43, 584–594. 10.1080/03639045.2016.1274901. [DOI] [PubMed] [Google Scholar]
- Sengupta P.; Das A.; Ibrahim F.; Mandal U. K.; Chatterjee B.; Mahmood S.; Das S. K.; Kifayatullah M. Safety profiling of pioglitazone and telmisartan combination by sub-chronic toxicity study in rat. Regul. Toxicol. Pharm. 2016, 81, 155–161. 10.1016/j.yrtph.2016.08.009. [DOI] [PubMed] [Google Scholar]
- Cao Y.; Shi L.-L.; Cao Q.-R.; Yang M.; Cui J.-H. In-vivo characterization and oral bioavailability of organic solvent-free solid dispersions containing telmisartan. Iran. J. Pharm. Res. 2016, 15, 385. [PMC free article] [PubMed] [Google Scholar]
- Borbás E.; Nagy Z. K.; Nagy B.; Balogh A.; Farkas B.; Tsinman O.; Tsinman K.; Sinkó B. The effect of formulation additives on in vitro dissolution-absorption profile and in vivo bioavailability of telmisartan from brand and generic formulations. Eur. J. Pharm. Sci. 2018, 114, 310–317. 10.1016/j.ejps.2017.12.029. [DOI] [PubMed] [Google Scholar]
- Tran P. H. L.; Tran H. T. T.; Lee B.-J. Modulation of microenvironmental pH and crystallinity of ionizable telmisartan using alkalizers in solid dispersions for controlled release. J. Controlled Release 2008, 129, 59–65. 10.1016/j.jconrel.2008.04.001. [DOI] [PubMed] [Google Scholar]
- Chandra A.; Ghate M. V.; Aithal K.; Lewis S. A. In silico prediction coupled with in vitro experiments and absorption modeling to study the inclusion complex of telmisartan with modified beta-cyclodextrin. J. Inclusion Phenom. Macrocyclic Chem. 2018, 91, 47–60. 10.1007/s10847-018-0797-x. [DOI] [Google Scholar]
- Zhong L.; Zhu X.; Luo X.; Su W. Dissolution properties and physical characterization of telmisartan–chitosan solid dispersions prepared by mechanochemical activation. AAPS PharmSciTech 2013, 14, 541–550. 10.1208/s12249-013-9937-1. [DOI] [PMC free article] [PubMed] [Google Scholar]
- Thapa C.; Ahad A.; Aqil M.; Imam S. S.; Sultana Y. Formulation and optimization of nanostructured lipid carriers to enhance oral bioavailability of telmisartan using Box–Behnken design. J. Drug Delivery Sci. Technol. 2018, 44, 431–439. 10.1016/j.jddst.2018.02.003. [DOI] [Google Scholar]
- Xu W.-J.; Xie H.-J.; Cao Q.-R.; Shi L.-L.; Cao Y.; Zhu X.-Y.; Cui J.-H. Enhanced dissolution and oral bioavailability of valsartan solid dispersions prepared by a freeze-drying technique using hydrophilic polymers. Drug Delivery 2016, 23, 41–48. 10.3109/10717544.2014.903012. [DOI] [PubMed] [Google Scholar]
- Marasini N.; Tran T. H.; Poudel B. K.; Cho H. J.; Choi Y. K.; Chi S.-C.; Choi H.-G.; Yong C. S.; Kim J. O. Fabrication and evaluation of pH-modulated solid dispersion for telmisartan by spray-drying technique. Int. J. Pharm. 2013, 441, 424–432. 10.1016/j.ijpharm.2012.11.012. [DOI] [PubMed] [Google Scholar]
- Sohn J. S.; Park J.-W.; Choi D. H.; Choi J.-S. Design of telmisartan-weak acid solid dispersion to improve its solubility and stability. Mater. Sci. Eng., B 2020, 261, 114649 10.1016/j.mseb.2020.114649. [DOI] [Google Scholar]
- Yang L.; Shao Y.; Han H.-K. Improved pH-dependent drug release and oral exposure of telmisartan, a poorly soluble drug through the formation of drug-aminoclay complex. Int. J. Pharm. 2014, 471, 258–263. 10.1016/j.ijpharm.2014.05.009. [DOI] [PubMed] [Google Scholar]
- Mahapatra A. K.; Murthy P.; Biswal S.; Mahapatra A. P.; Pradhan S. P. Dissolution Enhancement and Physicochemical Characterization of Valsartan in Solid Dispersions with β-CD, HP β-CD, and PVP K-30. Dissolution Technol. 2011, 18, 39–45. 10.14227/DT180111P39. [DOI] [Google Scholar]
- Chan S.-Y.; Chung Y.-Y.; Cheah X.-Z.; Tan E. Y.-L.; Quah J. The characterization and dissolution performances of spray dried solid dispersion of ketoprofen in hydrophilic carriers. Asian J. Pharm. Sci. 2015, 10, 372–385. 10.1016/j.ajps.2015.04.003. [DOI] [Google Scholar]
- Alves L. D. S.; Soares M. F. d. L. R.; de Albuquerque C. T.; da Silva É. R.; Vieira A. C. C.; Fontes D. A. F.; Figueirêdo C. B. M.; Sobrinho J. L. S.; Neto P. J. R. Solid dispersion of efavirenz in PVP K-30 by conventional solvent and kneading methods. Carbohydr. Polym. 2014, 104, 166–174. 10.1016/j.carbpol.2014.01.027. [DOI] [PubMed] [Google Scholar]
- Cui B.; Feng L.; Wang C.; Yang D.; Yu M.; Zeng Z.; Wang Y.; Sun C.; Zhao X.; Cui H. Stability and biological activity evaluation of chlorantraniliprole solid nanodispersions prepared by high pressure homogenization. PLoS One 2016, 11, e0160877 10.1371/journal.pone.0160877. [DOI] [PMC free article] [PubMed] [Google Scholar]
- Zhong L.; Zhu X.; Yu B.; Su W. Influence of alkalizers on dissolution properties of telmisartan in solid dispersions prepared by cogrinding. Drug Dev. Ind. Pharm. 2014, 40, 1660–1669. 10.3109/03639045.2013.841188. [DOI] [PubMed] [Google Scholar]
- Li S.; Pollock-Dove C.; Dong L. C.; Chen J.; Creasey A. A.; Dai W.-G. Enhanced bioavailability of a poorly water-soluble weakly basic compound using a combination approach of solubilization agents and precipitation inhibitors: a case study. Mol. Pharmaceutics 2012, 9, 1100–1108. 10.1021/mp200352q. [DOI] [PubMed] [Google Scholar]
- Vasconcelos T.; Sarmento B.; Costa P. Solid dispersions as strategy to improve oral bioavailability of poor water soluble drugs. Drug Discovery Today 2007, 12, 1068–1075. 10.1016/j.drudis.2007.09.005. [DOI] [PubMed] [Google Scholar]
- Essa E.; Negm M.; Zin Eldin E.; El Maghraby G. Fast disintegrating tablets of amiodarone for intra-oral administration. J. Appl. Pharm. Sci. 2017, 7, 064–072. 10.7324/JAPS.2017.70109. [DOI] [Google Scholar]
- Sodium Carbonate—Database of ATR-FT-IR Spectra of Various Materials. http://lisa.chem.ut.ee/IR_spectra/paint/fillers/1472-2/.
- Gaja J. B.; Sayyad F. Enhancement of solubility and dissolution rate of telmisartan by spray drying technique. Indo Am. J. Pharm. Res. 2013, 3, 1732–1745. [Google Scholar]
- Xu S.; Dai W.-G. Drug precipitation inhibitors in supersaturable formulations. Int. J. Pharm. 2013, 453, 36–43. 10.1016/j.ijpharm.2013.05.013. [DOI] [PubMed] [Google Scholar]
- Huang Y.; Dai W.-G. Fundamental aspects of solid dispersion technology for poorly soluble drugs. Acta Pharm. Sin. B 2014, 4, 18–25. 10.1016/j.apsb.2013.11.001. [DOI] [PMC free article] [PubMed] [Google Scholar]
- Chella N.; Narra N.; Rama Rao T. Preparation and characterization of liquisolid compacts for improved dissolution of telmisartan. J. Drug Delivery 2014, 2014, 692793 10.1155/2014/692793. [DOI] [PMC free article] [PubMed] [Google Scholar]
- Siow C. R. S.; Wan Sia Heng P.; Chan L. W. Application of freeze-drying in the development of oral drug delivery systems. Expert Opin. Drug Delivery 2016, 13, 1595–1608. 10.1080/17425247.2016.1198767. [DOI] [PubMed] [Google Scholar]
- Peng T.; She Y.; Zhu C.; Shi Y.; Huang Y.; Niu B.; Bai X.; Pan X.; Wu C. Influence of Polymers on the Physical and Chemical Stability of Spray-Dried Amorphous Solid Dispersion: Dipyridamole Degradation Induced by Enteric Polymers. AAPS PharmSciTech 2018, 19, 2620–2628. 10.1208/s12249-018-1082-4. [DOI] [PubMed] [Google Scholar]
- Janssens S.; Van den Mooter G. Physical chemistry of solid dispersions. J. Pharm. Pharmacol. 2009, 61, 1571–1586. 10.1211/jpp.61.12.0001. [DOI] [PubMed] [Google Scholar]
- Li W.; Buckton G. Using DVS-NIR to assess the water sorption behaviour and stability of a griseofulvin/PVP K30 solid dispersion. Int. J. Pharm. 2015, 495, 999–1004. 10.1016/j.ijpharm.2015.10.015. [DOI] [PubMed] [Google Scholar]
- Wienen W.; Entzeroth M.; van Meel J. C.; Stangier J.; Busch U.; Ebner T.; Schmid J.; Lehmann H.; Matzek K.; Kempthorne-Rawson J. A review on telmisartan: a novel, long-acting angiotensin II-receptor antagonist. Cardiovasc. Drug Rev. 2000, 18, 127–154. 10.1111/j.1527-3466.2000.tb00039.x. [DOI] [Google Scholar]
- Yan Y.-D.; Sung J. H.; Kim K. K.; Kim D. W.; Kim J. O.; Lee B.-J.; Yong C. S.; Choi H.-G. Novel valsartan-loaded solid dispersion with enhanced bioavailability and no crystalline changes. Int. J. Pharm. 2012, 422, 202–210. 10.1016/j.ijpharm.2011.10.053. [DOI] [PubMed] [Google Scholar]
- Pharmacopeia U.National Formulary USP 38—NF 33; United States Pharmacopeial Convention: Rockville, 2015. [Google Scholar]
- National Center for Biotechnology Information. Sodium carbonate|Na2CO3—PubChem. PubChem Compound Database, 2018.
- Sengupta P.; Chatterjee B.; Pal T. K. Assessment of preclinical pharmacokinetics and acute toxicity of pioglitazone and telmisartan combination. Regul. Toxicol. Pharmacol. 2017, 91, 151–158. 10.1016/j.yrtph.2017.10.029. [DOI] [PubMed] [Google Scholar]
- Sengupta P.; Chatterjee B.; Mandal U. K.; Gorain B.; Pal T. K. Development and validation of a high throughput LC–MS/MS method for simultaneous quantitation of pioglitazone and telmisartan in rat plasma and its application to a pharmacokinetic study. J. Pharm. Anal. 2017, 7, 381–387. 10.1016/j.jpha.2017.05.004. [DOI] [PMC free article] [PubMed] [Google Scholar]
Associated Data
This section collects any data citations, data availability statements, or supplementary materials included in this article.