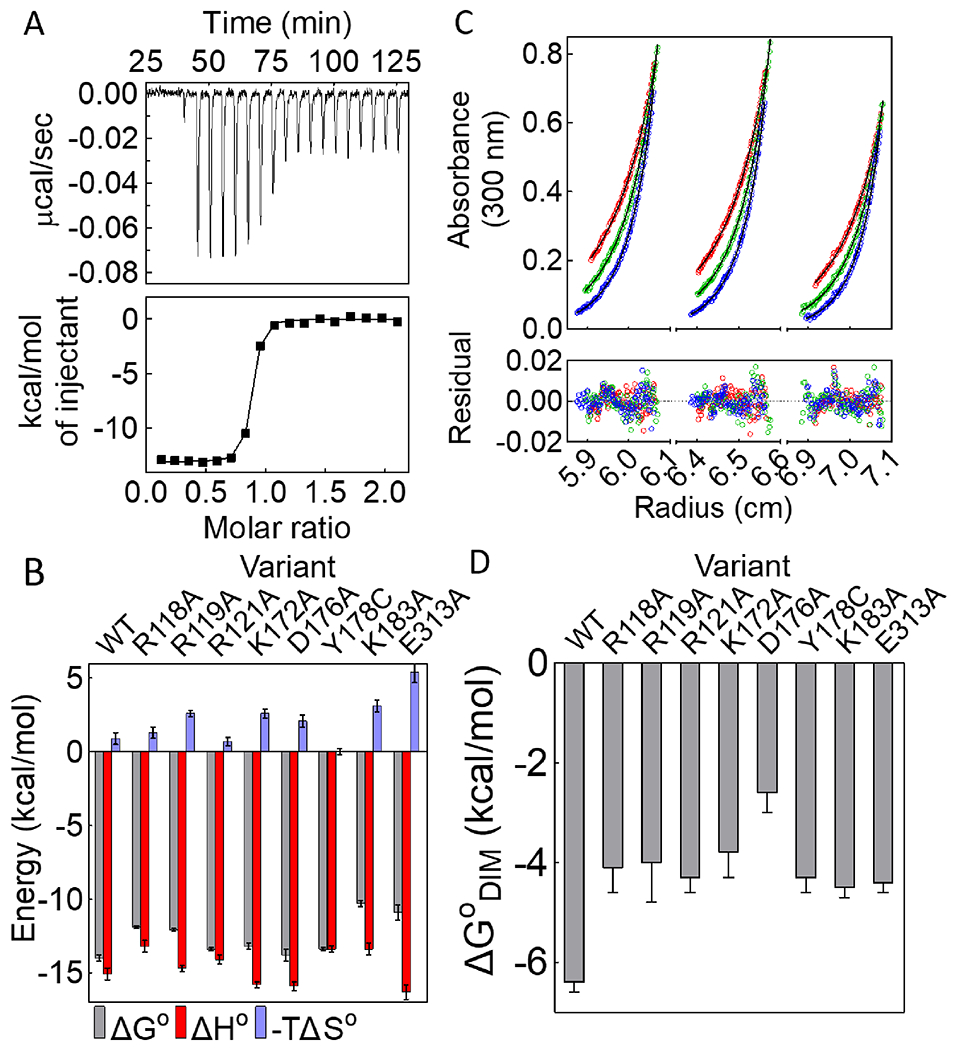
Figure 3. Network residues function in allosteric input and output.

(A) Titration of BirAR118A with bio-5’-AMP (top) with analysis of the resulting data using a single-site binding model (bottom). (B) Histograms showing thermodynamics of bio-5’-AMP binding, with error bars representing one standard deviation or propagated error calculated from at least two independent measurements. (C) HoloBirAR121A sedimentation equilibrium measurement performed at 18k (red), 21k (green), 24k (blue) rpm with protein samples prepared at 60μM (left), 50μM (middle), 40μM (right) protein concentrations. Top: Absorbance vs radius profiles with best-fits to a monomer-dimer model shown as solid lines. Bottom: Residuals of the fit. (D) Dimerization free energies for network variants obtained from at least two independent measurements with error bars representing the 67% confidence intervals.
