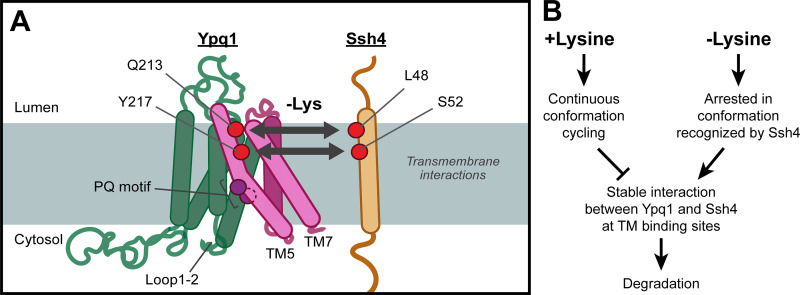
Many membrane proteins are selectively ubiquitinated and degraded under specific stresses. How do ubiquitin ligases ignore membrane targets under normal conditions but then recognize them under stresses? Arines et al. identify a substrate-regulated transmembrane recognition mechanism between a lysine transporter, Ypq1, and the Ssh4–Rsp5 complex.
Abstract
While it is well-known that E3 ubiquitin ligases can selectively ubiquitinate membrane proteins in response to specific environmental cues, the underlying mechanisms for the selectivity are poorly understood. In particular, the role of transmembrane regions, if any, in target recognition remains an open question. Here, we describe how Ssh4, a yeast E3 ligase adaptor, recognizes the PQ-loop lysine transporter Ypq1 only after lysine starvation. We show evidence of an interaction between two transmembrane helices of Ypq1 (TM5 and TM7) and the single transmembrane helix of Ssh4. This interaction is regulated by the conserved PQ motif. Strikingly, recent structural studies of the PQ-loop family have suggested that TM5 and TM7 undergo major conformational changes during substrate transport, implying that transport-associated conformational changes may determine the selectivity. These findings thus provide critical information concerning the regulatory mechanism through which transmembrane domains can be specifically recognized in response to changing environmental conditions.
Introduction
Membrane proteins constitute ∼30% of the proteome and perform essential functions including cell signaling and nutrient exchange (Krogh et al., 2001). As the cell responds to rapidly changing environments and diverse cellular cues, the membrane protein landscape needs to be constantly remodeled to achieve homeostasis. For example, the protein levels of many yeast plasma membrane (PM) transporters are regulated by their substrate concentrations (Crapeau et al., 2014; Gournas et al., 2010, 2017; Guiney et al., 2016; Keener and Babst, 2013; Lin et al., 2008; Talaia et al., 2017; Wawrzycka et al., 2019). Low substrate levels, such as low methionine and uracil, stabilize their corresponding PM transporters, Mup1 and Fur4, respectively. However, high methionine and uracil levels trigger their ubiquitination and degradation (Keener and Babst, 2013; Lin et al., 2008). Besides the regulation of functional membrane proteins, damaged and misfolded proteins also need to be removed to ensure proper membrane function. To do so, a set of E3 ubiquitin ligases and adaptor proteins has evolved to regulate the quantity and quality of membrane proteins on different organelles (Sun and Brodsky, 2019). These E3 ligase systems can be divided into transmembrane E3 ligases/adaptors and cytosolic E3 ligases/adaptors that require membrane recruitment.
A key question is how E3 ligase systems selectively recognize their membrane targets. In particular, how do E3 ligases ignore target proteins under normal conditions, but then recognize them when triggered by a specific environmental cue? For cytosolic E3 ligases/adaptors and their targets, it is conceivable that protein–protein interactions happen on domains facing the cytosolic side. Indeed, several studies of yeast PM transporters have revealed that conditional exposure of a cytosolic degron under stress conditions provides selectivity. In particular, members of the amino acid–polyamine–organocation superfamily, including Fur4, Can1 (an arginine transporter), Mup1, and Thi7 (a thiamine transporter), all contain an N-terminal tail that is normally “tucked in,” but is quickly exposed once the transporter encounters a high concentration of substrates or other stress conditions (e.g., heat, cycloheximide; Guiney et al., 2016; Keener and Babst, 2013; Savocco et al., 2019). Their exposed cytosolic tails are then recognized by α-arrestins or ARTs, which are adaptor proteins that recruit the E3 ligase Rsp5.
While much is known about cytosolic recognition mechanisms, how recognition events occur within the transmembrane regions remains an open question. Early studies demonstrated that the exposure of polar/charged residues within transmembrane helices (TMs), either from misfolding or mutagenesis, can lead to the degradation of membrane proteins (Bonifacino et al., 1991; Reggiori and Pelham, 2002; Sato et al., 2009). This observation suggests that these polar/charged residues can be recognized by transmembrane E3 ligases or their adaptors. However, it is unclear how this recognition is accomplished within the lipid bilayer. More importantly, many membrane proteins that are properly folded can still be recognized by transmembrane E3 ligases in a regulated manner (Li et al., 2015a, b; Natarajan et al., 2020; Song et al., 2005; Yang et al., 2020). Could the transmembrane regions contribute to forming a binding site with E3 ligases? If so, how is this process regulated to achieve selectivity?
To answer these questions, we focused on the regulation of Ypq1, a seven-transmembrane Pro-Gln (PQ)–loop lysine transporter on the yeast vacuole membrane (VM; Li et al., 2015a). The PQ-loop protein family is conserved from bacteria to humans (Amick et al., 2020; Bräuer et al., 2019; Han et al., 2017; Jézégou et al., 2012; Liu et al., 2012; Saudek, 2012). Under lysine-replete conditions, Ypq1 is localized on the VM to facilitate the import of excess lysine into the vacuole, which in yeast also has nutrient storage roles (Sekito et al., 2014). When lysine is depleted from the environment, Ypq1 import activity needs to be stopped to maintain sufficient levels of lysine in the cytosol. During this time, Ypq1 is recognized by the transmembrane adaptor Ssh4, which recruits the cytosolic E3 ligase Rsp5 to initiate Ypq1 ubiquitination. After ubiquitination, Ypq1 is internalized by the endosomal sorting complex required for transport (ESCRT) machinery into the vacuole lumen, where it is degraded by vacuolar proteases (Li et al., 2015a; Zhu et al., 2017). The precision of ubiquitinating lysine-starved Ypq1, but not lysine-replete Ypq1, suggests that there are lysine-regulated conformational changes that lead to this recognition. Focusing on the Ypq1-Ssh4 interaction, we asked what regions of Ypq1 are recognized by Ssh4. We also asked how lysine plays a role in the recognition of these regions.
Several technical constraints make this investigation challenging: (1) the Ypq1-Ssh4 interaction is transient and weak, (2) the binding quickly leads to the destruction of Ypq1, and (3) both are membrane proteins that are difficult to purify and crystallize. Therefore, we developed a suppressor screen and combined it with structural modeling and biochemical analysis to elucidate the recognition mechanism. Our results indicated that TM5 and TM7 are critical for interacting with the single transmembrane helix of Ssh4. This interaction is regulated by the PQ motif. Interestingly, structural studies of the PQ-loop family members suggest that active substrate transport is coupled with constant conformation changes of TM5 and TM7. This dynamic conformation may prevent the Ypq1-Ssh4 interaction. In contrast, the absence of lysine may stop the conformational change from occurring, thereby allowing the interaction and Ypq1 ubiquitination. Our study underscores the transmembrane interaction as a novel and unexplored route for understanding E3 ligase selectivity.
Results
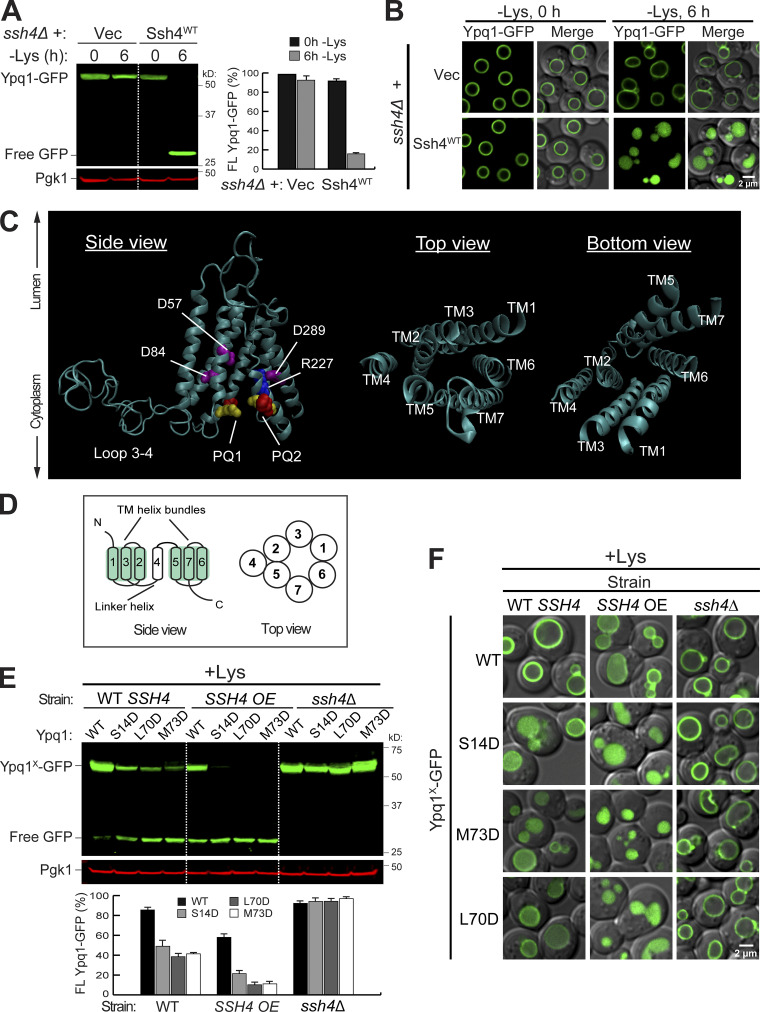
To monitor the turnover of Ypq1 in vivo, we took advantage of a chimeric Ypq1-GFP processing assay. When Ypq1-GFP is delivered to the vacuole lumen, the Ypq1 portion of the chimera is rapidly degraded, whereas the relatively protease-resistant GFP resists degradation (Li et al., 2015a). As shown in Fig. 1 A, lysine withdrawal triggered the degradation of full-length Ypq1-GFP, resulting in the accumulation of free GFP. In contrast, deleting SSH4 blocked the process. Furthermore, Ypq1-GFP which localizes on the vacuole membrane is internalized into the vacuole lumen only in the presence of Ssh4 (Fig. 1 B). Here we confirmed the importance of Ssh4 in recognizing Ypq1 for degradation. However, the mechanisms that drive selectivity are not yet understood.
Figure 1.
Isolation of constitutively degrading Ypq1 mutants. (A) Left: Western blot showing degradation of Ypq1-GFP before (0 h) or after (6 h) Lys starvation. Vec, Empty vector. Pgk1, loading control. Right: Protein levels were quantified as FL Ypq1-GFP/(FL Ypq1-GFP + free GFP). The error bars represent SD (n = 3). FL, full-length. (B) Subcellular localization of Ypq1-GFP before and after Lys starvation. Scale bar, 2 µm. (C) Predicted structure of Ypq1 showing PQ motifs and charged residues within the translocation tunnel. In top and bottom views, loops have been removed for clarity. (D) General architecture of eukaryotic PQ-loop family members. (E) Top: Degradation of constitutive Ypq1 mutants under different expression levels of Ssh4: endogenous (WT SSH4), overexpression (SSH4 OE), and deletion (ssh4Δ). Bottom: Quantification (±SD, n = 3). (F) Subcellular localization of Ypq1-GFP mutants. Scale bar, 2 µm.
Isolation of constitutively degrading Ypq1 mutants
Ypq1 is a member of the PQ-loop transporter family, which has two conserved PQ motifs. Other family members include bacterial and plant sugar transporters (i.e., SWEETs) and human amino acid transporters PQLC2 and cystinosin (CTNS; Feng and Frommer, 2015; Jézégou et al., 2012; Ruivo et al., 2012; Saudek, 2012). Eukaryotic PQ-loop proteins typically have seven transmembrane helices (Fig. 1, C and D). TMs 1–3 and TMs 5–7 form triple helix bundles (THB). Within each THB, helices are arranged in an alternating 1-3-2 topology. These two THBs form the translocation tunnel and are connected by a linker helix (TM4).
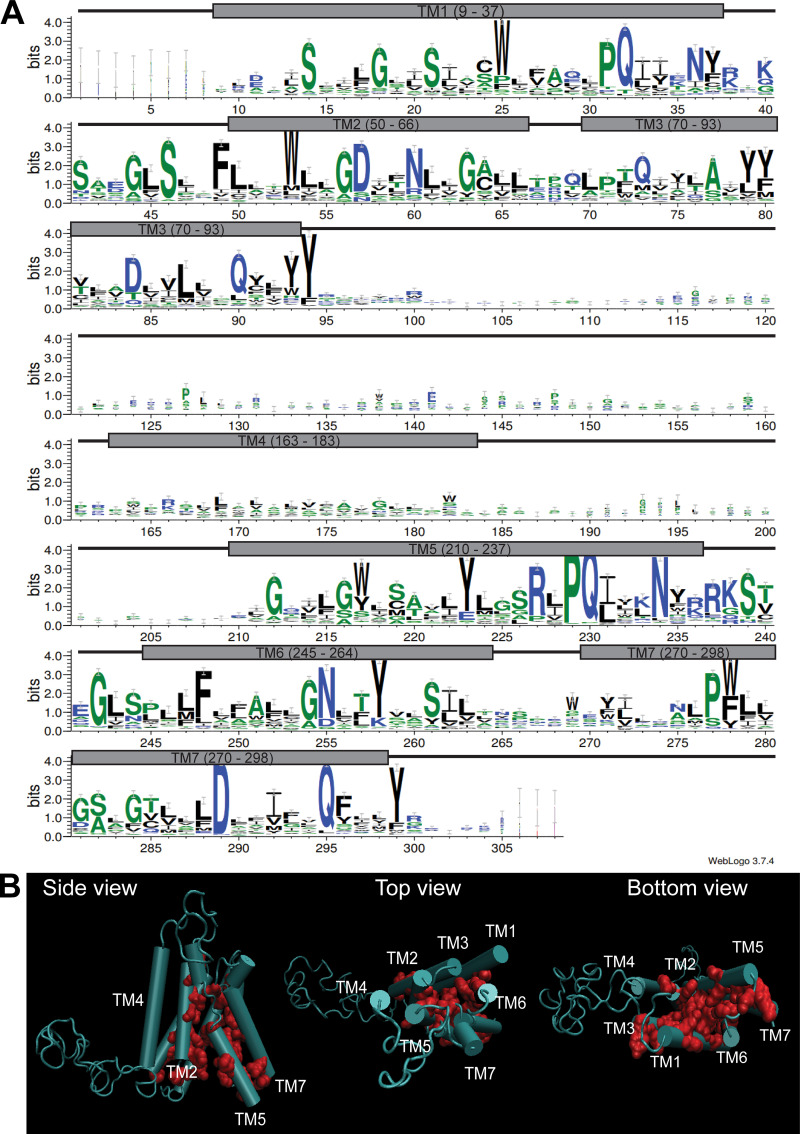
Within the PQ-loop family, several crystal structures have been solved (Han et al., 2017; Tao et al., 2015; Xu et al., 2014). Using homology modeling (Waterhouse et al., 2018), we generated a 3D model of Ypq1 (Fig. 1 C and Video 1) based on the inward-open structure of rice glucose transporter OsSWEET2b (Tao et al., 2015). Through evolutionary covariation analysis (Kamisetty et al., 2013; Ovchinnikov et al., 2014), we identified conserved residues after aligning 420 Ypq1-related sequences from eukaryotes (Fig. S1 A). When plotted on the predicted Ypq1 structure, conserved residues in the transmembrane domains clustered together, validating the model (Fig. S1 B; Ovchinnikov et al., 2015; Valdar, 2002). Of note, the cytosolic loops, especially the large loop between TM3 and TM4, appear to be unstructured due to insufficient sequence homology within these regions (Fig. S1 A).
Video 1.
Ypq1 homology model. Related to Fig. 1 C. Ypq1 model (cyan) shown in ribbon representation. Highlighted in surface representation are negatively charged residues (purple) and the single positively charged residue (blue) facing the translocation tunnel. Shown also are the Pro (red) and Gln (yellow) residues in the PQ motifs.
Figure S1.
Validation of homology model using GREMLIN. Related to Fig. 1. (A) WebLogo representation of conserved residues on Ypq1 based on covariation analysis of 420 related eukaryotic sequences using GREMLIN. Gray boxes correspond to transmembrane helices, and black connecting lines correspond to loops. (B) Conserved residues mapped on the homology model of Ypq1.
Further examination revealed several highly conserved charged residues within the translocation tunnel (i.e., D57, D84, R227, and D289; Fig. 1 C and Fig. S1 A). Collectively, these make the tunnel interior negatively charged, which could be important in the transport of the positively charged lysine (Yu et al., 2015). We wondered what would happen if we introduced more negative charges in the tunnel, because lysine withdrawal would also make the tunnel more negative. To this end, we substituted noncharged residues with Asp. We isolated three constitutively degrading mutants (S14D, L70D, and M73D). Although WT Ypq1 was only degraded following lysine starvation, the mutant forms of Ypq1 were partially degraded under lysine-replete conditions (+Lys; Fig. 1, E and F). Overexpressing Ssh4 partially degraded WT Ypq1-GFP, but significantly enhanced the degradation of the mutants, whereas deleting SSH4 abolished the degradation. The mutants likely did not have gross defects in folding, or they would have been retained in the ER and degraded by ER-associated degradation pathways (Ruggiano et al., 2014; Sun and Brodsky, 2019). Instead, they still trafficked normally to the vacuole membrane, where they were recognized by Ssh4. In the ssh4Δ strain, these mutants were stabilized on the vacuole membrane at similar levels to WT Ypq1-GFP (Fig. 1, E and F), ruling out the possibility that they might have been ubiquitinated by other protein quality control systems.
In summary, we isolated three Ypq1 mutants that are constitutively degraded even in the presence of lysine. This degradation is still dependent on Ssh4.
A suppressor screen identified critical regions in Ypq1
The isolation of constitutive Ypq1 mutants enabled us to identify critical residues important for Ypq1 degradation. Because these mutants were still recognized by Ssh4, we hypothesized that they may adopt a state similar to WT Ypq1 after lysine starvation. One testable prediction is that interrupting the Ypq1-Ssh4 interface should block both the constitutive degradation and the lysine withdrawal–triggered degradation.
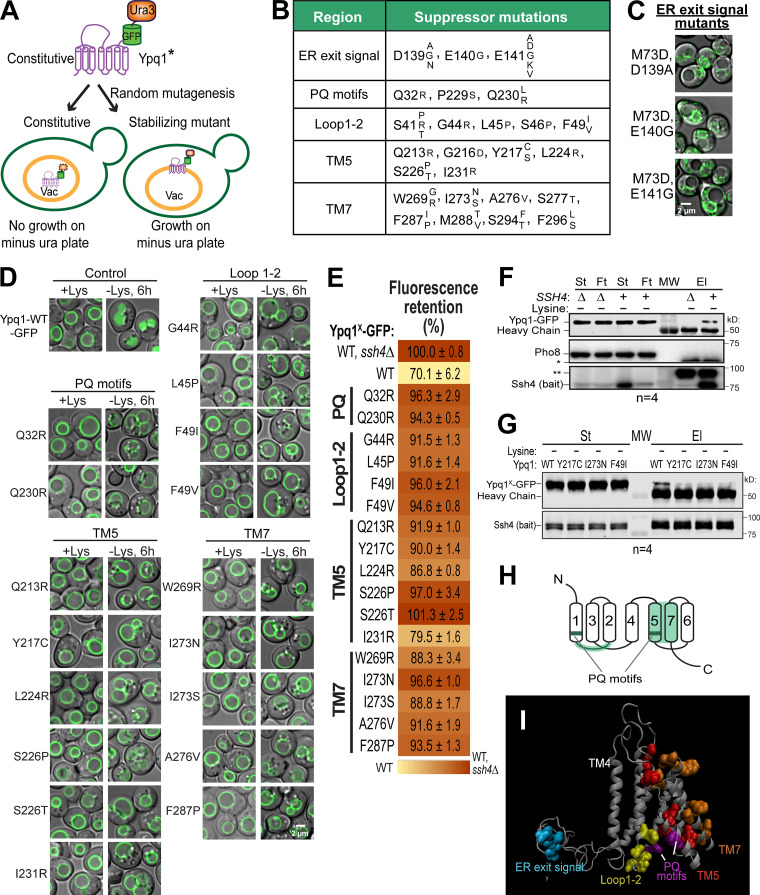
To test this, we designed a suppressor-screen strategy. As shown in Fig. 2 A, we created a fusion construct Ypq1*-GFP-Ura3, which consists of a constitutively degrading Ypq1-GFP mutant fused with Ura3, an essential enzyme in uracil synthesis.
Figure 2.
A suppressor screen identified clusters on Ypq1 that are important in its degradation. (A) Design of the suppressor screen using constitutively degrading Ypq1 (*, S14D, L70D, or M73D). Vac, vacuole; Ura, uracil. (B) Summary of the genuine suppressor residues and their corresponding mutations. (C) Subcellular localization of Ypq1M73D-GFP-Ura3 with mutations on 139DEE141. Scale bar, 2 µm. (D) The suppressor mutations also blocked the Lys withdrawal-triggered Ypq1-GFP internalization. Scale bar, 2 µm. (E) Heat map of mutant Ypq1-GFP degradation defect based on flow cytometry. Negative control, Ypq1WT-GFP in ssh4Δ strain, defined as 100%. Positive control, Ypq1WT-GFP in WT strain. (F) CoIP of WT Ypq1-GFP with overexpressed PPxY mutant Ssh4 (bait) in Lys-starved conditions. Pho8, negative control; St, starting material; Ft, flow-through; El, elution; MW, molecular weight marker; * and **, nonspecific bands. (G) CoIP of Ypq1-GFP mutants with overexpressed PPxY mutant Ssh4 in Lys-starved conditions. (H) Critical regions on Ypq1 based on suppressor screen mapped on the conserved architecture of PQ-loop proteins. (I) Critical residues mapped on the 3D model of Ypq1. TM4 shown as a reference point.
Using error-prone PCR, we randomly mutagenized the constitutive Ypq1* coding sequence and transformed the PCR product into a yeast strain auxotrophic to uracil (i.e., SEY6210). To ensure stringency, we overexpressed Ssh4 under the control of the CYC1 promoter. Emerging suppressors that effectively block the constitutive degradation would stabilize the fusion protein on the vacuole membrane, thereby allowing yeast to survive on media lacking uracil.
Using this strategy, a total of 99 unique suppressor mutants were recovered and sequenced (Table S1). Each mutant contained a combination of one to four interspersed mutations. To determine genuine suppressors, we focused on those that either occurred as a single point mutation or appeared frequently. Using these criteria, we identified 25 critical residues (Fig. 2 B). When mapped on the protein sequence of Ypq1, these residues form five distinct groups: (1) residues that affect ER exit (26 mutants), (2) the PQ motifs (9 mutants), (3) the cytosolic loop between TMs 1 and 2 (8 mutants), (4) TM5 (21 mutants), and (5) TM7 (21 mutants), or a combination of these regions (5 mutants). From this screen we also found two mutants (I138T,G173D and Q232R,N130D) whose mutations did not fit into any category, and seven weak suppressors that survived the uracil selection but still appeared to localize in the lumen (Table S1).
For the first set of mutants, survival was due to a trafficking defect. Instead of trafficking to the vacuole, Ypq1*-GFP-Ura3 was trapped in the ER (Fig. 2 C). Out of 26 ER-trapped mutants, 17 had substitutions on D139, E140, or E141. Notably, we even isolated a mutant, E141D, wherein mutating Glu to Asp prevented its exit from the ER. This indicates that 139DEE141 is a classic acidic ER exit signal (Mikosch et al., 2009; Miller et al., 2003; Nishimura and Balch, 1997). The remaining nine ER-trapped mutants had a significant reduction in protein levels (data not shown), likely due to folding defects, and so were trapped by ER quality control systems. Although interesting, these ER-trapped mutants do not provide further insight for our study and so were not pursued further.
Meanwhile, mutations on the remaining four clusters (i.e., PQ, Loop1-2, TM5, and TM7) still allowed Ypq1*-GFP-Ura3 to localize to the VM. To test whether these regions also govern lysine-mediated degradation, we introduced these mutations into WT Ypq1-GFP. Among those we tested, imaging analysis showed that all mutations consistently blocked the sorting of Ypq1-GFP into the lumen after lysine withdrawal (Fig. 2 D). These results strongly support the idea that the constitutive mutants and lysine-starved Ypq1 are using the same regions to regulate recognition by Ssh4.
A flow cytometry–based method to measure Ypq1 degradation
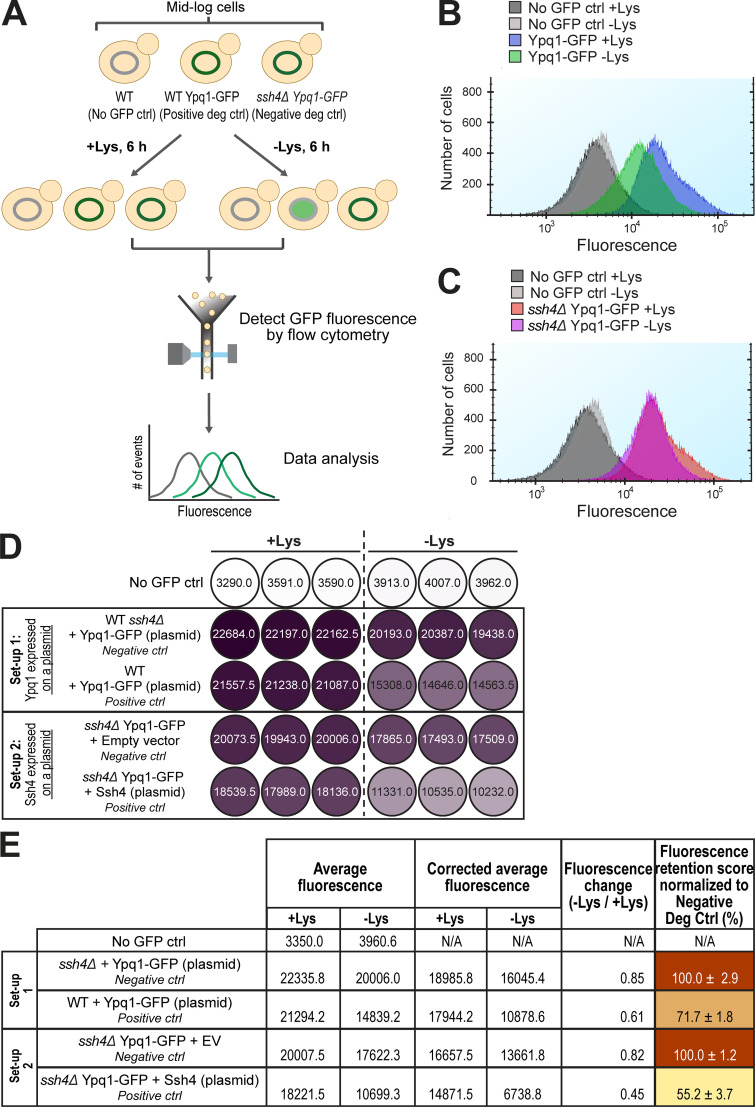
Next, we sought to quantify the degradation defects of these suppressors by developing a GFP-based flow cytometry method. We grew yeast expressing Ypq1-GFP in both +Lys and –Lys media for 6 h and measured the difference in total cellular fluorescence (Fig. S2 A). Although GFP is resistant to vacuolar proteases, it partially drops in fluorescence under acidic pH (Patterson et al., 1997). Consistently, we observed a quantifiable shift in fluorescence after lysine withdrawal when Ypq1-GFP is sorted into the acidic vacuole lumen (Fig. S2 B). This shift was absent in ssh4Δ cells (Fig. S2 C), indicating that the decrease in fluorescence was Ssh4-dependent. We then calculated the fluorescence change by dividing the fluorescence value in –Lys conditions by the +Lys value (Fig. S2, D and E; see Materials and methods for details). This number was then normalized with the fluorescence change of the negative control (ssh4Δ) to generate a final fluorescence retention (FR) score. A higher FR score means that more Ypq1-GFP was stabilized on the VM, and thus is indicative of a stronger block in degradation.
Figure S2.
Suppressor residues and flow cytometry-based method to quantify Ypq1-GFP degradation. Related to Fig. 2. (A) Workflow of flow cytometry–based degradation assay. Shown are several degradation controls (deg ctrl). (B) Fluorescence histogram of cells expressing Ypq1-GFP grown in the presence or absence of Lys. No GFP ctrl: WT SEY6210. (C) Fluorescence histogram of cells expressing Ypq1-GFP but lacking Ssh4 in the presence or absence of Lys. No GFP ctrl: WT SEY6210. (D) Heat map showing fluorescence (arbitrary units) in three replicates of no GFP control, negative control, and positive control in two experimental setups. Setup 1: Ypq1-GFP expressed in a plasmid, Ssh4 from the genomic locus. Setup 2: Ypq1 was chromosomally tagged with GFP and Ssh4 expressed in a plasmid. Darker colors correspond to higher fluorescence. (E) Step-by-step calculation used to generate heat map in Fig. 2 E. First column: Fluorescence values from three replicates were averaged. Second column: Fluorescence values were corrected by subtracting average fluorescence values of no GFP control strain. Third column: FC values were calculated by dividing the CAF at −Lys by the CAF at +Lys. Fourth column: Final FR scores were calculated by dividing the FC value of the sample with the FC value of the negative control. This sets the value of the negative control as 100%. Setup 1 had higher FR scores, possibly because the host strain contained the endogenous Ypq1 that might have “diluted” the degradation. N/A, not applicable.
Using this method, the FR score of Ypq1WT-GFP degradation was calculated to be at 70.1%. In contrast, the FR scores of the Ypq1-GFP suppressors were clearly higher, with most of the scores being >90%, indicating a strong block of degradation (Fig. 2 E).
Suppressors disrupt Ypq1-Ssh4 complex formation
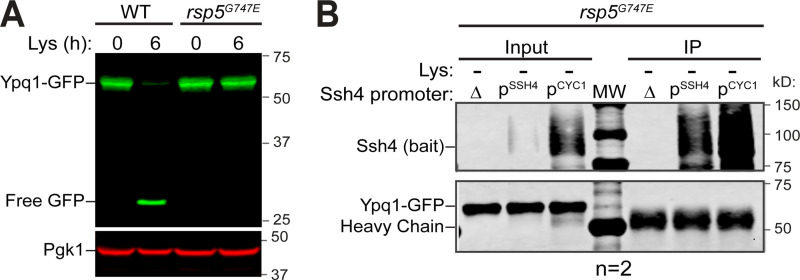
Based on imaging and flow cytometry, we confirmed that the PQ motifs, the cytosolic Loop1-2, TM5, and TM7 are critical for lysine depletion–triggered Ypq1-GFP degradation. We hypothesized that the disruption might be due to Ypq1 losing its recognizability to Ssh4, presumably due to a loss of interaction. Despite many attempts, coimmunoprecipitation (coIP) had been unsuccessful under native conditions, likely due to the low expression of Ssh4 (Kulak et al., 2014), the transient interaction between Ypq1 and Ssh4, the prompt degradation of Ypq1 after the interaction, or a combination of these factors. In one condition, we expressed Ypq1-GFP and Ssh4 in a hypomorphic Rsp5 (G747E) mutant (Fisk and Yaffe, 1999; Tardiff et al., 2013) to potentially reduce Ypq1-GFP degradation (Fig. S3 A). No coIP was observed even after overexpressing Ssh4 (Fig. S3 B). To mitigate these difficulties, we overexpressed Ssh4 under the control of the CYC1 promoter. The two PPxY motifs (where P = proline, x = any amino acid, and Y = tyrosine) of Ssh4 were also mutated to prevent Rsp5 recruitment, further stabilizing the complex (Li et al., 2015a). Under lysine starvation conditions, a small fraction of Ypq1-GFP coprecipitated with Ssh4 (Fig. 2 F; compare the last two lanes), demonstrating an association, either direct or indirect, between the two proteins.
Figure S3.
CoIP of Ypq1 and Ssh4 in the presence of an Rsp5 mutant. Related to Fig. 2. (A) Degradation of Ypq1-GFP before (0 h) or after (6 h) Lys starvation in the presence of WT Rsp5 or rsp5G747E. (B) CoIP of Ypq1-GFP with WT Ssh4 (bait) expressed under its native promoter (PSSH4) or an overexpression promoter (PCYC1) in a weak Rsp5 mutant (rsp5G747E) background. IP, immunoprecipitation.
We then tested if the suppressors could be influencing the ability of Ypq1 to associate with Ssh4. Using the same coIP conditions as in Fig. 2 F, pull-down was markedly reduced when WT Ypq1 was replaced with representative suppressor mutants from each region (Fig. 2 G), suggesting that TM5, TM7, and the cytosolic Loop1-2 on Ypq1 play a role in recruiting Ssh4.
The importance of Ypq1 transmembrane helices in the Ypq1-Ssh4 interaction
Our finding that the cytosolic Loop1-2 plays a role in Ypq1’s recognition is consistent with reports on the interaction between Ssh4 and its cargoes at cytosolic regions close to the membrane (Ma and Burd, 2019; Sardana et al., 2019). Cytosolic interactions have also been robustly studied for other Rsp5 adaptors and their cargo (Crapeau et al., 2014; Gournas et al., 2016, 2017; Guiney et al., 2016; Keener and Babst, 2013; Sullivan et al., 2007; Wawrzycka et al., 2019). However, the prevalence of TM5 or TM7 mutations in our screen (i.e., 44 out of 66 VM-localized mutants) suggested that transmembrane interactions could also be playing an essential role in Ypq1 recognition.
Strikingly, although TM5 and TM7 are separated by TM6 in the primary protein structure, they are adjacent in the predicted 3D structure (Fig. 1, C and D; Fig. 2, H and I; and Video 2). Therefore, we hypothesized that TM5 and TM7 could comprise a binding pocket for the single transmembrane helix of Ssh4.
Video 2.
Ypq1 homology model with suppressor residues. Related to Fig. 2 I. Ypq1 model (gray) shown in ribbon representation. Highlighted in surface representation are suppressor residues at the ER exit signal (teal), Loop1-2 (yellow), PQ motifs (purple), TM5 (red), and TM7 (orange) regions.
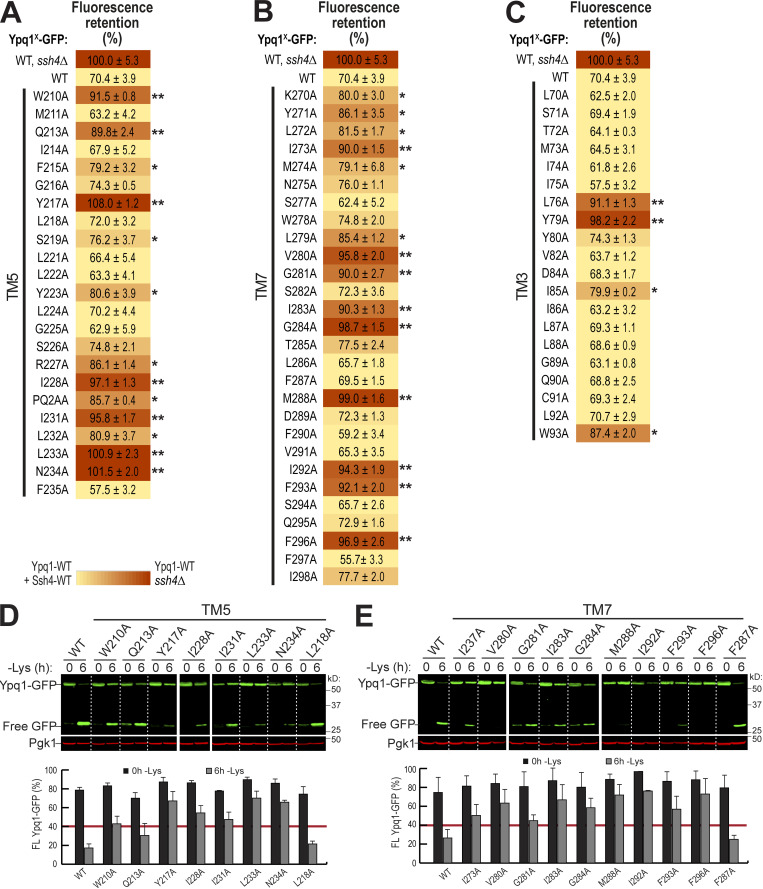
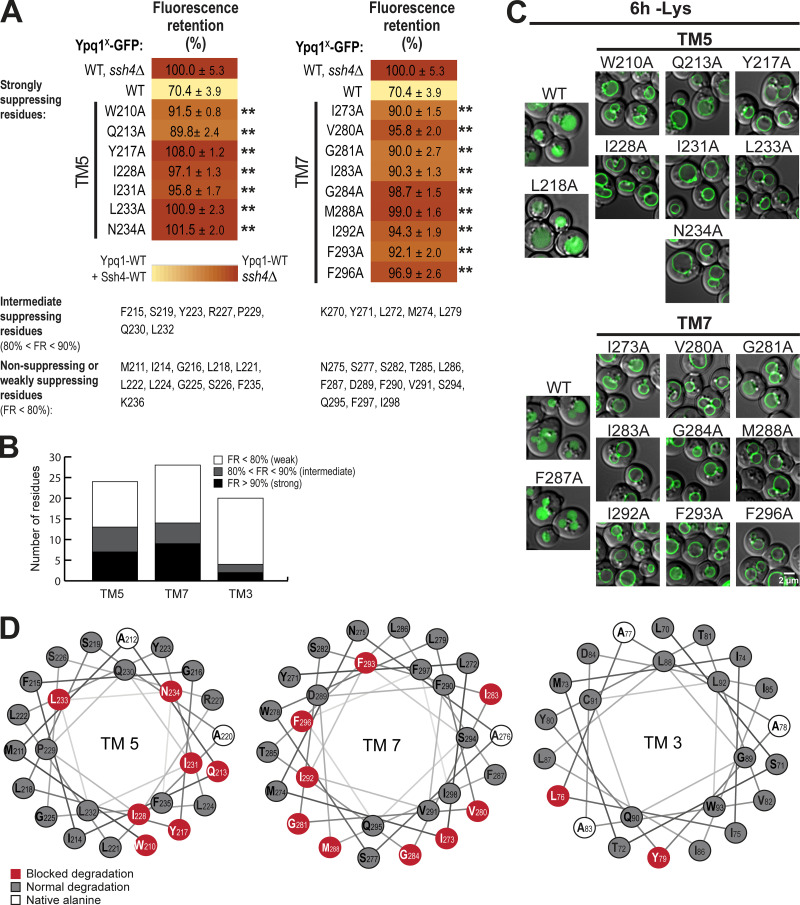
To confirm the importance of TM5 and TM7, we performed scanning mutagenesis by mutating each residue to Ala. Using flow cytometry, imaging, and Western blot analyses, we tested whether they could block lysine-mediated degradation. As a control, we did the same scanning mutagenesis on TM3, which did not have suppressors based on our screen. Through this scanning, we identified additional suppressor mutations in all transmembrane helices tested. In TM5, we found 7 out of 23 residues that caused a strong block (90% or higher FR score), whereas in TM7, 9 out of 28 residues were strong blockers (Fig. 4, A and B; Fig. S4, A and B; and Fig. S4, D and E). In contrast, only 2 out of 20 residues in TM3 showed a strong block (Fig. 3 B and Fig. S4 C). When the cutoff was lowered to 80% FR, 13 out of 23 residues in TM5 showed an intermediate block or stronger, TM7 had 14 out of 28, and TM3 had 4 out of 20. When imaged, the high FR mutants consistently localized on the vacuole membrane (Fig. 3 C). Mapping the Ala scanning suppressors on helical wheels showed that TM5 seemed to have a cluster of important residues at one region and several scattered residues (Fig. 3 D). TM7 had more critical residues, and most of them line one face of the helix. Although we do not know the role of the two suppressor residues in TM3 yet, here we underscore the importance of TM5 and TM7 in mediating Ypq1 degradation, presumably by forming binding sites with Ssh4 within the lipid bilayer.
Figure 4.
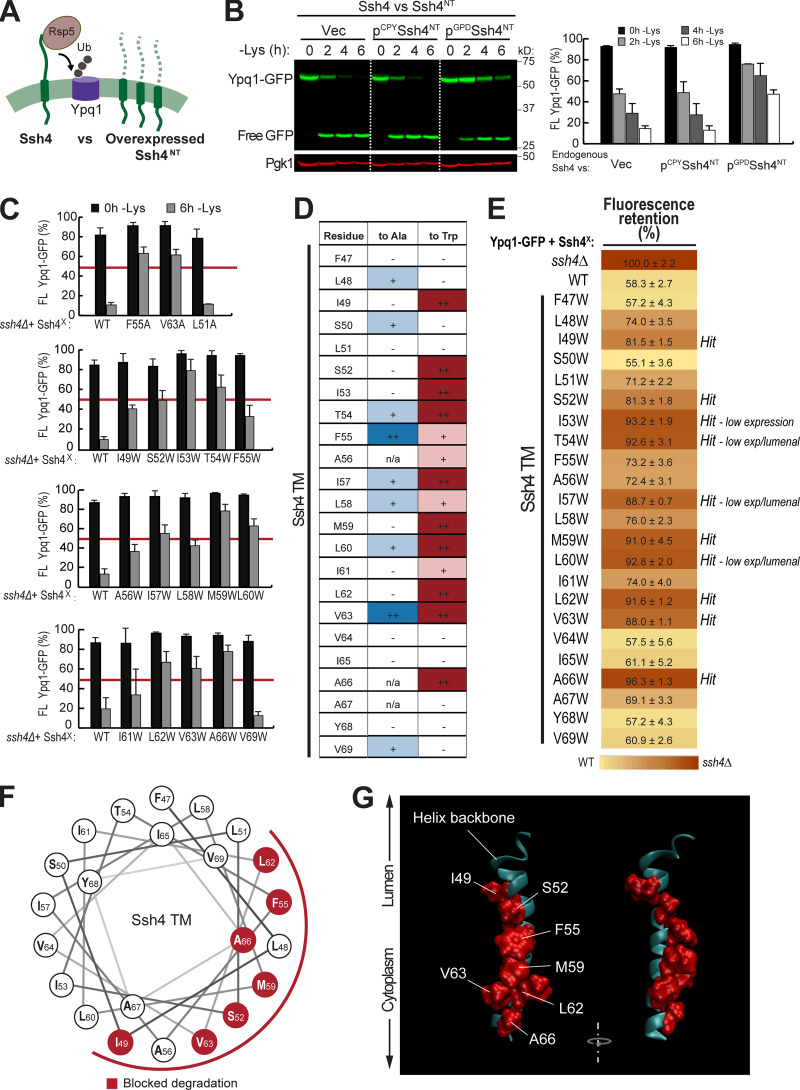
The transmembrane helix of Ssh4 is important for Ypq1 degradation. (A) Conceptual model of competition assay. Full-length Ssh4 can interact with and ubiquitinate Ypq1, whereas Ssh4NT can only interact but not ubiquitinate. Ub, ubiquitin. (B) Left: Ypq1-GFP degradation kinetics after Ssh4NT overexpression. Right: Quantification (±SD, n = 3). Vec, empty vector. (C) Ypq1-GFP degradation conferred by Ssh4 TM Ala (A) or Trp (W) mutants based on Western blot. Red bar set at 50% as cutoff for strong blocking mutants. WT, L51A, and V69W are nonblockers (±SD, n = 3). Also see Fig. S4, D and E, for blots. (D) Degradation phenotype of Ypq1-GFP when Ssh4 TM residues were mutated to Ala (blue) or Trp (red), based on quantitative Western blots (n = 3). ─, normal degradation; +, partial block; ++, strong block; n/a, not mutated. (E) Heat map showing Ypq1-GFP degradation in the presence of Ssh4 mutants. Degradation-blocking mutants are noted as "Hits." Ssh4 mutants that had low expression levels or were lumenal are also noted. (F) Helical wheel of Ssh4 TM showing residues conferring a strong block when mutated to Ala or Trp. (G) Predicted structure of Ssh4 TM showing critical residues (red).
Figure S4.
Degradation analysis of Ypq1 TM5 and TM7 Ala scanning mutants. Related to Fig. 3. (A–C) Heat map showing the degradation defect of all Ypq1 mutants. Mutants with at least 80% (*) or 90% (**) FR scores are highlighted. (D) Top: Degradation of Ypq1 TM5 Ala mutants before (0 h) or after (6 h) Lys starvation. WT and L218A are nonblocking controls. Bottom: Quantification (±SD, n = 2). (E) Top: Degradation of Ypq1 TM7 Ala mutants before (0 h) or after (6 h) Lys starvation. WT and F287A are nonblocking controls. Bottom: Quantification (±SD, n = 2).
Figure 3.
Mutagenesis scanning confirms the importance of TM5 and TM7 in Ypq1 degradation. (A) Heat map showing the degradation defect of strong blocking Ypq1 mutants (cutoff = 90%). (B) Number of residues within TM5, TM7, and TM3 that conferred a strong degradation block when mutated to Ala. (C) Subcellular localization of Ypq1-GFP mutants after 6 h Lys starvation. WT, L218A, and F287A are positive degradation controls. Scale bar, 2 µm. (D) Helical wheel projections of Ypq1 TM5, TM7, and TM3 showing residues that blocked degradation when mutated to Ala (red).
Scanning mutagenesis identified critical residues in the transmembrane helix of Ssh4
Next, we looked into the role of Ssh4 in Ypq1 degradation. Ssh4 is a 579-residue, type I transmembrane protein localized on the vacuole membrane. It has a lumenal N-terminal domain that is predicted to be 46 residues long, followed by a 23-residue transmembrane helix (residues 47–69) and a large 510-residue cytosolic region. The cytosolic region contains important protein–protein interaction domains, including two PPxY motifs that directly bind Rsp5 (Léon et al., 2008) and a conserved SPla/RYanodine receptor (SPRY) domain that can act as a scaffold in protein–protein interaction (D’Cruz et al., 2013; Woo et al., 2006).
While it is likely that Ssh4 simultaneously uses several regions to recognize Ypq1, we wanted to test the possibility that its transmembrane helix plays a functional role. First, we designed a competition assay (Fig. 4 A). We constructed Ssh4NT, a truncated version that contains only the N-terminal tail and the transmembrane helix. We retained the N-terminal tail because it contains the signal peptide that directs the protein into the secretory pathway. Using this arrangement, Ssh4NT localized properly on the vacuole membrane (Fig. S5 A). We reasoned that if the transmembrane helix of Ssh4 interacts with Ypq1, then Ssh4NT should compete with endogenous Ssh4. As shown in Fig. 4 B, overexpressing Ssh4NT under the control of the GPD1 promoter outcompeted endogenous Ssh4 and delayed Ypq1-GFP degradation. In contrast, under the low-expression CPY promoter, Ssh4NT did not affect Ypq1-GFP degradation kinetics. These data support a model wherein Ssh4 uses its transmembrane helix to interact with Ypq1.
Figure S5.
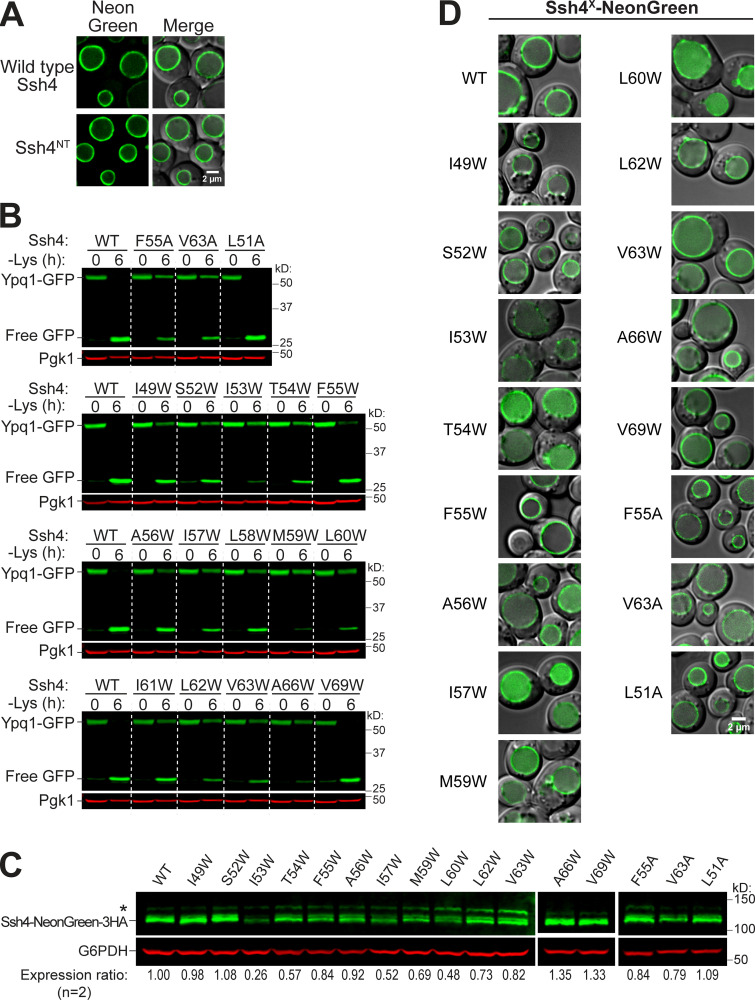
Expression and localization of Ssh4 mutants. Related to Fig. 4. (A) Subcellular localization of NeonGreen-3HA-tagged WT Ssh4 and Ssh4NT. Scale bar, 2 µm. (B) Ypq1-GFP degradation when combined with representative Ssh4 Ala (A) or Trp (W) mutants. Quantification shown in Fig. 4 C. (C) Protein levels of NeonGreen-3HA-tagged Ssh4 mutants. G6PDH, loading control; *, nonspecific band. (D) Subcellular localization of NeonGreen-3HA-tagged Ssh4 mutants. Scale bar, 2 µm.
To further test the importance of the transmembrane helix, we performed Ala scanning mutagenesis and measured the impact on Ypq1-GFP degradation. Using Western blot, we found that F55A and V63A caused a strong block, which was defined as the ability to stabilize >50% of full-length Ypq1-GFP (Fig. 4 C and Fig. S5 B). In addition, seven other mutations, namely L48A, S50A, T54A, I57A, L58A, L60A, and V69A, conferred a partial block (Fig. 4 D, blue). We ruled out the possibility that F55A and V63A caused a strong block because they are not expressed or are mislocalized.
By Western blot and imaging, we confirmed that these mutants expressed to near-WT levels and localized on the vacuole membrane (Fig. S5, C and D). Therefore, F55 and V63 are indeed important in recognizing Ypq1-GFP, and disrupting these residues would block its degradation.
We also performed Trp scanning, a common strategy used to define helical packing interfaces in membrane proteins (Hong and Miller, 2000; Sharp et al., 1995). Compared with Ala, a bulky hydrophobic residue such as Trp would more effectively disrupt tight transmembrane helix packing between protein complexes (Lemmon et al., 1992; Tsai et al., 2016). Through this method, we identified a larger set of critical residues (I49, S52, I53, T54, I57, M59, L60, L62, V63, and A66; Fig. 4, C–E). Among these, six mutants (I49W, S52W, M59W, L62W, V63W, and A66W) expressed to near-WT levels and localized on the vacuole membrane, whereas four others (I53W, T54W, I57W, and L60W) were either expressed at low levels or mislocalized in the vacuole lumen (Fig. S5, C and D). These last mutations conferred a block in degradation likely because they were unstable. Thus, it is inconclusive if these particular residues are critical for Ypq1 recognition. Regardless, our results strongly support the importance of the Ssh4 TM in recognizing Ypq1.
We noticed a periodicity in the positions of intolerant residues, that is, strong defects occurred three or four residues apart from each other. For instance, I49 is three residues apart from S52, which in turn is three residues apart from F55, followed by M59, L62/V63, and A66. When mapped on a helical wheel and a 3D model, this periodicity becomes more evident as the critical residues cleanly segregated to one face of the TM (Fig. 4, F and G).
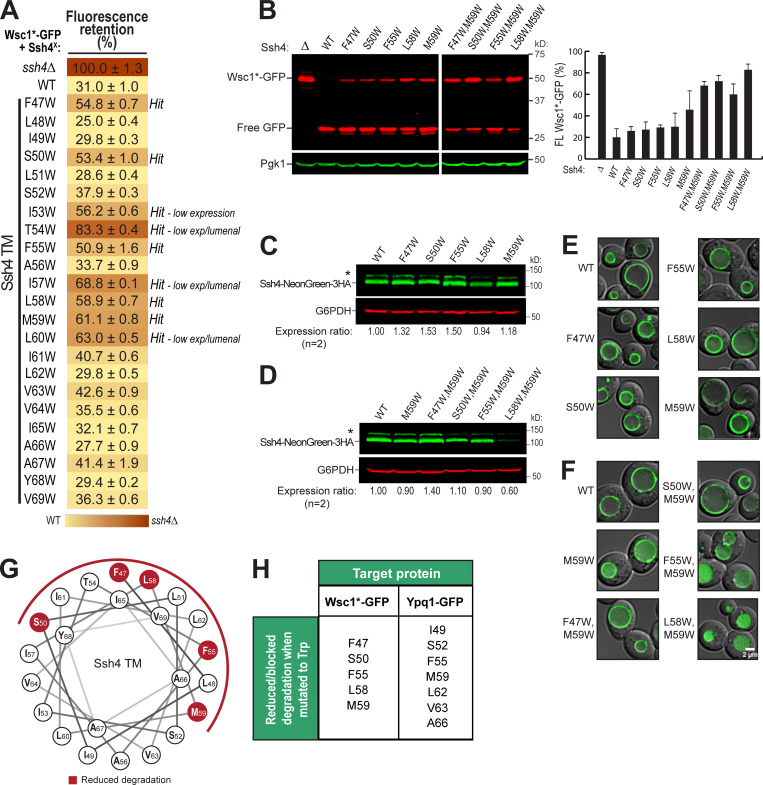
Next, we asked if the Ssh4 TM helix is also important in recognizing other known Rsp5-Ssh4 cargoes. Ssh4 has been implicated in vacuole membrane quality control, recognizing mislocalized plasma membrane proteins, such as the cell wall integrity sensor Wsc1, for degradation (Sardana et al., 2019). We tested Wsc1-EQSPLL-GFP (hereafter, Wsc1*-GFP), which harbors an artificial di-leucine motif that mistargets it to the vacuole membrane and causes it to be constitutively degraded via Ssh4 (Fig. S6). We found that mutating F47, S50, F55, L58, or M59 on Ssh4 TM to Trp reduced Wsc1*-GFP degradation (Fig. S6, A and B), whereas double mutants conferred a more robust block (Fig. S6 B). This suggests that the TM helix of Ssh4 is also important for recognizing other membrane proteins. When mapped on a helical wheel, we found that residues involved in Wsc1*-GFP degradation occur on a different face compared with those that are important for Ypq1-GFP (Fig. S5, G and H; and Fig. 4 F). This suggests that Ssh4 potentially uses different sets of residues on its TM helix to recognize various cargoes.
Figure S6.
The Ssh4 transmembrane domain is important in Wsc1*-GFP degradation. Related to Fig. 4. (A) Flow cytometry heat map showing the degradation defect on Wsc1-EQSPLL-GFP (hereafter, Wsc1*-GFP) imparted by Ssh4 transmembrane domain mutants (cutoff = 50%). Degradation-blocking mutants are noted as "Hits." Ssh4 mutants that had low expression (low exp) levels or were lumenal are also noted. (B) Left: Western blot showing degradation of Wsc1*-GFP in the presence of single-residue and double-residue Ssh4 mutants. Right: Quantification (±SD, n = 3). (C and D) Protein levels of NeonGreen-3HA-tagged single-residue and double-residue Ssh4 mutants. (E and F) Subcellular localization of NeonGreen-3HA-tagged single-residue and double-residue Ssh4 mutants. Scale bar, 2 µm. (G) Helical wheel showing the position of residues conferring partial degradation block when mutated to Trp. (H) Summary of Ssh4 TM residues that reduce/block Wsc1*-GFP or Ypq1-GFP degradation when mutated to Trp.
Together, our results support an important role for the Ssh4 TM in mediating possible helical packing interactions with Ypq1 and other targets. We next asked whether this helix could interact with Ypq1 TM5 and TM7.
Charge complementation supports a transmembrane interaction between Ypq1 and Ssh4
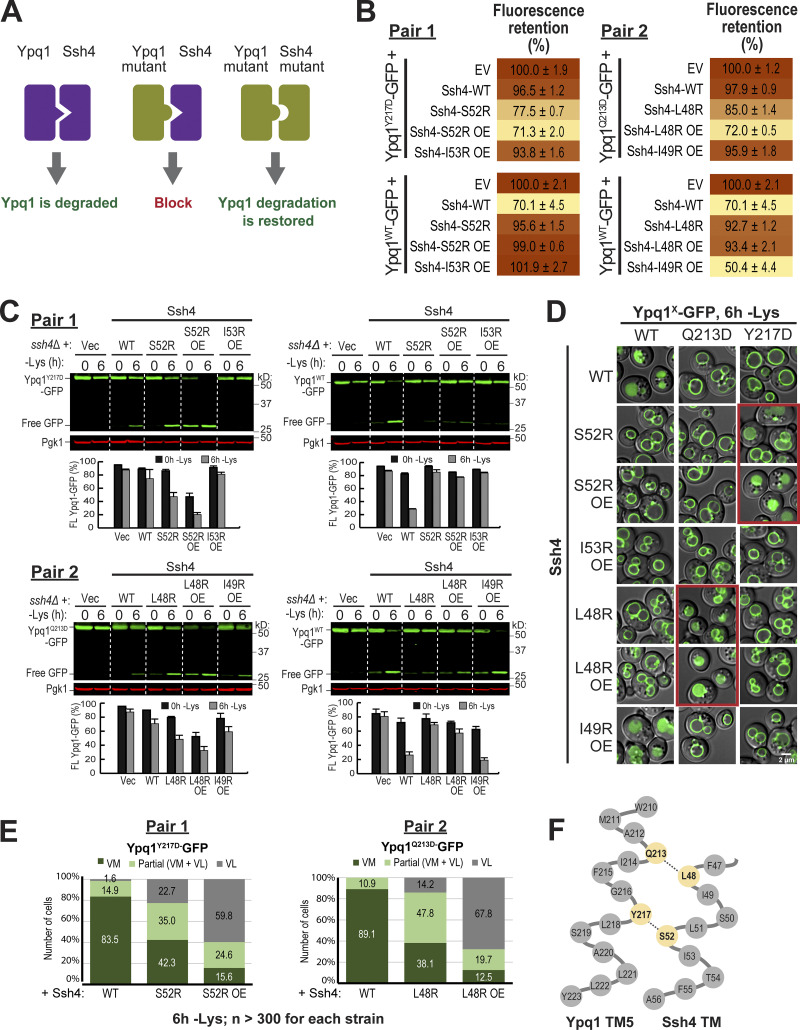
To test whether Ypq1 TM5 or TM7 directly binds to Ssh4 TM, we undertook a genetic approach (Forsburg, 2001). We mutated one residue at the putative interface on Ypq1 to Asp, and the opposite residue on Ssh4 to Arg (Fig. 5 A). Due to their charged side chains, Asp or Arg could potentially perturb the hydrophobic binding interface (Brender and Zhang, 2015). However, simultaneous introduction of both Asp and Arg would be tolerated by forming a salt bridge, provided that both residues are sufficiently close to each other, i.e., within 4 Å (Donald et al., 2011; Kumar and Nussinov, 2002).
Figure 5.
Charge complementation pairs support a transmembrane interaction between Ypq1 and Ssh4. (A) Conceptual model of charge complementation. (B) Flow cytometry–based quantification of Ypq1-GFP degradation within complementation pairs. EV, empty vector; OE, overexpression. (C) Top: Degradation of Ypq1-GFP within complementation pairs. Bottom: Quantification (±SD, n = 3). Vec, empty vector. (D) Subcellular localization of Ypq1-GFP coexpressed with Ssh4 mutants after 6 h Lys starvation. Scale bar, 2 µm. (E) Cell counts from D. No degradation (VM, vacuole membrane); complete degradation (vacuole lumen, VL); partial degradation (partial, VL + VM). n > 300 for each strain. (F) A model of the binding interface between Ypq1 TM5 and Ssh4 TM.
We tested different combinations of critical residues identified by the suppressor screen and scanning mutagenesis. Using flow cytometry (Fig. 5 B, Pair 1), we discovered that mutating Y217, a residue on Ypq1 TM5, to Asp substantially weakened its degradation, acquiring an FR score of 96.5% (Fig. 5 B, Pair 1, top). Meanwhile, mutating S52 on Ssh4 TM to Arg caused a similar block (95.6% FR score; Fig. 5 B, Pair 1, bottom). Remarkably, coexpressing both mutants partially restored the degradation, bringing the FR score to 77.5%. This complementation was further enhanced by overexpressing Ssh4S52R, which brought the FR score to 71.3%, similar to the WT control.
Similar results were seen via Western blot, wherein only the Ypq1Y217D-Ssh4S52R pairs showed significant degradation (Fig. 5 C, Pair 1, left). Notably, degradation of full-length Ypq1Y217D-GFP and accumulation of free GFP occurred more strongly in −lysine conditions. Conversely, no complementation was observed in +lysine conditions, unless Ssh4S52R was overexpressed. The crux of this assay is that charge complementation would only occur if the mutated residues were close to each other. Therefore, these results suggest that Ypq1Y217 can come in contact with Ssh4S52 only when lysine is not present, possibly due to an increase in accessibility. Furthermore, increasing Ssh4S52R levels somehow also increases the chance to access these sites.
We also mutated I53, an adjacent residue, to Arg. Unlike Ssh4S52R, however, Ssh4I53R did not rescue Ypq1Y217D even after overexpression. Although I53 is next to S52 in the protein sequence, its side chain faces 100° away in the α-helix (Fig. 4 F), and thus it is unlikely to participate in the binding to Ypq1. Other residues (i.e., A46, T54, and F55) that are facing away from the putative interface also did not restore Ypq1Y217D degradation (data not shown).
Similarly, we saw an increased sorting of Ypq1Y217D-GFP to the vacuole lumen when it was coexpressed with Ssh4S52R under lysine starvation conditions. Sorting increased further upon overexpression of Ssh4S52R in both lysine-replete and lysine-starved conditions (Fig. 5, D and E). The observed complementation implies that Ypq1Y217 and Ssh4S52 occur at a close distance to each other and likely interact, suggesting that these residues are transmembrane-binding sites.
Next, we set out to find other interacting residues. We observed that Ypq1Q213 and Ssh4L48 also formed a successful charge complementation pair (Fig. 5, B–E, Pair 2). These two residues are both one turn above Ypq1Y217 and Ssh4S52, respectively (Fig. 5 F). Similar to Ypq1Y217D-Ssh4I53R, we found that Ypq1Q213D could not be rescued by Ssh4I49R, because I49 is facing 100° away from the binding interface.
In summary, our charge complementation experiments argue strongly that Ypq1Y217/Q213 are within the immediate vicinity of Ssh4S52/L48 upon lysine withdrawal and are likely forming the binding site (Fig. 5 F).
The PQ motifs regulate the accessibility of the Ypq1 binding site
The increase in charge complementation under lysine starvation suggests that lysine influences binding site availability. During substrate transport, transporters cycle between the inward-open, occluded, and outward-open conformations to move substrates across the membrane (Drew and Boudker, 2016). We asked whether these conformational changes in Ypq1 could have an effect on the accessibility of its critical residues.
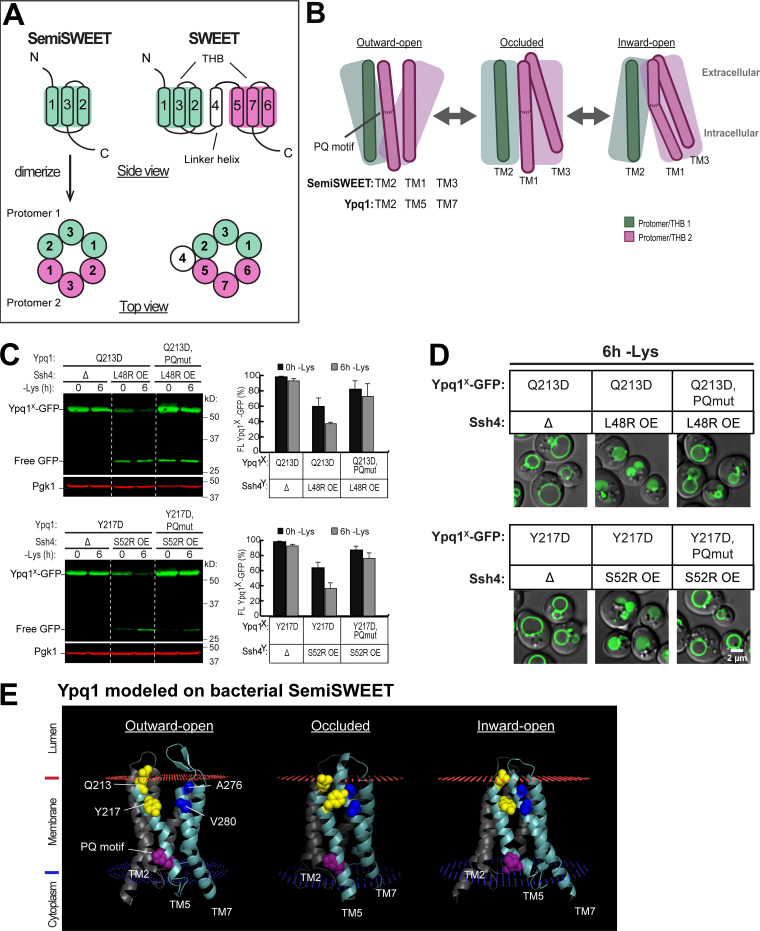
Among the PQ-loop family, only bacterial SemiSWEET has so far been crystallized in all three conformations (Latorraca et al., 2017; Lee et al., 2015; Xu et al., 2014). Of note, a major difference between eukaryotic SWEETs and prokaryotic SemiSWEETs is the number of their TMs (Feng and Frommer, 2015). Bacterial SemiSWEETs contain only three TMs, and need to homodimerize to form a functional transporter (Fig. 6 A). Eukaryotic SWEETs, on the other hand, evolved via duplication and acquired an additional TM that functions as a linker helix. Therefore, one monomer of eukaryotic SWEET is equivalent to two monomers of bacterial SemiSWEET (Fig. 6 A).
Figure 6.
Ypq1 and Ssh4 transmembrane interaction is regulated by the PQ motif. (A) Architecture of prokaryotic SemiSWEET and eukaryotic SWEETs, which are the most well-studied members of the PQ-loop protein family. SemiSWEET protomers and SWEET THBs are colored in pink and green. (B) Cartoon showing key helices in SemiSWEET transitioning from the outward-open to occluded to inward-open conformations. TM1 and TM3 in the second protomer of the SemiSWEET transporter unit corresponds to TM5 and TM7, respectively, in Ypq1. Major helical movements are influenced by the PQ motif. (C) Left: The effect of PQ motif mutation on Ypq1-GFP complementation pairs. Right: Quantification (±SD, n = 3). OE, overexpression. PQmut, P229S,Q230R. (D) The effect of PQ motif mutation on Ypq1-GFP subcellular localization. Scale bar, 2 µm. (E) Predicted structure of Ypq1 modeled on three conformations of SemiSWEET. Membrane interfaces are shown in red and blue, as predicted by the Positioning of Membranes in Proteins server (https://opm.phar.umich.edu/ppm_server).
Crystal structure studies on SemiSWEET revealed that conformational cycling during transport is partly controlled by the PQ motif, which acts as a molecular hinge enabling “binder clip–like” motions of the transporter (Fig. 6 B; Latorraca et al., 2017; Lee et al., 2015). Its PQ motif is on TM1, which corresponds to TM1 and TM5 on eukaryotic PQ-loop proteins. These TMs would always kink at Pro if not for the adjacent Gln. When SemiSWEET is in the outward-open conformation, the Gln in the PQ motif forms hydrogen bonds with residues at the intracellular end of TM2 of the other protomer. This causes TM1 to straighten and move toward TM2, facilitating the opening of an extracellular gate (Fig. 6 B). As SemiSWEET transitions to the occluded state, both gates close due to the movement of TM3 toward TM1. Finally, at the inward-open conformation, the hydrogen bond formed by Gln is released, and TM1 kinks at Pro, accompanied by a tilt of TM3 to open the intracellular gate. Thus, the PQ motif regulates the transition from one conformation to another (Lee et al., 2015).
We hypothesized that these movements are conserved in Ypq1, and asked if transport-associated conformation changes regulated by the PQ motif influence Ypq1 degradation. The isolation of 10 PQ suppressor mutants strongly supports this hypothesis (Fig. 2 and Table S1). As a further test, we asked if charge complementation can still occur between Ypq1Q213D and Ssh4L48R if the PQ motif on TM5 is mutated. P229Q230 was mutated to S229R230 based on the isolation of these mutants from the suppressor screen (Fig. 2 B and Table S1). We found that by mutating P229Q230, charge complementation can no longer occur between Ypq1Q213D-GFP and Ssh4L48R (Fig. 6, C and D). Similarly, Ssh4S52R no longer complemented Ypq1Y217D, PQmut-GFP. These results suggest that disrupting the hinge function of the PQ motif prevents the binding sites from coming into contact with Ssh4.
How does the PQ motif influence the accessibility of Q213 and Y217? To visualize Ypq1 conformational changes, we modeled Ypq1 onto known structures of PQ-loop proteins at different stages of transport. As stated above, only bacterial SemiSWEETs have been crystallized in all three conformations, and thus we shifted to use them as templates for analysis. We modeled the outward-open and inward-open structures on Escherichia coli SemiSWEETs (Protein Data Bank IDs 4x5n and 4x5m, respectively; Lee et al., 2015), while the occluded state was modeled on Leptospira biflexa SemiSWEET (4qnc; Xu et al., 2014). We observed that TM5 is straightened in the outward-open and occluded models, and is kinked at the PQ motif in the inward-open model (Fig. 6 E). More importantly, these models provide an idea on the positioning of Q213 and Y217. In the occluded and inward-open models, Q213 and Y217 are packed more closely onto residues A276 and V280 on TM7. In contrast, Q213 and Y217 seem to lose contact with TM7 in the outward-open model. This suggests that, indeed, the transmembrane binding sites on Ypq1 are exposed to different extents during transport.
Together, we showed that the PQ motif is important in Ypq1 degradation, and mutating it causes Ypq1 to lose contact with Ssh4. Furthermore, the large movements seen via modeling suggest that the PQ motif, through its role in coordinating transport-associated conformation changes, could influence transmembrane binding site positioning.
Discussion
Formation of transmembrane binding site between Ypq1 and Ssh4
Selective degradation of membrane proteins in response to different cellular cues is essential in maintaining homeostasis. To do so, the cell utilizes E3 ligases to precisely ubiquitinate individual proteins. How is this selectivity achieved? Here, we report a transmembrane recognition mechanism employed by Ssh4 to recognize its target Ypq1. Our study is novel because many previous studies on Rsp5 and its adaptors have shown only cytosolic interactions with their targets (Crapeau et al., 2014; Gournas et al., 2017; Guiney et al., 2016; Keener and Babst, 2013; Sardana et al., 2019; Savocco et al., 2019).
Using an unbiased suppressor screen, we identified critical domains in Ypq1 degradation. While the identification of Loop1-2 mutations suggested a possible cytosolic interaction, the majority of the suppressors were on transmembrane domains, including PQ motifs, TM5, and TM7. Therefore, we focused on elucidating the transmembrane aspect of this interaction, and proposed that TM5 and TM7 in Ypq1 form a binding pocket for the transmembrane helix of Ssh4. Further scanning mutagenesis and coIP studies strengthened this hypothesis. More importantly, by charge complementation, we demonstrated that two residues on TM5 (i.e., Q213 and Y217) likely form contact with L48 and S52 of the Ssh4 TM upon lysine starvation (Fig. 7 A).
Figure 7.
Model of transmembrane interaction between Ypq1 and Ssh4 after Lys starvation. (A) Lys starvation-mediated recognition of Ypq1 relies on Ypq1 TMs 5 and TM7 and Ssh4 TM. Transmembrane interaction occurs at a site that includes the identified critical residues. (B) Proposed model for Ypq1 recognition. When Lys is present, constant conformation cycling of Ypq1 prevents the stable exposure of its transmembrane recognition sites. Absence of Lys arrests Ypq1 in a conformation recognized by Ssh4 and leads to Ypq1 degradation.
Notably, although we identified TM7 to be important (Fig. 2), we were unable to pinpoint critical and complementing residues in this region (data not shown). Issues encountered include a lack of blocking when residues on TM7 were mutated to Asp, as well as difficulties in finding complementing Ssh4 Arg mutants. These data suggest that TM5 directly interacts with the Ssh4 TM, while TM7 may act as a structural support.
Transport-associated conformational changes transiently display the binding site
When we modeled Ypq1 at the inward-open, occluded, and outward-open conformations, we observed major movements at the Q213 and Y217 binding site (Fig. 6 E). Ssh4 likely captures these sites during at least one but not all conformations. We propose that the accessibility of these sites is regulated because Ypq1 degradation happens only after lysine withdrawal. This suggests that the binding site is either hidden or is too dynamic to be captured by Ssh4 in +lysine conditions. Interestingly, we noticed that overexpressing Ssh4 caused a partial degradation of Ypq1 in the presence of lysine (Fig. 1, E and F). This phenomenon also occurred in the charge complementation experiments (Fig. 5 C). This observation suggests that the recognition site is transiently exposed even in the presence of Lys, and by overexpressing Ssh4, the chance of capturing the briefly exposed binding site is increased. We propose that this brief exposure is likely caused by conformational changes repeatedly occurring during active lysine transport (Fig. 7 B).
Based on studies on other PQ-loop family members, conformation cycling and transport are in part controlled by the PQ motif. Mutating the PQ motif has been shown to reduce transport in bacterial SemiSWEET, Caenorhabditis elegans LAAT-1, human PQLC2, and yeast Ypq2 (Kawano-Kawada et al., 2019; Latorraca et al., 2017; Lee et al., 2015; Liu et al., 2012). In L. biflexa SemiSWEET, mutating Gln of the PQ motif stabilized the protein in the inward-open conformation, enabling crystal formation (Latorraca et al., 2017). No structural data are available for Pro or double mutants. In our study, the PQ motif plays an important role in controlling Ypq1 degradation. Mutating the PQ motif caused a major block in the degradation of Ypq1, suggesting that Ypq1 is stabilized in a conformation no longer recognizable to Ssh4. Our models suggest that the outward-open conformation exposes the Q213 and Y217 binding sites the most, because these residues do not pack with TM7. At the moment, we can only propose that Ssh4 recognizes Ypq1 in one conformation and ignores it in the opposite conformations. Biophysical evidence and further experimentation are necessary to determine the identity of these conformations.
Lysine withdrawal stabilizes the binding site formation
Although active lysine transport is coupled to conformation changes that antagonize Ssh4 recognition, lysine starvation may stabilize Ypq1 in a conformation that favors the recognition. In a previous study, Ypq1 was identified to be an H+/lysine antiporter, which uses the proton gradient of the vacuole to import lysine from the cytosol (Sekito et al., 2014). During proton-coupled transport, the conformation changes are regulated by the simultaneous binding of protons and substrates (Smirnova et al., 2011; Verdon et al., 2014). As such, a proton and substrate must both be present to initiate transporter movement. Because H+ is in constant supply from the vacuole lumen, a limiting factor for Ypq1 transport is the amount of lysine in the cytosol. Therefore, after lysine starvation, Ypq1 is likely arrested in one of the three conformations while it waits to bind lysine. This might increase the chance for Ssh4 to interact with the exposed recognition sites and facilitate Ypq1 degradation (Fig. 7 B). Such a responsive mechanism is important for shutting down unnecessary lysine import into the vacuole when the cytosolic lysine concentration is low.
Altogether, our study provides a detailed characterization of transmembrane interactions between Ssh4 and its target in response to substrate starvation. The sensing of nutrient signals and how they translate into recognizable structural changes provide an appealing mechanism to explain E3 ligase selectivity. Of course, what we found here is likely only one cog in a multi-faceted regulation. For example, the isolation of suppressor mutants in the Loop1-2 region suggested a role for cytosolic interactions. Transmembrane events within PQ-loop proteins may also drive cytosolic interactions with their binding partners that are not necessarily embedded in the membrane, such as the interaction between PQLC2 and the cytosolic C9orf72 complex that can be abolished by mutations in the PQ motif (Amick et al., 2020). Last, our mutagenesis of Ypq1 and Wsc1* reveal a possibility that Ssh4 assigns different regions in its TM helix to recognize various transmembrane targets. This allows Ssh4 to achieve both specificity and range, consistent with its role as an E3 adaptor for a wide range of cargoes. Future studies will help address these interesting questions.
Materials and methods
Yeast strains, plasmids, media, and growth conditions
All yeast strains and plasmids used in this study are listed in Table S2 and Table S3. Yeast Extract–Peptone–Dextrose (YPD) broth and yeast nitrogen base (YNB) without amino acids were purchased from Sigma-Aldrich. Amino acids were added to YNB media, except those required for selection. All yeast strains were grown at 28°C in YNB dropout media or YPD before further analysis. For Lys starvation experiments, cells were grown in YNB dropout media to mid-log phase (OD600: 0.5–0.8) and then collected at 14,000 g for 5 min. Cells were washed twice with Milli-Q water, resuspended in YNB media lacking Lys, and incubated at 28°C for the indicated length of time (2, 4, or 6 h) before being collected for further analysis.
Microscopy and image processing
Microscopy was performed with a DeltaVision Elite system (GE Healthcare Life Sciences), equipped with an Olympus IX-71 inverted microscope, a scientific Complementary Metal-Oxide Semiconductor (sCMOS) camera, a 100×/1.4 Oil Super-Plan Apochromatic objective, and a DeltaVision Elite Standard Filter Set with the FITC filter (Excitation:475/28, Emission:525/48) for mNeonGreen and GFP. Image acquisition and deconvolution were performed in the program Softworx. Before imaging, cells were washed briefly in water, then imaged at room temperature suspended in Milli-Q water. ImageJ was used for image adjustment and cropping.
Western blot and antibodies
Total cell lysates were prepared from seven OD600 cultures. They were incubated on ice for at least 30 min in 10% TCA, followed by one wash with 0.1% TCA. They were subsequently bead-beaten for 5 min in 2× urea buffer (150 mM Tris, pH 6.8, 6 M urea, 6% SDS, 10% glycerol, and 100 mM DTT) and incubated for 5 min at 42°C, then bead-beaten in 2× sample buffer (50 mM Tris, pH 7.5, 6 M urea, 10 mM EDTA, 2% SDS, 100 mM DTT, and bromophenol blue) and again incubated for 5 min at 42°C. Samples were centrifuged at 14,000 g for 5 min, and the supernatant was collected. Samples were separated via electrophoresis on 11% polyacrylamide gels, then transferred to nitrocellulose membranes for analysis via Western blot.
Using LI-COR Image Studio, the fluorescence signal of FL Ypq1-GFP and free GFP were measured. FL Ypq1-GFP (%) was quantified by dividing FL Ypq1-GFP by the total GFP signal (FL Ypq1-GFP + free GFP).
Antibodies used in this study were rabbit anti-G6PDH (1:15,000 dilution; A9521; Sigma-Aldrich), mouse anti-GFP (1:500; SC9996; Santa Cruz Biotechnology, Inc.), rabbit anti-GFP (1:2,500; TP401; Torrey Pines Biolabs), mouse anti-Pgk1 (1:5,000; 459250; Invitrogen), and mouse anti-HA (1:1,000; 901502; BioLegend). To produce anti-Ssh4, the cytosolic domain of Ssh4 was tagged with 6xHis and Small Ubiquitin-like Modifier (SUMO; 6xHis-SUMO-Ssh4) and affinity-purified using TALON cobalt resin (635502; TaKaRa Bio). An antibody against this construct was raised in rabbit by Covance Laboratories Inc. Antibody was purified from serum by affinity purification, using 6xHis-SUMO-Ssh4 coupled to CnBr-activated sepharose resin (17098101; GE Healthcare Life Sciences). Secondary antibodies used were green goat anti-rabbit (1:10,000; 926–32211; LI-COR Biosciences), red goat anti-rabbit (1:10,000; 926–68021; LI-COR Biosciences), green goat anti-mouse (1:10,000; 926–32210; LI-COR Biosciences), and red goat anti-mouse (1:10,000; 926–68020; LI-COR Biosciences).
For Wsc1*-GFP samples, cell lysates were prepared using the PNGase F buffer system (P0704S; New England Biolabs). Seven OD600 cultures were lysed in 70 µl Glyco master mix (1× GlycoBuffer 2 [equivalent to 50 mM sodium phosphate, pH 7.5], 1% NP-40, and 1× Protease Inhibitor Cocktail). Cells were bead-beaten for 5 min at 4°C, rested on ice for 5 min, and bead-beaten again for 5 min at 4°C. Samples were centrifuged at 12,000 rpm, 4°C, for 5 min, and the supernatant was collected. 10 µl supernatant was mixed with 10 µl sample buffer (50 mM Tris, pH 7.5, 6 M urea, 10 mM EDTA, 2% SDS, 100 mM DTT, and bromophenol blue) and incubated for 5 min at 65°C. Samples were separated via electrophoresis on 11% polyacrylamide gels, then transferred to nitrocellulose membranes for analysis via Western blot. Single bands of Wsc1*-GFP were achieved by using this combination of antibodies: rabbit anti-GFP (1:2,500; TP401; Torrey Pines Biolabs), mouse anti-Pgk1 (1:1,000; 459250; Invitrogen), red goat anti-rabbit (1:10,000; 926–68021; LI-COR Biosciences), and green goat anti-mouse (1:10,000; 926–32210; LI-COR Biosciences).
Homology modeling and structure prediction
The predicted structure of Ypq1 was determined via the homology modeling server SWISS-MODEL (https://swissmodel.expasy.org; Waterhouse et al., 2018). The protein sequence of Ypq1 was uploaded, and models were generated using the Automated Mode, which automatically selects template crystals based on sequence homology. For Ypq1 (Fig. 1), OsSWEET2b (PDB ID: 5cth.1.B; Tao et al., 2015) ranked highest based on Global Model Quality Estimation (GMQE) and sequence coverage and was used as a template for modeling. For Fig. 6, Ypq1 was modeled on E. coli SemiSWEET in the inward-open and outward-open conformations using crystals 4x5m.1 and 4x5n.2 (Lee et al., 2015), respectively. The occluded conformation was modeled on L. biflexa SemiSWEET crystal 4qnc (Xu et al., 2014).
The structure of the Ssh4 TM was modeled using i-TASSER (https://zhanglab.ccmb.med.umich.edu/I-TASSER; Roy et al., 2010; Yang et al., 2015) due to lack of sufficient sequence homologues. The protein sequence of Ssh4 from residues 1 to 69 was uploaded, and the model that showed a plausible α-helix structure was chosen.
All PDB files were visualized using VMD (http://www.ks.uiuc.edu/Research/vmd; Humphrey et al., 1996).
Evolutionary covariation analysis
The predicted structure of Ypq1 was validated using GREMLIN (http://gremlin.bakerlab.org; Kamisetty et al., 2013; Ovchinnikov et al., 2014). The protein sequence was uploaded and aligned to 420 related sequences in eukaryotes. The conserved residues were then mapped on the Ypq1 predicted structure. As would be expected from a valid structure, conserved residues clustered together (Ovchinnikov et al., 2015).
Other transmembrane protein software tools
The boundaries of transmembrane helices in Ypq1 and Ssh4 primary sequences were predicted using TMHMM Server v. 2.0 (http://www.cbs.dtu.dk/services/TMHMM; Krogh et al., 2001; Sonnhammer et al., 1998). Results for Ypq1 were further adjusted based on the homology-modeled structure. Helical wheel projections were generated using NetWheels (http://lbqp.unb.br/NetWheels; Mol et al., 2018). Membrane interfaces were predicted by uploading PDB models to the Positioning of Membranes in Proteins server (https://opm.phar.umich.edu/ppm_server; Lomize et al., 2012).
PCR-mediated mutagenesis
Random mutagenesis was done via error-prone PCR. YPQ1 coding sequence fragments were amplified from plasmids expressing pSSH4::YPQ1X-GFP-URA3 (where x = S14D, L70D, or M73D) using Taq polymerase from TaKaRa Bio (R001). Primers used were pSSH4-forward (5′-GAACGCTTGTTTGTTCTCGTCAC-3′) and GFP-reverse (5′-GTACATAACCTTCGGGCATGGCAC-3′). To enhance the error rate, concentrations of dNTPs were modified as follows: 0.4 mM dCTP, 0.4 mM dTTP, 0.08 mM dATP, and 0.08 mM dGTP. Additionally, 0.2 mM MnCl2 was added to the PCR mixture.
Site-directed mutagenesis was performed with Novagene KOD Hot-Start DNA polymerase (71086; MilliporeSigma).
Suppressor screening
Random mutagenesis PCR was used to amplify Ypq1 containing S14D, L70D, or M73D, then run in an agarose gel, excised, and purified. The resulting fragment and the Ypq1-GFP-Ura3 plasmid digested with NheI (R3131; New England Biolabs) and PacI (R0547; New England Biolabs) were transformed together into yeast and plated onto YNB plates lacking uracil. After 2 d, colonies were individually selected and grown in YNB media lacking uracil. Localization of Ypq1-GFP was determined via microscopy. The plasmid DNA was purified and transformed into E. coli and plated onto Luria broth (LB) plates with ampicillin. After 1 d, individual colonies were selected and grown in LB medium with ampicillin. Plasmid DNA was purified and retransformed into yeast to confirm its suppressor phenotype before being sequenced. Genuine suppressors were decided as follows: mutation frequencies were ranked, and those that appeared at least twice in VM-localized mutants were considered for analysis. Mutations that appeared in single-residue mutants were also considered for analysis.
Flow cytometry
Cells were grown overnight in YNB dropout media. At mid-log, cells were collected, washed twice with Milli-Q H2O, and divided into two fractions. One fraction was transferred to YNB dropout medium containing Lys, while the second fraction was transferred to YNB dropout medium without Lys. Both were incubated with shaking at 28°C for 6 h. 200 μl of cells were then pipetted into a 96-well plate. Flow cytometry was done using an iQue Screener PLUS flow cytometer (Intellicyt), and data were analyzed using ForeCyt.
Two experimental setups were optimized (see Fig. S2 for details). In setup 1, Ypq1-GFP or its mutants were expressed in a plasmid and transformed into SEY6210 yeast. Here, SEY6210 + Ypq1-GFP is the positive control, whereas SEY6210 ssh4Δ + Ypq1-GFP is the negative control. In setup 2, Ssh4 or its mutants were expressed on a plasmid and transformed to SEY6210 ssh4Δ yeast, where Ypq1 was chromosomally tagged with GFP. Here, SEY6210 ssh4Δ Ypq1-GFP + Ssh4 is the positive control, whereas SEY6210 ssh4Δ Ypq1-GFP + empty vector is the negative control. In both setups, a no fluorescence control was included, i.e., SEY6210 ssh4Δ + empty vector.
Ypq1-GFP degradation was quantified as follows: singlets were gated, and median GFP fluorescence was measured from each well. Average fluorescence was calculated from three replicates and was corrected by subtracting the fluorescence value of the no fluorescence control. Next, FC in the absence of Lys was calculated by dividing the corrected average fluorescence (CAF) of cells in –Lys by the CAF of cells in +Lys. Finally, a FR score was assigned by normalizing the FC value of the mutant with that of the negative control. This method sets the final FR score of the negative control to 100%; all other samples would have a lower score. Essentially, a higher FR score indicates a stronger block of degradation, and scores that approach 100% correspond to a complete block.
CoIP
The coIP method was adapted from Yang et al. (2018), with some modifications. Cells (500 OD600) were grown at 28°C to midlog in synthetic medium, washed with Milli-Q H2O, and starved in 1 liter YNB without Lys for 6 h. After this time, 1,000 OD of cells were harvested, washed with Milli-Q H2O, and incubated in 50 ml weakening buffer (100 mM Tris-HCl, pH 8.8, and 10 mM DTT) to weaken the cell wall. Cells were then resuspended in 25 ml spheroplasting media without Lys (2% glucose, 1× amino acids except Lys, 1 M sorbitol, and 20 mM Tris-HCl, pH 7.5, in YNB) containing 150 µl of 10 mg/ml zymolyase 100T (120493–1; Amsbio) and incubated at 30°C for 30 min with gentle rocking. After washing once with 20 ml spheroplasting media without Lys, cells were resuspended with 20 ml Hepes lysis buffer (20 mM Hepes, pH 7.2, 50 mM KOAc, 10 mM EDTA, and 200 mM sorbitol) supplemented with cOmplete Protease Inhibitor Cocktail (21169500; Roche) and 1 mM PMSF. Cell lysates were prepared by at least 20 strokes of Dounce homogenization on ice. From this, the membrane fraction was collected through a 10-min 15,000 rpm spin (Sorvall SS-34 rotor) at 4°C. Membranes were solubilized by nutating for 30 min at 4°C in 1 ml immunoprecipitation buffer (50 mM Hepes-KOH, pH 6.8, 150 mM KOAc, 2 mM MgOAc, 1 mM CaCl2, 15% glycerol, and 1% Triton X-100). Insoluble material was removed by spinning at 15,000 rpm for 10 min at 4°C. The resulting lysate was incubated at 4°C with 8 µl anti-Ssh4 antibody (1 mg/ml) for 1 h and then incubated with protein A sepharose resin (17–0780-01; GE Healthcare Life Sciences) for 1 h. Afterward, the resin was washed six times with 0.1% Triton X-100 in immunoprecipitation buffer. Finally, bound proteins were eluted by adding 80 µl 2× urea sample buffer (150 mM Tris, pH 6.8, 2% SDS, 100 mM DTT, and bromophenol blue) followed by incubation at 65°C for 5 min. Prepared proteins were then run in an 11% SDS-PAGE gel and probed with the appropriate antibodies.
Online supplemental material
Fig. S1 shows data regarding the validation of the Ypq1 homology model. Fig. S2 shows the workflow and details of the flow cytometry method used in measuring Ypq1-GFP degradation. Fig. S3 shows a coIP of Ypq1 and Ssh4 in near-endogenous conditions. Fig. S4 shows flow cytometry and Western blot data of Ypq1-GFP Ala scanning mutagenesis. Fig. S5 shows the expression and localization of Ssh4 mutants used in this study. Fig. S6 shows the degradation data for Wsc1*-GFP. Table S1 lists the suppressor mutants isolated from the Ura3 screen. Table S2 lists the yeast strains used in this study. Table S3 lists the plasmids used in this study. Video 1 shows the 3D model of Ypq1 in Fig. 1 C. Video 2 shows the 3D model of Ypq1 in Fig. 2 I.
Supplementary Material
lists the suppressor mutants isolated from the Ura3 screen.
lists the yeast strains used in this study.
lists the plasmids used in this study.
Acknowledgments
We thank the members of the Li laboratory, including V. Venkatarangan, W. Zhang, P. Bulinski, G. Chu, A. Kappagantu, L. Reist, and D. Chomchai, for their technical support. We are also grateful to R. Stockbridge, M. Henne, M. Babst, S. Emr, L. Feng, and D. Klionsky for helpful discussion and critical reading of the manuscript.
The flow cytometry analysis was performed at the Center for Chemical Genomics at the University of Michigan Life Sciences Institute. This research is supported by the MCubed, University of Michigan 3.0 fund, a Cystinosis Research Foundation grant (CRFF-2018-005), and a National Institutes of Health grant (R01GM133873 to M. Li).
The authors declare no competing financial interests.
Author contributions: F. Arines, A. Hamlin, and M. Li designed the research and performed most experiments. F. Arines and M. Li wrote the manuscript, with some input from A. Hamlin. Y. Liu helped with the early stage of the project. X. Yang performed part of the charge complementation experiments. M. Li supervised the project and acquired funding.
References
- Amick J., Tharkeshwar A.K., Talaia G., and Ferguson S.M.. 2020. PQLC2 recruits the C9orf72 complex to lysosomes in response to cationic amino acid starvation. J. Cell Biol. 219:e201906076 10.1083/jcb.201906076 [DOI] [PMC free article] [PubMed] [Google Scholar]
- Bonifacino J.S., Cosson P., Shah N., and Klausner R.D.. 1991. Role of potentially charged transmembrane residues in targeting proteins for retention and degradation within the endoplasmic reticulum. EMBO J. 10:2783–2793. 10.1002/j.1460-2075.1991.tb07827.x [DOI] [PMC free article] [PubMed] [Google Scholar]
- Bräuer P., Parker J.L., Gerondopoulos A., Zimmermann I., Seeger M.A., Barr F.A., and Newstead S.. 2019. Structural basis for pH-dependent retrieval of ER proteins from the Golgi by the KDEL receptor. Science. 363:1103–1107. 10.1126/science.aaw2859 [DOI] [PubMed] [Google Scholar]
- Brender J.R., and Zhang Y.. 2015. Predicting the Effect of Mutations on Protein-Protein Binding Interactions through Structure-Based Interface Profiles. PLOS Comput. Biol. 11:e1004494 10.1371/journal.pcbi.1004494 [DOI] [PMC free article] [PubMed] [Google Scholar]
- Crapeau M., Merhi A., and André B.. 2014. Stress conditions promote yeast Gap1 permease ubiquitylation and down-regulation via the arrestin-like Bul and Aly proteins. J. Biol. Chem. 289:22103–22116. 10.1074/jbc.M114.582320 [DOI] [PMC free article] [PubMed] [Google Scholar]
- D’Cruz A.A., Babon J.J., Norton R.S., Nicola N.A., and Nicholson S.E.. 2013. Structure and function of the SPRY/B30.2 domain proteins involved in innate immunity. Protein Sci. 22:1–10. 10.1002/pro.2185 [DOI] [PMC free article] [PubMed] [Google Scholar]
- Donald J.E., Kulp D.W., and DeGrado W.F.. 2011. Salt bridges: geometrically specific, designable interactions. Proteins. 79:898–915. 10.1002/prot.22927 [DOI] [PMC free article] [PubMed] [Google Scholar]
- Drew D., and Boudker O.. 2016. Shared Molecular Mechanisms of Membrane Transporters. Annu. Rev. Biochem. 85:543–572. 10.1146/annurev-biochem-060815-014520 [DOI] [PubMed] [Google Scholar]
- Feng L., and Frommer W.B.. 2015. Structure and function of SemiSWEET and SWEET sugar transporters. Trends Biochem. Sci. 40:480–486. 10.1016/j.tibs.2015.05.005 [DOI] [PubMed] [Google Scholar]
- Fisk H.A., and Yaffe M.P.. 1999. A role for ubiquitination in mitochondrial inheritance in Saccharomyces cerevisiae. J. Cell Biol. 145:1199–1208. 10.1083/jcb.145.6.1199 [DOI] [PMC free article] [PubMed] [Google Scholar]
- Forsburg S.L. 2001. The art and design of genetic screens: yeast. Nat. Rev. Genet. 2:659–668. 10.1038/35088500 [DOI] [PubMed] [Google Scholar]
- Gournas C., Amillis S., Vlanti A., and Diallinas G.. 2010. Transport-dependent endocytosis and turnover of a uric acid-xanthine permease. Mol. Microbiol. 75:246–260. 10.1111/j.1365-2958.2009.06997.x [DOI] [PubMed] [Google Scholar]
- Gournas C., Prévost M., Krammer E.M., and André B.. 2016. Function and regulation of fungal amino acid transporters: Insights from predicted structure. In Yeast Membrane Transport. Advances in Experimental Medicine and Biology. Ramos J., Sychrová H., and Kschischo M., editors. Springer, Cham: 69–106. 10.1007/978-3-319-25304-6_4 [DOI] [PubMed] [Google Scholar]
- Gournas C., Saliba E., Krammer E.-M.M., Barthelemy C., Prévost M., and André B.. 2017. Transition of yeast Can1 transporter to the inward-facing state unveils an α-arrestin target sequence promoting its ubiquitylation and endocytosis. Mol. Biol. Cell. 28:2819–2832. 10.1091/mbc.e17-02-0104 [DOI] [PMC free article] [PubMed] [Google Scholar]
- Guiney E.L., Klecker T., and Emr S.D.. 2016. Identification of the endocytic sorting signal recognized by the Art1-Rsp5 ubiquitin ligase complex. Mol. Biol. Cell. 27:4043–4054. 10.1091/mbc.E16-08-0570 [DOI] [PMC free article] [PubMed] [Google Scholar]
- Han L., Zhu Y., Liu M., Zhou Y., Lu G., Lan L., Wang X., Zhao Y., and Zhang X.C.. 2017. Molecular mechanism of substrate recognition and transport by the AtSWEET13 sugar transporter. Proc. Natl. Acad. Sci. USA. 114:10089–10094. 10.1073/pnas.1709241114 [DOI] [PMC free article] [PubMed] [Google Scholar]
- Hong K.H., and Miller C.. 2000. The lipid-protein interface of a Shaker K(+) channel. J. Gen. Physiol. 115:51–58. 10.1085/jgp.115.1.51 [DOI] [PMC free article] [PubMed] [Google Scholar]
- Humphrey W., Dalke A., and Schulten K.. 1996. VMD: visual molecular dynamics. J. Mol. Graph. 14:33–38: 27–28. 10.1016/0263-7855(96)00018-5 [DOI] [PubMed] [Google Scholar]
- Jézégou A., Llinares E., Anne C., Kieffer-Jaquinod S., O’Regan S., Aupetit J., Chabli A., Sagné C., Debacker C., Chadefaux-Vekemans B., et al. . 2012. Heptahelical protein PQLC2 is a lysosomal cationic amino acid exporter underlying the action of cysteamine in cystinosis therapy. Proc. Natl. Acad. Sci. USA. 109:E3434–E3443. 10.1073/pnas.1211198109 [DOI] [PMC free article] [PubMed] [Google Scholar]
- Kamisetty H., Ovchinnikov S., and Baker D.. 2013. Assessing the utility of coevolution-based residue-residue contact predictions in a sequence- and structure-rich era. Proc. Natl. Acad. Sci. USA. 110:15674–15679. 10.1073/pnas.1314045110 [DOI] [PMC free article] [PubMed] [Google Scholar]
- Kawano-Kawada M., Manabe K., Ichimura H., Kimura T., Harada Y., Ikeda K., Tanaka S., Kakinuma Y., and Sekito T.. 2019. A PQ-loop protein Ypq2 is involved in the exchange of arginine and histidine across the vacuolar membrane of Saccharomyces cerevisiae. Sci. Rep. 9:15018 10.1038/s41598-019-51531-z [DOI] [PMC free article] [PubMed] [Google Scholar]
- Keener J.M., and Babst M.. 2013. Quality control and substrate-dependent downregulation of the nutrient transporter Fur4. Traffic. 14:412–427. 10.1111/tra.12039 [DOI] [PMC free article] [PubMed] [Google Scholar]
- Krogh A., Larsson B., von Heijne G., and Sonnhammer E.L.L.. 2001. Predicting transmembrane protein topology with a hidden Markov model: application to complete genomes. J. Mol. Biol. 305:567–580. 10.1006/jmbi.2000.4315 [DOI] [PubMed] [Google Scholar]
- Kulak N.A., Pichler G., Paron I., Nagaraj N., and Mann M.. 2014. Minimal, encapsulated proteomic-sample processing applied to copy-number estimation in eukaryotic cells. Nat. Methods. 11:319–324. 10.1038/nmeth.2834 [DOI] [PubMed] [Google Scholar]
- Kumar S., and Nussinov R.. 2002. Close-range electrostatic interactions in proteins. ChemBioChem. 3:604–617. [DOI] [PubMed] [Google Scholar]
- Latorraca N.R., Fastman N.M., Venkatakrishnan A.J., Frommer W.B., Dror R.O., and Feng L.. 2017. Mechanism of Substrate Translocation in an Alternating Access Transporter. Cell. 169:96–107.e12. 10.1016/j.cell.2017.03.010 [DOI] [PMC free article] [PubMed] [Google Scholar]
- Lee Y., Nishizawa T., Yamashita K., Ishitani R., and Nureki O.. 2015. Structural basis for the facilitative diffusion mechanism by SemiSWEET transporter. Nat. Commun. 6:6112 10.1038/ncomms7112 [DOI] [PMC free article] [PubMed] [Google Scholar]
- Lemmon M.A., Flanagan J.M., Treutlein H.R., Zhang J., and Engelman D.M.. 1992. Sequence specificity in the dimerization of transmembrane alpha-helices. Biochemistry. 31:12719–12725. 10.1021/bi00166a002 [DOI] [PubMed] [Google Scholar]
- Léon S., Erpapazoglou Z., and Haguenauer-Tsapis R.. 2008. Ear1p and Ssh4p are new adaptors of the ubiquitin ligase Rsp5p for cargo ubiquitylation and sorting at multivesicular bodies. Mol. Biol. Cell. 19:2379–2388. 10.1091/mbc.e08-01-0068 [DOI] [PMC free article] [PubMed] [Google Scholar]
- Li M., Rong Y., Chuang Y.-S.S., Peng D., and Emr S.D.D.. 2015a Ubiquitin-dependent lysosomal membrane protein sorting and degradation. Mol. Cell. 57:467–478. 10.1016/j.molcel.2014.12.012 [DOI] [PubMed] [Google Scholar]
- Li M., Koshi T., and Emr S.D.. 2015b Membrane-anchored ubiquitin ligase complex is required for the turnover of lysosomal membrane proteins. J. Cell Biol. 211:639–652. 10.1083/jcb.201505062 [DOI] [PMC free article] [PubMed] [Google Scholar]
- Lin C.H., MacGurn J.A., Chu T., Stefan C.J., and Emr S.D.. 2008. Arrestin-related ubiquitin-ligase adaptors regulate endocytosis and protein turnover at the cell surface. Cell. 135:714–725. 10.1016/j.cell.2008.09.025 [DOI] [PubMed] [Google Scholar]
- Liu B., Du H., Rutkowski R., Gartner A., and Wang X.. 2012. LAAT-1 is the lysosomal lysine/arginine transporter that maintains amino acid homeostasis. Science. 337:351–354. 10.1126/science.1220281 [DOI] [PMC free article] [PubMed] [Google Scholar]
- Lomize M.A., Pogozheva I.D., Joo H., Mosberg H.I., and Lomize A.L.. 2012. OPM database and PPM web server: resources for positioning of proteins in membranes. Nucleic Acids Res. 40(D1):D370–D376. 10.1093/nar/gkr703 [DOI] [PMC free article] [PubMed] [Google Scholar]
- Ma M., and Burd C.G.. 2019. Retrograde trafficking and quality control of yeast synaptobrevin, Snc1, are conferred by its transmembrane domain. Mol. Biol. Cell. 30:1729–1742. 10.1091/mbc.E19-02-0117 [DOI] [PMC free article] [PubMed] [Google Scholar]
- Mikosch M., Käberich K., and Homann U.. 2009. ER export of KAT1 is correlated to the number of acidic residues within a triacidic motif. Traffic. 10:1481–1487. 10.1111/j.1600-0854.2009.00962.x [DOI] [PubMed] [Google Scholar]
- Miller E.A., Beilharz T.H., Malkus P.N., Lee M.C.S., Hamamoto S., Orci L., and Schekman R.. 2003. Multiple cargo binding sites on the COPII subunit Sec24p ensure capture of diverse membrane proteins into transport vesicles. Cell. 114:497–509. 10.1016/S0092-8674(03)00609-3 [DOI] [PubMed] [Google Scholar]
- Mol A.R., Castro M.S., and Fontes W.. 2018. NetWheels: A web application to create high quality peptide helical wheel and net projections. bioRxiv. doi: 10.1101/416347 (Preprint posted September 14, 2018) [DOI]
- Natarajan N., Foresti O., Wendrich K., Stein A., and Carvalho P.. 2020. Quality Control of Protein Complex Assembly by a Transmembrane Recognition Factor. Mol. Cell. 77:108–119.e9. 10.1016/j.molcel.2019.10.003 [DOI] [PMC free article] [PubMed] [Google Scholar]
- Nishimura N., and Balch W.E.. 1997. A di-acidic signal required for selective export from the endoplasmic reticulum. Science. 277:556–558. 10.1126/science.277.5325.556 [DOI] [PubMed] [Google Scholar]
- Ovchinnikov S., Kamisetty H., and Baker D.. 2014. Robust and accurate prediction of residue-residue interactions across protein interfaces using evolutionary information. eLife. 3:e02030 10.7554/eLife.02030 [DOI] [PMC free article] [PubMed] [Google Scholar]
- Ovchinnikov S., Kinch L., Park H., Liao Y., Pei J., Kim D.E., Kamisetty H., Grishin N.V., and Baker D.. 2015. Large-scale determination of previously unsolved protein structures using evolutionary information. eLife. 4:e09248 10.7554/eLife.09248 [DOI] [PMC free article] [PubMed] [Google Scholar]
- Patterson G.H., Knobel S.M., Sharif W.D., Kain S.R., and Piston D.W.. 1997. Use of the green fluorescent protein and its mutants in quantitative fluorescence microscopy. Biophys. J. 73:2782–2790. 10.1016/S0006-3495(97)78307-3 [DOI] [PMC free article] [PubMed] [Google Scholar]
- Reggiori F., and Pelham H.R.B.. 2002. A transmembrane ubiquitin ligase required to sort membrane proteins into multivesicular bodies. Nat. Cell Biol. 4:117–123. 10.1038/ncb743 [DOI] [PubMed] [Google Scholar]
- Roy A., Kucukural A., and Zhang Y.. 2010. I-TASSER: a unified platform for automated protein structure and function prediction. Nat. Protoc. 5:725–738. 10.1038/nprot.2010.5 [DOI] [PMC free article] [PubMed] [Google Scholar]
- Ruggiano A., Foresti O., and Carvalho P.. 2014. Quality control: ER-associated degradation: protein quality control and beyond. J. Cell Biol. 204:869–879. 10.1083/jcb.201312042 [DOI] [PMC free article] [PubMed] [Google Scholar]
- Ruivo R., Bellenchi G.C., Chen X., Zifarelli G., Sagné C., Debacker C., Pusch M., Supplisson S., and Gasnier B.. 2012. Mechanism of proton/substrate coupling in the heptahelical lysosomal transporter cystinosin. Proc. Natl. Acad. Sci. USA. 109:E210–E217. 10.1073/pnas.1115581109 [DOI] [PMC free article] [PubMed] [Google Scholar]
- Sardana R., Zhu L., and Emr S.D.. 2019. Rsp5 Ubiquitin ligase-mediated quality control system clears membrane proteins mistargeted to the vacuole membrane. J. Cell Biol. 218:234–250. 10.1083/jcb.201806094 [DOI] [PMC free article] [PubMed] [Google Scholar]
- Sato B.K., Schulz D., Do P.H., and Hampton R.Y.. 2009. Misfolded membrane proteins are specifically recognized by the transmembrane domain of the Hrd1p ubiquitin ligase. Mol. Cell. 34:212–222. 10.1016/j.molcel.2009.03.010 [DOI] [PMC free article] [PubMed] [Google Scholar]
- Saudek V. 2012. Cystinosin, MPDU1, SWEETs and KDELR belong to a well-defined protein family with putative function of cargo receptors involved in vesicle trafficking. PLoS One. 7:e30876 10.1371/journal.pone.0030876 [DOI] [PMC free article] [PubMed] [Google Scholar]
- Savocco J., Nootens S., Afokpa W., Bausart M., Chen X., Villers J., Renard H.F., Prévost M., Wattiez R., and Morsomme P.. 2019. Yeast α-arrestin Art2 is the key regulator of ubiquitylation-dependent endocytosis of plasma membrane vitamin B1 transporters. PLoS Biol. 17:e3000512 10.1371/journal.pbio.3000512 [DOI] [PMC free article] [PubMed] [Google Scholar]
- Sekito T., Nakamura K., Manabe K., Tone J., Sato Y., Murao N., Kawano-Kawada M., and Kakinuma Y.. 2014. Loss of ATP-dependent lysine uptake in the vacuolar membrane vesicles of Saccharomyces cerevisiae ypq1∆ mutant. Biosci. Biotechnol. Biochem. 78:1199–1202. 10.1080/09168451.2014.918489 [DOI] [PubMed] [Google Scholar]
- Sharp L.L., Zhou J., and Blair D.F.. 1995. Features of MotA proton channel structure revealed by tryptophan-scanning mutagenesis. Proc. Natl. Acad. Sci. USA. 92:7946–7950. 10.1073/pnas.92.17.7946 [DOI] [PMC free article] [PubMed] [Google Scholar]
- Smirnova I., Kasho V., and Kaback H.R.. 2011. Lactose permease and the alternating access mechanism. Biochemistry. 50:9684–9693. 10.1021/bi2014294 [DOI] [PMC free article] [PubMed] [Google Scholar]
- Song B.L., Javitt N.B., and DeBose-Boyd R.A.. 2005. Insig-mediated degradation of HMG CoA reductase stimulated by lanosterol, an intermediate in the synthesis of cholesterol. Cell Metab. 1:179–189. 10.1016/j.cmet.2005.01.001 [DOI] [PubMed] [Google Scholar]
- Sonnhammer E.L.L., von Heijne G., and Krogh A.. 1998. A hidden Markov model for predicting transmembrane helices in protein sequences. Proc. Int. Conf. Intell. Syst. Mol. Biol. 6:175–182. [PubMed] [Google Scholar]
- Sullivan J.A., Lewis M.J., Nikko E., and Pelham H.R.B.. 2007. Multiple interactions drive adaptor-mediated recruitment of the ubiquitin ligase rsp5 to membrane proteins in vivo and in vitro. Mol. Biol. Cell. 18:2429–2440. 10.1091/mbc.e07-01-0011 [DOI] [PMC free article] [PubMed] [Google Scholar]
- Sun Z., and Brodsky J.L.. 2019. Protein quality control in the secretory pathway. J. Cell Biol. 218:3171–3187. 10.1083/jcb.201906047 [DOI] [PMC free article] [PubMed] [Google Scholar]
- Talaia G., Gournas C., Saliba E., Barata-Antunes C., Casal M., André B., Diallinas G., and Paiva S.. 2017. The α-Arrestin Bul1p Mediates Lactate Transporter Endocytosis in Response to Alkalinization and Distinct Physiological Signals. J. Mol. Biol. 429:3678–3695. 10.1016/j.jmb.2017.09.014 [DOI] [PubMed] [Google Scholar]
- Tao Y., Cheung L.S., Li S., Eom J.-S.S., Chen L.-Q.Q., Xu Y., Perry K., Frommer W.B., and Feng L.. 2015. Structure of a eukaryotic SWEET transporter in a homotrimeric complex. Nature. 527:259–263. 10.1038/nature15391 [DOI] [PMC free article] [PubMed] [Google Scholar]
- Tardiff D.F., Jui N.T., Khurana V., Tambe M.A., Thompson M.L., Chung C.Y., Kamadurai H.B., Kim H.T., Lancaster A.K., Caldwell K.A., et al. . 2013. Yeast reveal a “druggable” Rsp5/Nedd4 network that ameliorates α-synuclein toxicity in neurons. Science. 342:979–983. 10.1126/science.1245321 [DOI] [PMC free article] [PubMed] [Google Scholar]
- Tsai M.-F.F., Phillips C.B., Ranaghan M., Tsai C.-W.W., Wu Y., Willliams C., and Miller C.. 2016. Dual functions of a small regulatory subunit in the mitochondrial calcium uniporter complex. eLife. 5:e15545 10.7554/eLife.15545 [DOI] [PMC free article] [PubMed] [Google Scholar]
- Valdar W.S.J. 2002. Scoring residue conservation. Proteins. 48:227–241. 10.1002/prot.10146 [DOI] [PubMed] [Google Scholar]
- Verdon G., Oh S., Serio R.N., and Boudker O.. 2014. Coupled ion binding and structural transitions along the transport cycle of glutamate transporters. eLife. 3:e02283 10.7554/eLife.02283 [DOI] [PMC free article] [PubMed] [Google Scholar]
- Waterhouse A., Bertoni M., Bienert S., Studer G., Tauriello G., Gumienny R., Heer F.T., de Beer T.A.P., Rempfer C., Bordoli L., et al. . 2018. SWISS-MODEL: homology modelling of protein structures and complexes. Nucleic Acids Res. 46(W1):W296–W303. 10.1093/nar/gky427 [DOI] [PMC free article] [PubMed] [Google Scholar]
- Wawrzycka D., Sadlak J., Maciaszczyk-Dziubinska E., and Wysocki R.. 2019. Rsp5-dependent endocytosis and degradation of the arsenite transporter Acr3 requires its N-terminal acidic tail as an endocytic sorting signal and arrestin-related ubiquitin-ligase adaptors. Biochim. Biophys. Acta Biomembr. 1861:916–925. 10.1016/j.bbamem.2019.02.004 [DOI] [PubMed] [Google Scholar]
- Woo J.S., Suh H.Y., Park S.Y., and Oh B.H.. 2006. Structural basis for protein recognition by B30.2/SPRY domains. Mol. Cell. 24:967–976. 10.1016/j.molcel.2006.11.009 [DOI] [PubMed] [Google Scholar]
- Xu Y., Tao Y., Cheung L.S., Fan C., Chen L.-Q.Q., Xu S., Perry K., Frommer W.B., and Feng L.. 2014. Structures of bacterial homologues of SWEET transporters in two distinct conformations. Nature. 515:448–452. 10.1038/nature13670 [DOI] [PMC free article] [PubMed] [Google Scholar]
- Yang J., Yan R., Roy A., Xu D., Poisson J., and Zhang Y.. 2015. The I-TASSER Suite: protein structure and function prediction. Nat. Methods. 12:7–8. 10.1038/nmeth.3213 [DOI] [PMC free article] [PubMed] [Google Scholar]
- Yang X., Arines F.M., Zhang W., and Li M.. 2018. Sorting of a multi-subunit ubiquitin ligase complex in the endolysosome system. eLife. 7:e33116 10.7554/eLife.33116 [DOI] [PMC free article] [PubMed] [Google Scholar]
- Yang X., Zhang W., Wen X., Bulinski P.J., Chomchai D.A., Arines F.M., Liu Y.Y., Sprenger S., Teis D., Klionsky D.J., and Li M.. 2020. TORC1 regulates vacuole membrane composition through ubiquitin- and ESCRT-dependent microautophagy. J. Cell Biol. 219:e201902127 10.1083/jcb.201902127 [DOI] [PMC free article] [PubMed] [Google Scholar]
- Yu J., Ge J., Heuveling J., Schneider E., and Yang M.. 2015. Structural basis for substrate specificity of an amino acid ABC transporter. Proc. Natl. Acad. Sci. USA. 112:5243–5248. 10.1073/pnas.1415037112 [DOI] [PMC free article] [PubMed] [Google Scholar]
- Zhu L., Jorgensen J.R., Li M., Chuang Y.-S., and Emr S.D.. 2017. ESCRTs function directly on the lysosome membrane to downregulate ubiquitinated lysosomal membrane proteins. eLife. 6:e26403 10.7554/eLife.26403 [DOI] [PMC free article] [PubMed] [Google Scholar]
Associated Data
This section collects any data citations, data availability statements, or supplementary materials included in this article.
Supplementary Materials
lists the suppressor mutants isolated from the Ura3 screen.
lists the yeast strains used in this study.
lists the plasmids used in this study.


