Abstract
Purpose:
Ultrasound (US)-guided high dose rate (HDR) prostate brachytherapy requests the clinicians to place HDR needles (catheters) into the prostate gland under transrectal US (TRUS) guidance in the operating room. The quality of the subsequent radiation treatment plan is largely dictated by the needle placements, which varies upon the experience level of the clinicians and the procedure protocols. Real-time plan dose distribution, if available, could be a vital tool to provide more subjective assessment of the needle placements, hence potentially improving the radiation plan quality and the treatment outcome. However, due to low signal-to-noise ratio (SNR) in US imaging, real-time multi-needle segmentation in 3D TRUS, which is the major obstacle for real-time dose mapping, has not been realized to date. In this study, we propose a deep learning-based method that enables accurate and real-time digitization of the multiple needles in the 3D TRUS images of HDR prostate brachytherapy.
Methods:
A deep learning model based on the U-Net architecture was developed to segment multiple needles in the 3D TRUS images. Attention gates were considered in our model to improve the prediction on the small needle points. Furthermore, the spatial continuity of needles was encoded into our model with total variation (TV) regularization. The combined network was trained on 3D TRUS patches with the deep supervision strategy, where the binary needle annotation images were provided as ground truth. The trained network was then used to localize and segment the HDR needles for a new patient’s TRUS images. We evaluated our proposed method based on the needle shaft and tip errors against manually defined ground truth and compared our method with other state-of-art methods (U-Net and deeply supervised attention U-Net).
Results:
Our method detected 96% needles of 339 needles from 23 HDR prostate brachytherapy patients with 0.290 ± 0.236 mm at shaft error and 0.442 ± 0.831 mm at tip error. For shaft localization, our method resulted in 96% localizations with less than 0.8 mm error (needle diameter is 1.67 mm), while for tip localization, our method resulted in 75% needles with 0 mm error and 21% needles with 2 mm error (TRUS image slice thickness is 2 mm). No significant difference is observed (P = 0.83) on tip localization between our results with the ground truth. Compared with UNet and deeply supervised attention U-Net, the proposed method delivers a significant improvement on both shaft error and tip error (P < 0.05).
Conclusions:
We proposed a new segmentation method to precisely localize the tips and shafts of multiple needles in 3D TRUS images of HDR prostate brachytherapy. The 3D rendering of the needles could help clinicians to evaluate the needle placements. It paves the way for the development of real-time plan dose assessment tools that can further elevate the quality and outcome of HDR prostate brachytherapy.
Keywords: deep learning, multi-needle localization, prostate brachytherapy, total variation regularization, ultrasound images
1. INTRODUCTION
Prostate cancer is the most common cancer affecting the male population, which accounts for nearly 20% of new cancer diagnoses in 2019. It is the second leading cause of cancer-related mortality1 among males in the USA. Radiation therapy plays an important role in terms of managing the disease. High dose rate (HDR) prostate brachytherapy, which emerged in the early 1990s, is currently offered to prostate cancer patients with intermediate- to high-risk disease as boost treatment together with pelvic external beam radiation therapy, and to patients with low risk disease as the monotherapy option.2,3 It gains attractions to patients and radiation oncologists due to its excellent dose conformity to target and sparing of adjacent organs, and its HDR hypofractionation scheme which is preferable to prostate cancer that has a postulated lower α/β-ratio than normal tissue.4,5
A common HDR prostate brachytherapy typically involves few steps: a) inserting 12–20 catheters (needles) into the prostate under the guidance of transrectal ultrasound (TRUS) imaging; b) CT (and/or MRI) scanning patient for anatomy delineations and catheter digitization; c) treatment planning by optimizing source dwell positions and dwell times in the implanted needles; and d) delivering planned treatment by dwelling the radioactive source through the implanted needles. Although the current process has been widely implemented in clinics, there are still a few drawbacks in steps a and b. First, the CT scan (and/or MRI scan) adds extra steps in the clinical workflow. It prolongs patients’ length of stay and raises the total medical cost. Besides, moving patients on and off the scanner table increases the risk of inducing needle shifts.6 An ideal situation will be only using single imaging modality, such as TRUS. Secondly, the clinicians, given real-time visualization of the needles by TRUS, place needles in operating room (OR) solely based on their experiences now. Without an objective evaluation method, the experience-based needle placement could lead to suboptimal needle pattern, leaving little room for treatment plan quality improvement later in the planning stage. Real-time dosimetric information of treatment plan, if can be provided in OR, would enable oncologists to make objective judgment calls for the needle placement. Thirdly, the task of manually contouring the needles and identifying the needle tips is tedious, slow, and prone to human errors. It hinders the possibility to have real-time treatment planning in OR, which could be a big step further from the current practice. An accurate and quick needle segmentation method is of imminent need.
Efforts have been made trying to address these issues. TRUS-only and MRI-only HDR prostate brachytherapy techniques have been invented to streamline the entire practice.7,8 Apparently, TRUS-based approach, compared to MRI-based counterparts, bears drastically less cost and is widely available. However, TRUS images often suffer from serious noise, speckles, and artifacts while needles are difficult to distinguish from those image corruptions. Needles tend to have similar appearance as artifacts and speckles, confounding the traditional automatic localization method.9 While having multiple inserted needles, the interplays among them could lead to the partially overlapped trajectories in TRUS images. The needles far away from the probe could deliver low TRUS signals and are therefore difficult to be identified from the background noise.9–11 In contrast, the physics of the rapid dose falloff from the source puts high penalties on inaccurate needle localizations. Tiong A. et al. has shown the source must be localized to within 3mm for acceptable dosimetric uncertainty.12 It further imposes rigorous demands upon the auto-localization method. Given all the reasons above, automatic multi-needle localization in the TRUS, which is of great benefits, is technically challenging.
Many approaches have been proposed in the literature for localization of single needle10 and needle-like instrument.13 Uherčík et al. used a threshold method to separate the needle voxels from background and then designed a needle fitting model with the random sample consensus (RANSAC) algorithm,11 which was improved using Kalman filter in the work of Zhao et al.14 Pourtaherian et al. introduced several enhancement and normalization processes for image preprocessing and adopted linear discriminant analysis (LDA) and linear support vector machine (SVM) for voxel classification, followed by using the RANSAC algorithm.13 Beigi et al. trained a probabilistic SVM using the temporal features for pixel classification and computed the probability map of the segmented pixels, followed by using Hough transform for needle localization.15 Besides, a hybrid camera- and US-based method was designed in the work of Daoud et al. to localize and track the inserted needle.16 Recently, deep convolutional neural networks (CNNs) show the capabilities on learning hierarchical features to build the mappings from data space to objective space.17 Because of the power of nonlinear fitting, CNNs have been shown to achieve outstanding performance on various medical image-based tasks,18 such as segmentation,19–23 cancer diagnosis,24 and localization.10 For needle segmentation and localization, Pourtaherian et al. trained a CNN model to identify the needle voxels from other echogenic structures and also built a fully convolutional networks (FCN) to label the needle parts, where both methods were followed by RANSAC for needle-axis estimation and visualization.25 And they also made an attempt on adopting dilated CNNs to localize the partially visible needles in US images.26 In addition, to implement automatic needle segmentation in MRI, Mehrtash et al. presented a deep anisotropic 3D FCN with skip-connections10 that is inspired by the 3D U-Net model.27 Multi-needle detection in 3D US images for US-guided prostate brachytherapy is lacking attention in current studies. Zhang et al. recently proposed an unsupervised sparse dictionary learning-based method to detect the needles by the difference between the reconstructed needle images and the original needle images, where the position-specific dictionaries were learned on the no-needle images.28 However, this method suffered time cost in use and did not consider the manual contours available in the clinic.
In this paper, we propose a deep learning model, a variant of the U-Net,29,30 to segment and localize the needles from the 3D US images. Our model adopts the attention gate31 to treat the small object issue and adopts a weighted total variation (TV) regularization to encode the spatial continuity of needle shaft. To the best of our knowledge, this is the first attempt using the attention U-Net as the answer for multi-needle localization in 3D US images. The designed network is computationally efficient, which allows the whole volumetric US images to be used for the training process and the trained network to be used for real-time needle tracking. It cuts the human effort and provide needle digitization within a second, which can assist the needled placement procedure. Using it as one of the building blocks, a real-time HDR planning system can be built to help clinicians make RT plan and evaluate it in the OR, potentially eliminating the need of MRI/CT scans and even have the treatment delivered in OR.
2. MATERIALS AND METHODS
2.A. Data and data annotation
The data used in this study consist of 1024 × 768×N × 23 3D TRUS images produced from 23 patients who received HDR prostate brachytherapy in our institution, where N is the slice number ranging from 26 to 40. Those US images were scanned with the Hitachi Hi Vision Avius (Model: EZU-MT30-S1, Hitachi Medical Corporation, Tokyo, Japan) US system equipped with a transrectal probe (Model: HITACHI EUP-U533). All US B-mode images were acquired using the same settings: 7.5-MHz center frequency, 17 frames per second, thermal index <0.4, mechanical index 0.4, and 65-dB dynamic range. In general, 12–19 (depending on patient prostate size) Nucletron ProGuide Sharp 5F catheters were placed under the TRUS guidance. The catheter length is 240 mm and its outer diameter is 1.67 mm. The US examination was performed by an experienced urologist. An example slice is shown in [Fig. 1(a)].
Fig. 1.

An example of US slice with needles (a), its annotations (b), and its mask image (c).
VelocityAI 3.2.1 (Varian Medical Systems, Palo Alto, CA) was used by an experienced physicist to manually mark all the trace points on each slice. These annotations are considered as the ground truth. For brevity, in this paper, needle shaft is defined as the line fitted on the needle trajectory, where needle trajectory is the set of center points of the needle on all related slices; needle tip is defined as the center point of needle shaft at the most distal slice. In the TRUS images, a needle can be identified by the white susceptibility artifacts around its truth shaft, as shown in [Fig. 1(a)]. Besides, there is another key fact that all susceptible artifacts from a needle shaft are continuous through multiple adjacent slices. As a result, the annotation tool allows the physicist to label several pivotal slices from needle tips to its base, and then yields the needle trajectory through linear interpolation. Ground truth needle segmentation label maps were accordingly generated by placing circle points with 1.67 mm diameter on all intersections, as shown in [Fig. 1(b)]. The corresponding mask images were employed as the learning-based target, as shown in [Fig. 1(c)].
2.B. Deep supervised attention U-Net with TV regularization
The proposed deep learning-based needle segmentation approach consists of two major parts, that is, the training stage and the segmentation stage. In the training stage, our approach was fed with the pair of needle images [Fig. 1(a)] and their corresponding mask images [Fig. 1(c)] to build the nonlinear mappings from the images to the masks. Figure 2 outlines the schematic workflow of our proposed method. To train the designed network, we use a window of size 576 × 576 × 16 voxels to extract patches from the needle images and its mask images. The network delivers the mapped results of the given needle images and then matches the mapped result with its corresponding mask images in the deep-supervision loss function, followed by updating the network weights toward error reduction according to the objective error. In addition, the data augmentation, such as rotation, flipping, and scaling, was used to enlarge the variety of the training data.
Fig. 2.

The schematic workflow of the proposed method.
After our network was trained with these data, it was then used to segment the needles from the US images of a new patient following the segmentation stage in Fig. 2. These resulted 3D image patches were merged into the segmented images that show the needle’s localization. Finally, the localizations were used to visualize and check the needle insertions in the process of prostate brachytherapy.
2.B.1. U-Net
Our approach is based on the classical U-Net which is a popular deep learning architecture for biomedical image segmentation.30 The U-Net contains a contracting path to capture context and an expansive path that enable precise localization. The contracting path is a typical dawn-sampling architecture using convolution with rectified linear unit (ReLU) and max pooling operation. In the expansive path, each step is performed by up-sampling the feature map and up-convolution with ReLU, where the feature maps are merged through skip connections to combine coarse-level maps from the contracting path and fine-level predictions.
This network architecture is shown as the core of Fig. 2. With this architecture, the U-Net is trained by decreasing the following cross entropy loss function29:
| (1) |
where x ∈ Ω is the pixel position with , K is the number of classes, w(x) represents a weight map for introducing an importance to x, ℓ(x) denotes the true label of x, and
| (2) |
where ak(x) denotes the activation at x in feature channel k ∈ {1, 2, …, K}. The U-Net is then trained with the stochastic gradient descent (SGD) and can be used fast in image segmentation. In this study, we adopt the U-Net in 3D image segmentation, that is, , which is referred to FCN. In addition, data augmentation is essential to teach the network the desired invariance and robustness properties, especially when there are only few available training samples.
2.B.2. Attention gates
To capture a large receptive field for semantic contextual information, standard CNN architectures are used to gradually downsample the feature map. However, it remains difficult to reduce false-positive predictions for small objects,32 like the needles in this study. An imposing solution to this issue is integrating attention gates (AGs) in a standard CNN model, which aims to progressively suppress feature response in irrelevant background regions. AGs are realized by a series of attention coefficients, α ∈ [0, 1], to identify the activations relevant to the specific task. The attention coefficients can be formulated as31:
| (3) |
where x is the fine-level map, g is the coarse-level map, σ2(·) represents the sigmoid activation function,
| (4) |
and Θatt is to characterize AG by a set of parameters containing linear transformations , , ψ(·), and the bias terms bg, bφ. These AG parameters can be trained with the standard back-propagation updates. In addition, the AG strategy has been integrated into U-Net model, that is, the attention U-Net.31
2.B.3. TV Regularization
TV regularization was first proposed to remove the noise in an image via minimizing it and a fidelity term.33 The aim of TV is to shrink the total variation (TV), that is, the total gradient at a pixel, while the noise pixel usually results in a great TV. This regularization has been successfully applied in medical image processing, such as MRI reconstruction34 and registration.35 The TV norm can be defined as:
| (5) |
where ▽f (x) is the gradient of an image f at a pixel x. While TV regularization is isotropic, this study uses additive weights to highlight the gradient at z-axis more than x-axis and y-axis. The reason is shown in Fig. 3, where the needles have a strong continuity structure in z-axis. To this end, we adopt the weighted TV as:
| (6) |
where ω is the weight vector containing a greater entry for z-axis.
Fig. 3.
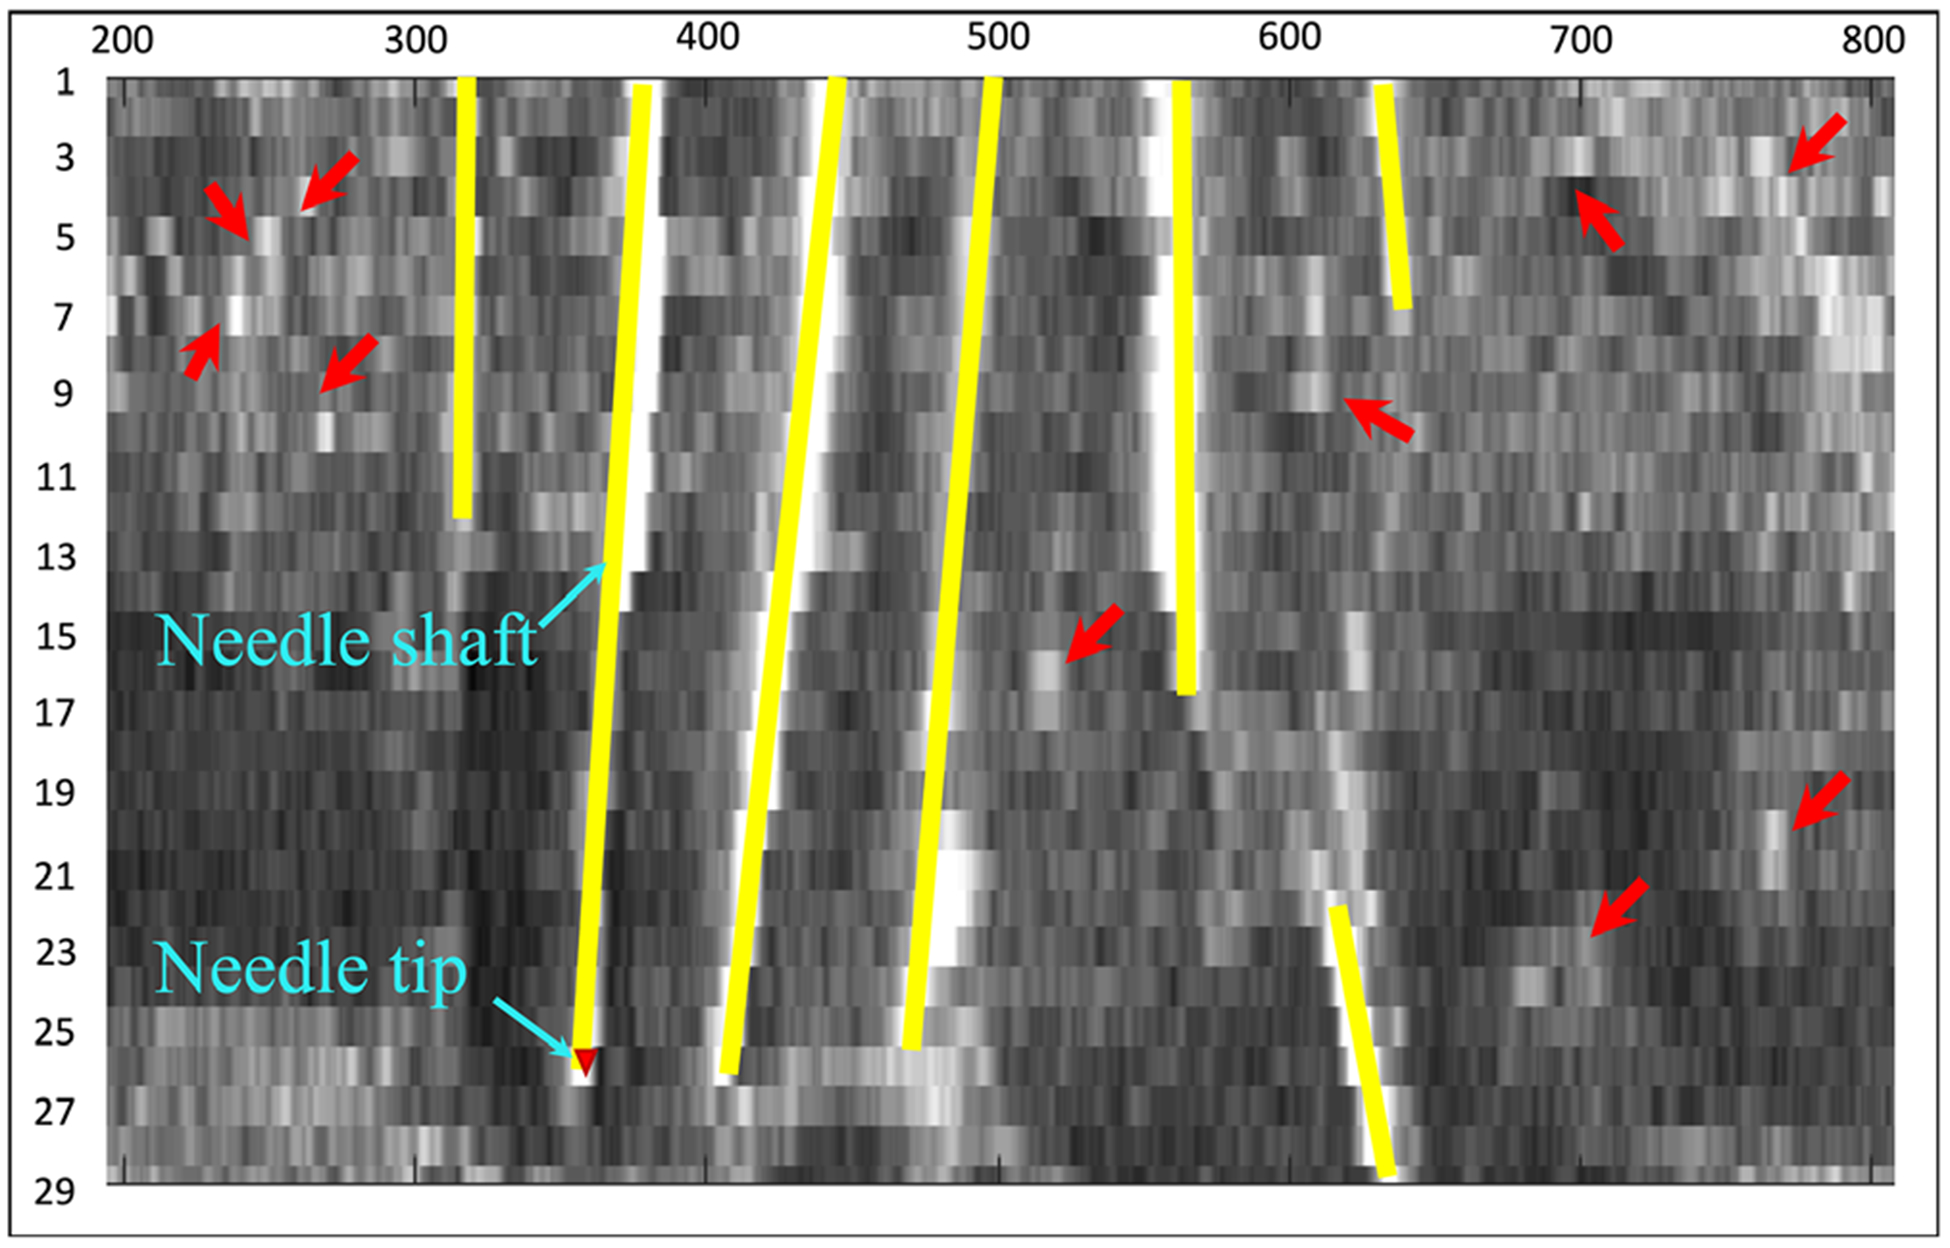
A needle-directional profile of 3D needle US image that has in total 29 slices. The yellow lines are needles and the red arrows indicate noise.
2.B.4. The used loss function
In this study, we integrate the weighted TV regularization into the U-Net to arrive at the loss function used for needle segmentation and localization, which is formulated as:
| (7) |
where and λ is the trade-off parameter. Note that this loss function degrades into the loss of the U-Net or the loss of the attention U-Net, when λ = 0. TV regularization is a continuous non-smooth objective, but it was simply calculated on the resulting images. Therefore, the combined objective can be optimized similar to training of a CNN, which was stated in the work of Liu et al.36 In this paper, we employed the SGD algorithm on the designed deep network like the U-Net.29
2.B.5. Network learning with deep supervision
Deep supervision, a deep network learning strategy, is to introduce companion objective function for each hidden layer.37 In the process of back propagation, the loss at each hidden layer is computed with the overall objective function and the companion objective function. With the consideration of the hidden layer loss, deep supervision can make all learned features more discriminative and can alleviate the common problem of vanishing gradients. Since this strategy has been effectively used in medical image segmentation,38 we in this study also employ deep supervision to learn the proposed deep network model. For clarity, Table I summarizes the proposed deep learning method.
Table I.
The summary of the proposed deep model.
| Method: | TV-regularized deep supervised attention U-Net |
|---|---|
| Input Data: | 3D image patches of needle US and Mask. |
| Network Architecture: | U-Net with 23 Iayers29 and attention gate31 |
| Overall Loss Function: | As shown in Eq. (7) |
| Companion Loss Function: | As shown in Eq. (7) |
| Training Strategy: | SGD algorithm and deep supervision36,37 |
SGD, stochastic gradient descent.
2.B.6. Method test
We used the fivefold cross validation at the level of patient to evaluate the proposed method on our US image dataset. That is, we divided the dataset into in total five subsets, three subsets of five patients each and two subsets of four patients each, to conduct five tests by alternately using the five subsets as test set. In each test, we trained the proposed deep learning-based model shown in Table I on four of the five subsets. Then, the trained model was used to segment all the images in the test subset. After five runs, all the patients’ US images were segmented as the results that were followed by various evaluations.
For the hyperparameters in the propose model, we set ω = [0.2, 0.2, 0.6] in Eq. (6) and λ = 0.5 in Eq. (7) simply, while the other parameters were set as that in U-Net. In network learning per run, we set the learning rate to 2e–4 and terminated the training at 300 epochs where the training error was not observed a significant decrease. Note that the fivefold cross validation was used for method evaluation, while the model could be retrained on all data for the clinical practical use.
2.C. Evaluation metrics
To evaluate the results, we computed the metrics including needle shaft localization error, needle tip localization error, and needle detection accuracy. For needle shaft localization, we detected circles from the segmented images and then obtained their center positions. The needle shaft localization error is to evaluate needle localizations at all image slices, defined as:
| (8) |
where N is the number of all center position in computation, oi represents the predicted position for the ith center, and ti is the ground truth position for the ith center. The needle tip localization error aims to measure the error of needle tip positions on the needle direction, defined as:
| (9) |
where M is the number of needles in computation, li indicates the predicted length for the ith needle, and si is the ground truth length for the ith needle. Needle detection accuracy aims to evaluate the detection performance at the needle level, defined as:
| (10) |
where τi was here set as 10% of the ith needle insertion length and #{A} counts the elements in a set A.
Besides, we calculated the common indexes for all needle shaft locations at needle center level, including
| (11) |
to quantitatively evaluate the proposed method. We compared the proposed method with U-Net27 to show the necessity of deep-supervised attention strategy and deep-supervised attention U-Net31 (DSA U-Net for short) to show the necessity of TV regularization. Paired t tests were performed to evaluate whether there are significant differences between our automatic segmentation results and manual delineations.
3. RESULTS
3.A. Overall Evaluation
Figure 4 exhibits 2D visualizations of the segmentation results at five slices from US images. As is shown in the five slices, U-Net has 15 incorrectly detected points highlighted with the yellow circles and two missed points highlighted with the blue triangles; DAS U-Net has 13 incorrectly detected points and two missed points; while, our method has two missed points on the 28th slices. For overall observation, Fig. 5 displays the 3D visualization of the segmentation results. From Fig. 5, both U-Net and DSA U-net result in a couple of incorrectly detected points while our method achieves superior performance.
Fig. 4.
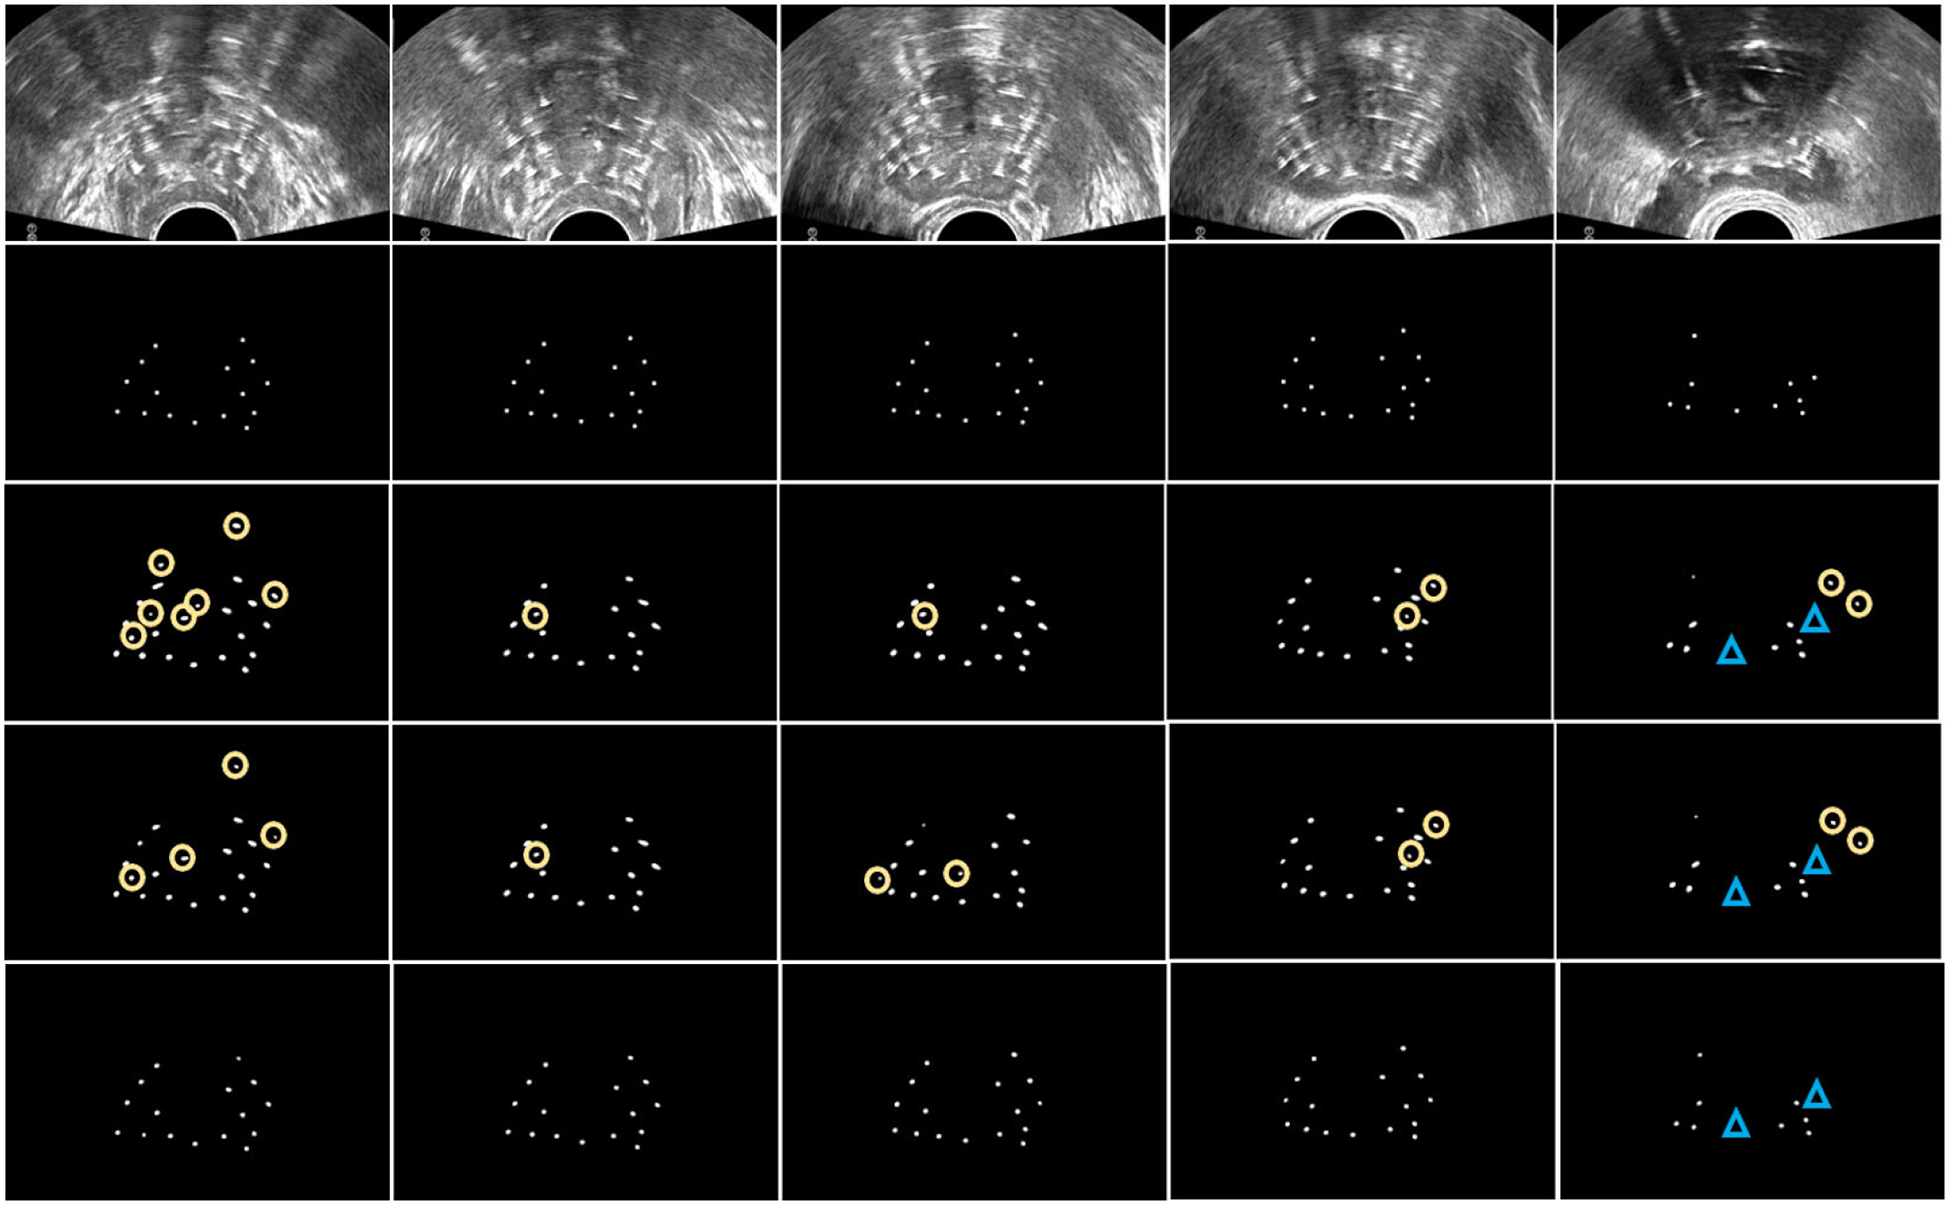
The 2D visualization of needle detections in US slices. The rows from top to down corresponds to the US images, ground truth, U-Net, DSA U-Net, and the proposed method, respectively. The columns from left to right, respectively, corresponds to the 1th, 7th, 14th, 21th, and 28th slice of the US images. The yellow circles show the incorrect localizations, and the blue triangles show the missed localizations.
Fig. 5.
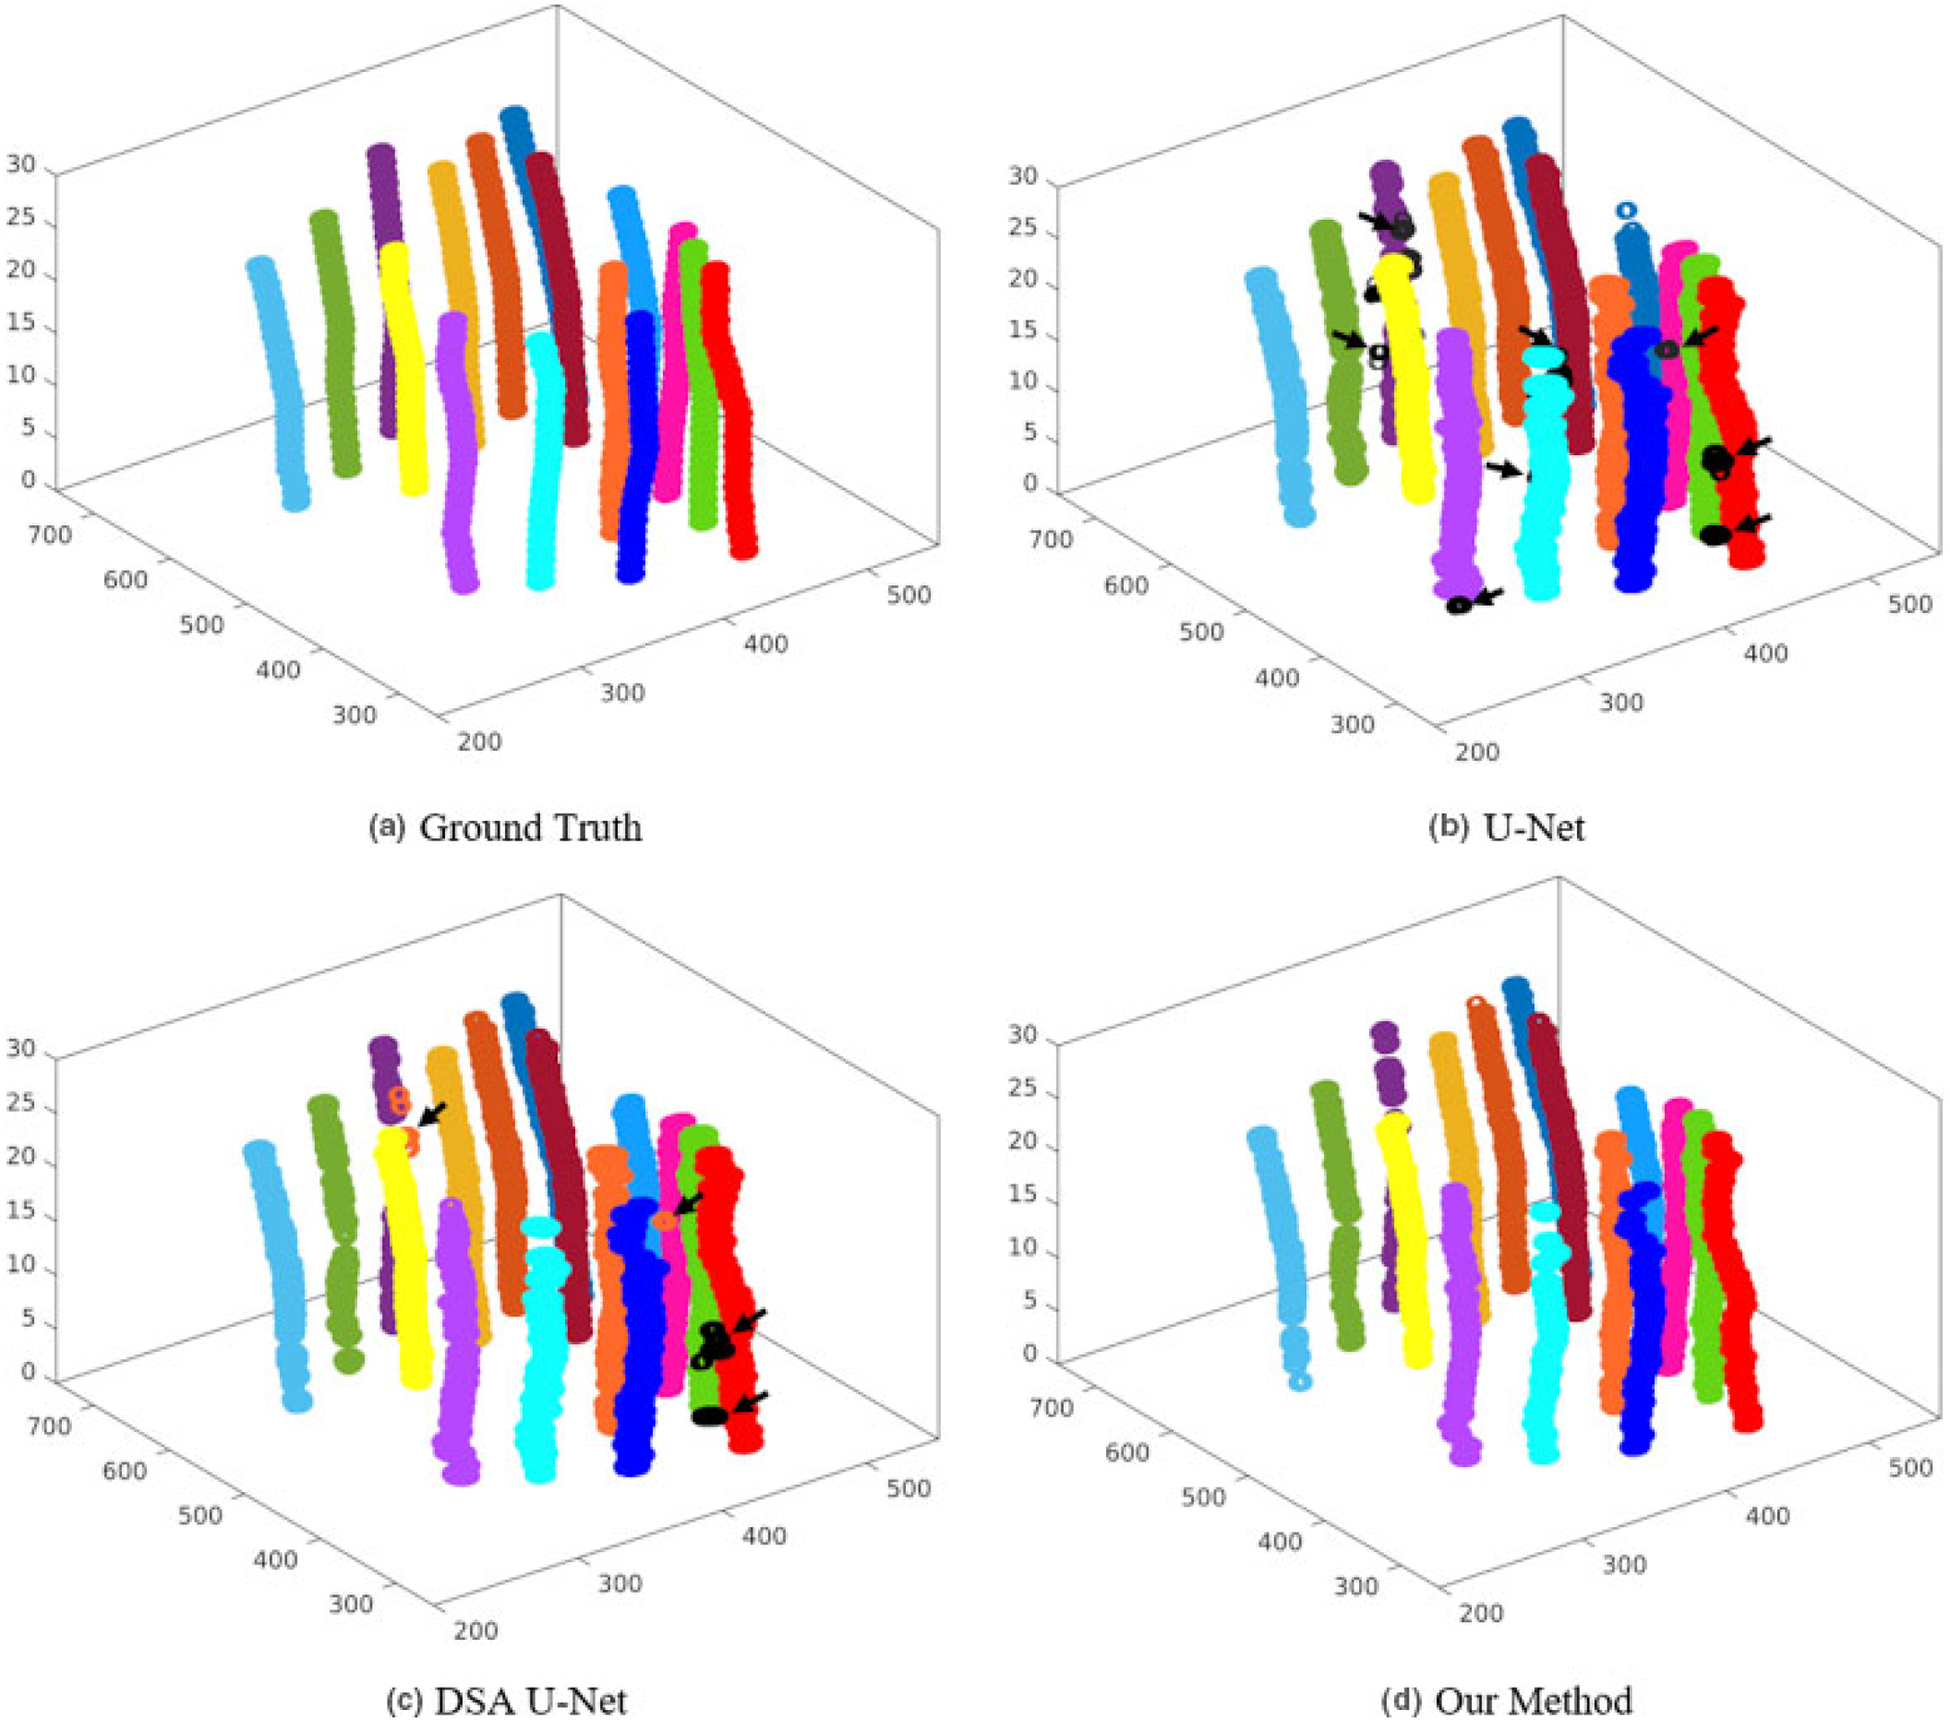
The 3D visualization of the detected needles. Different colors indicate different needles, where the black arrows indicate the incorrect detections.
To have multi-view evaluations, we summarized the overall performance of the detections at both the needle level and the center level. At the needle level, Table II summarizes the average shift localization error (Eshaft), the average tip localization error (Etip), and the detection accuracy (Acc) on the 339 needles, as well as their standard deviations. Table III lists the P values on tip errors and shaft errors using the two-sample t test to show the difference between our method and other compared methods. In these results, our method detects 96% needles with 0.292 mm shaft error and 0.442 mm tip error, which is statistically significantly better on various metrics than U-Net and DSA U-Net. These significant improvements make the needle digitation more accurate to subsequently have a precise does planning.
Table II.
Overall quantification results with the three methods.
| Needle Level (mm) | Needle Center Level | ||||||
|---|---|---|---|---|---|---|---|
| U-Net | DSA U-Net | Our Method | U-Net | DSA U-Net | Our Method | ||
| Eshaft | 0.368 ± 0.318 | 0.355 ± 0.304 | 0.292 ± 0.236 | Precise | 0.833 | 0.893 | 0.966 |
| Etip | 0.582 ± 0.910 | 0.551 ± 0.895 | 0.442 ± 0.831 | Recall | 0.983 | 0.960 | 0.903 |
| Acc | 0.953 | 0.951 | 0.963 | Fl | 0.901 | 0.924 | 0.932 |
Table III.
P values from t tests on the evaluation results at the needle level.
| U-Net vs Our Method | DSA U-Net vs Our Method | |
|---|---|---|
| P value on Eshaft | <0.001 | <0.001 |
| P value on Etip | 0.003 | 0.019 |
At the needle center level, Table II summarizes the statistical indexes in Eq. (11) calculated from all needle centers on all 2D US slices. From these results at center level, our method achieves the highest precise while U-Net achieves the highest recall among the three methods. However, our method delivers the best performance on the synthesized F1.
3.B. Results on shaft error
Figure 6 lists the average needle shaft localization errors for all patients. As can be seen, our method did not produce a shaft localization with more than 0.4 mm error. For most patients, the shaft error can be limited under 0.3 mm in our method, while both U-Net and DSA U-Net have many bad shaft localizations with greater errors (even greater than 0.5 mm). Our method leads to the error from 0.21 mm to 0.40 mm, while U-Net and DSA U-Net are from 0.24 mm to 0.54 mm and from 0.24 mm to 0.49 mm. In all, our method consistently achieved a lower average error than U-Net and DSA U-Net at every patient.
Fig. 6.
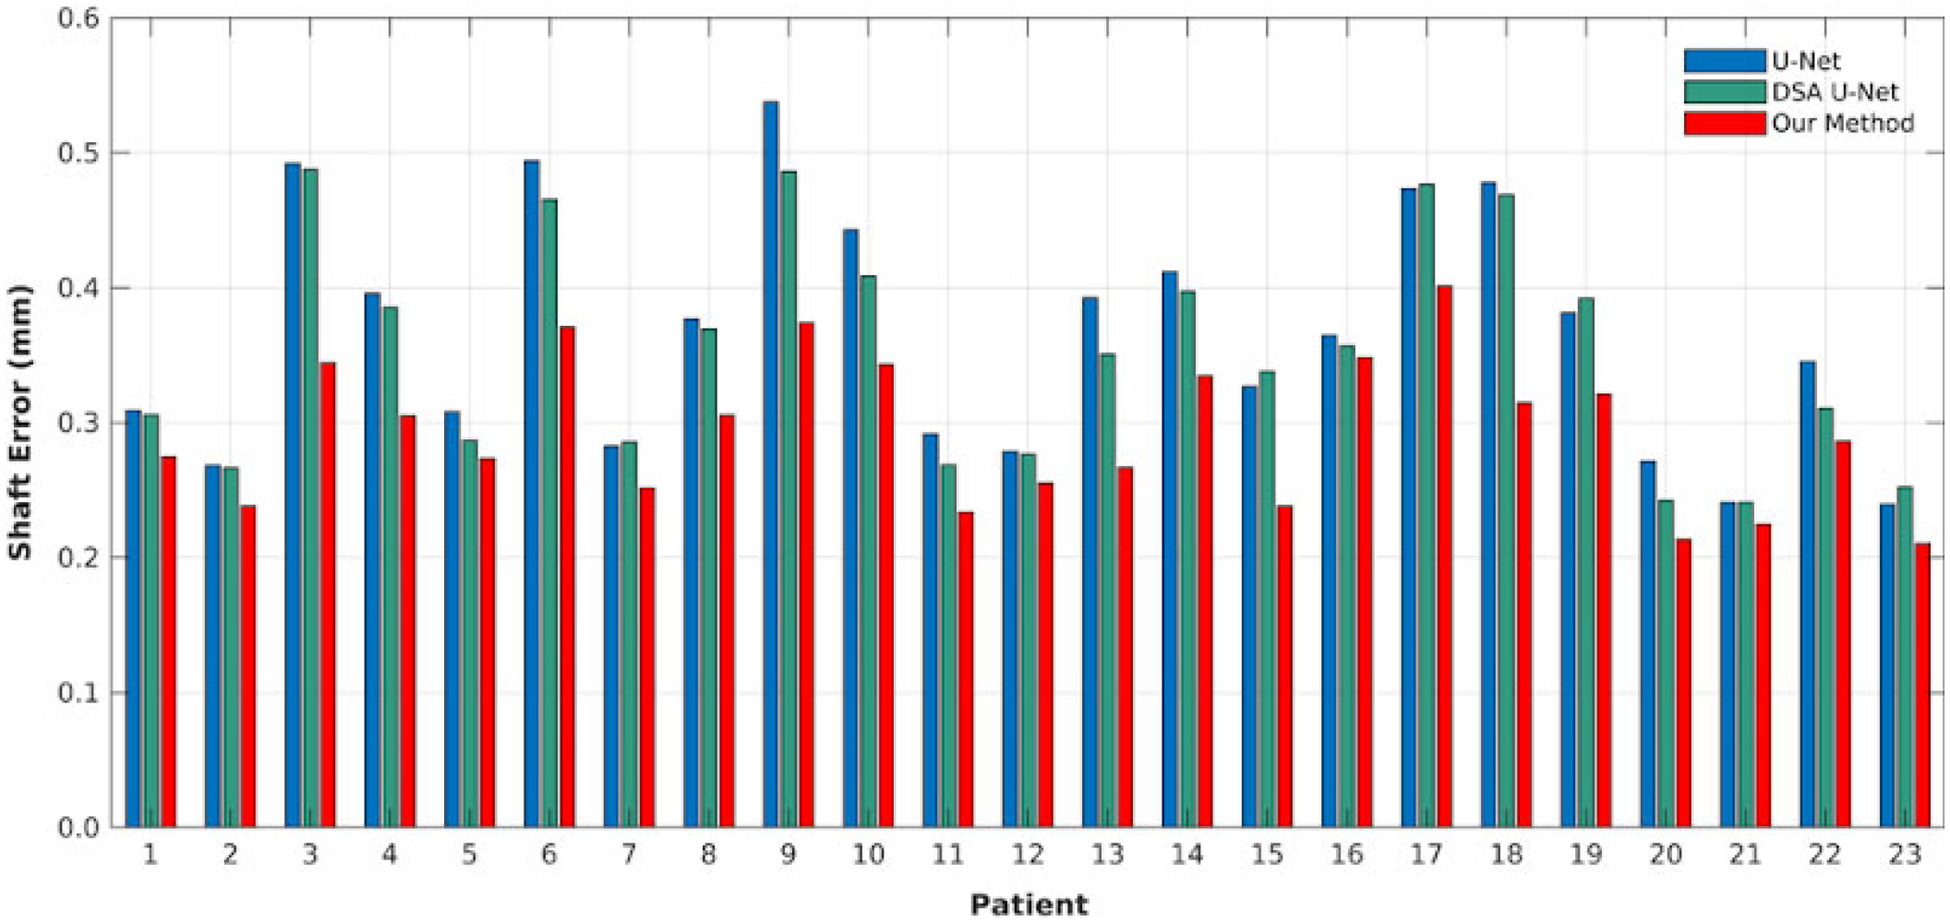
Needle shaft localization error on all patients with the three methods.
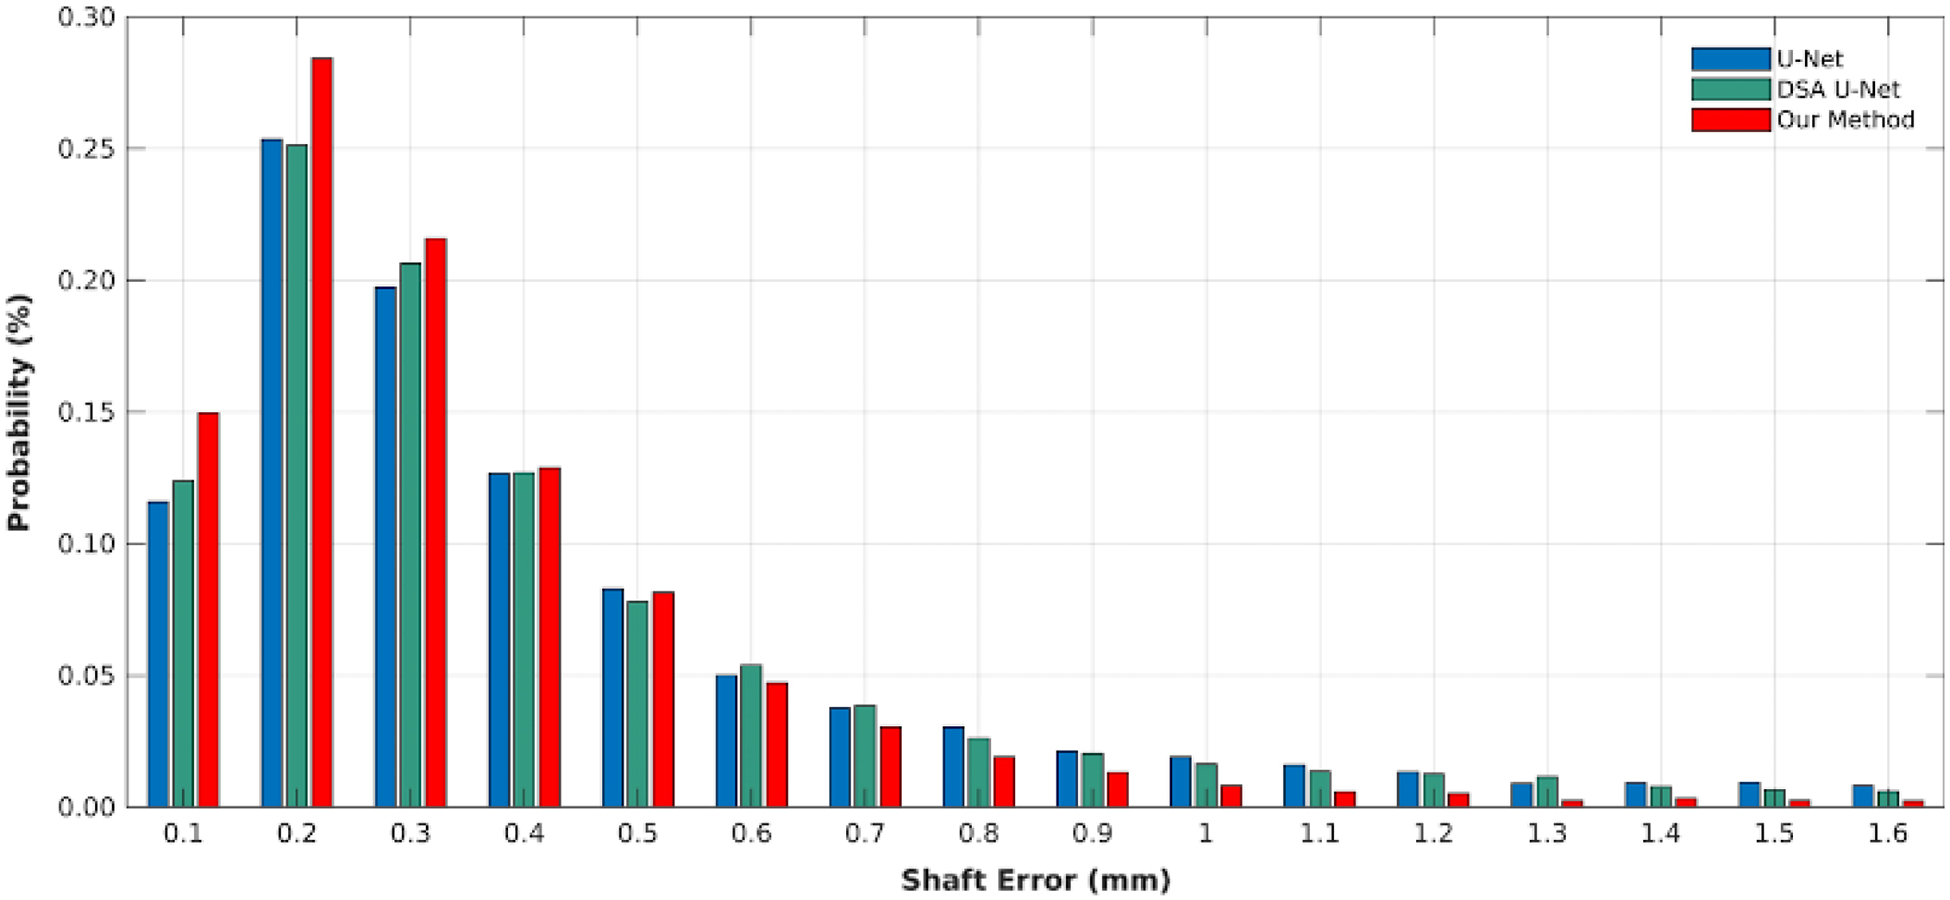
Figure 7 shows the distribution of all shaft localization centers, where the probability is computed by #{localization error in the interval}/# {all localizations} and the interval is from 0 mm to1 mm with step 0.1 mm. From these probabilities in Fig. 7, our method has 96% localizations with less than 0.8 mm error, while both U-Net and DSA U-Net have 90% localizations. Moreover, our method has about 78% localization with less than 0.4 mm error while both U-Net and DSA U-Net have 70% localizations. Note that the diameter of the used needle is 1.67 mm.
Fig. 7.
The error distributions of the shaft localization center with the three methods.
3.C. Results on tip error
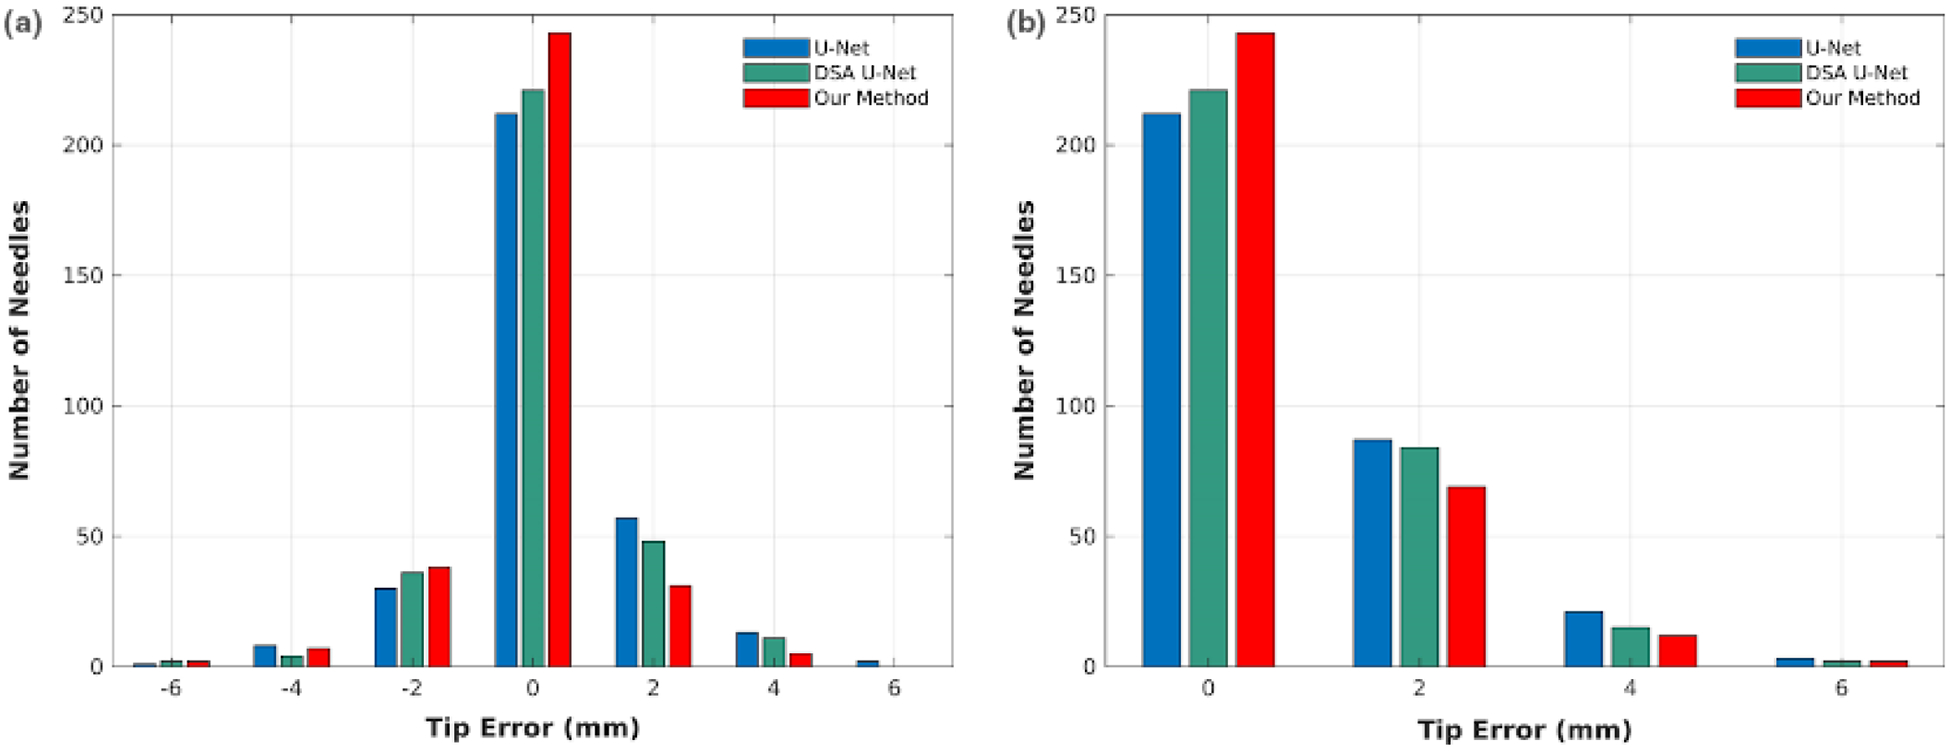
Figure 8 shows the counts of the needles with different tip localization errors. As is shown, our method has 75% needle tips with 0 mm error, while U-Net and DSA U-Net respective have 66% and 69% tips. From [Fig. 8(a)], our method leads to 11% needle tips with 2 mm error shorter than ground truth, while U-net and DSA U-Net have 11% and 9% tips, respectively. However, our method has 21% needle tips with 2 mm absolute error, while U-Net and DSA U-Net have 27% and 26% tips, respectively. Moreover, the compared methods both results in more detected tips with greater than 4 mm errors than our method.
Fig. 8.
The tip localization error distributions in terms of standard difference (a) and absolute difference (b).
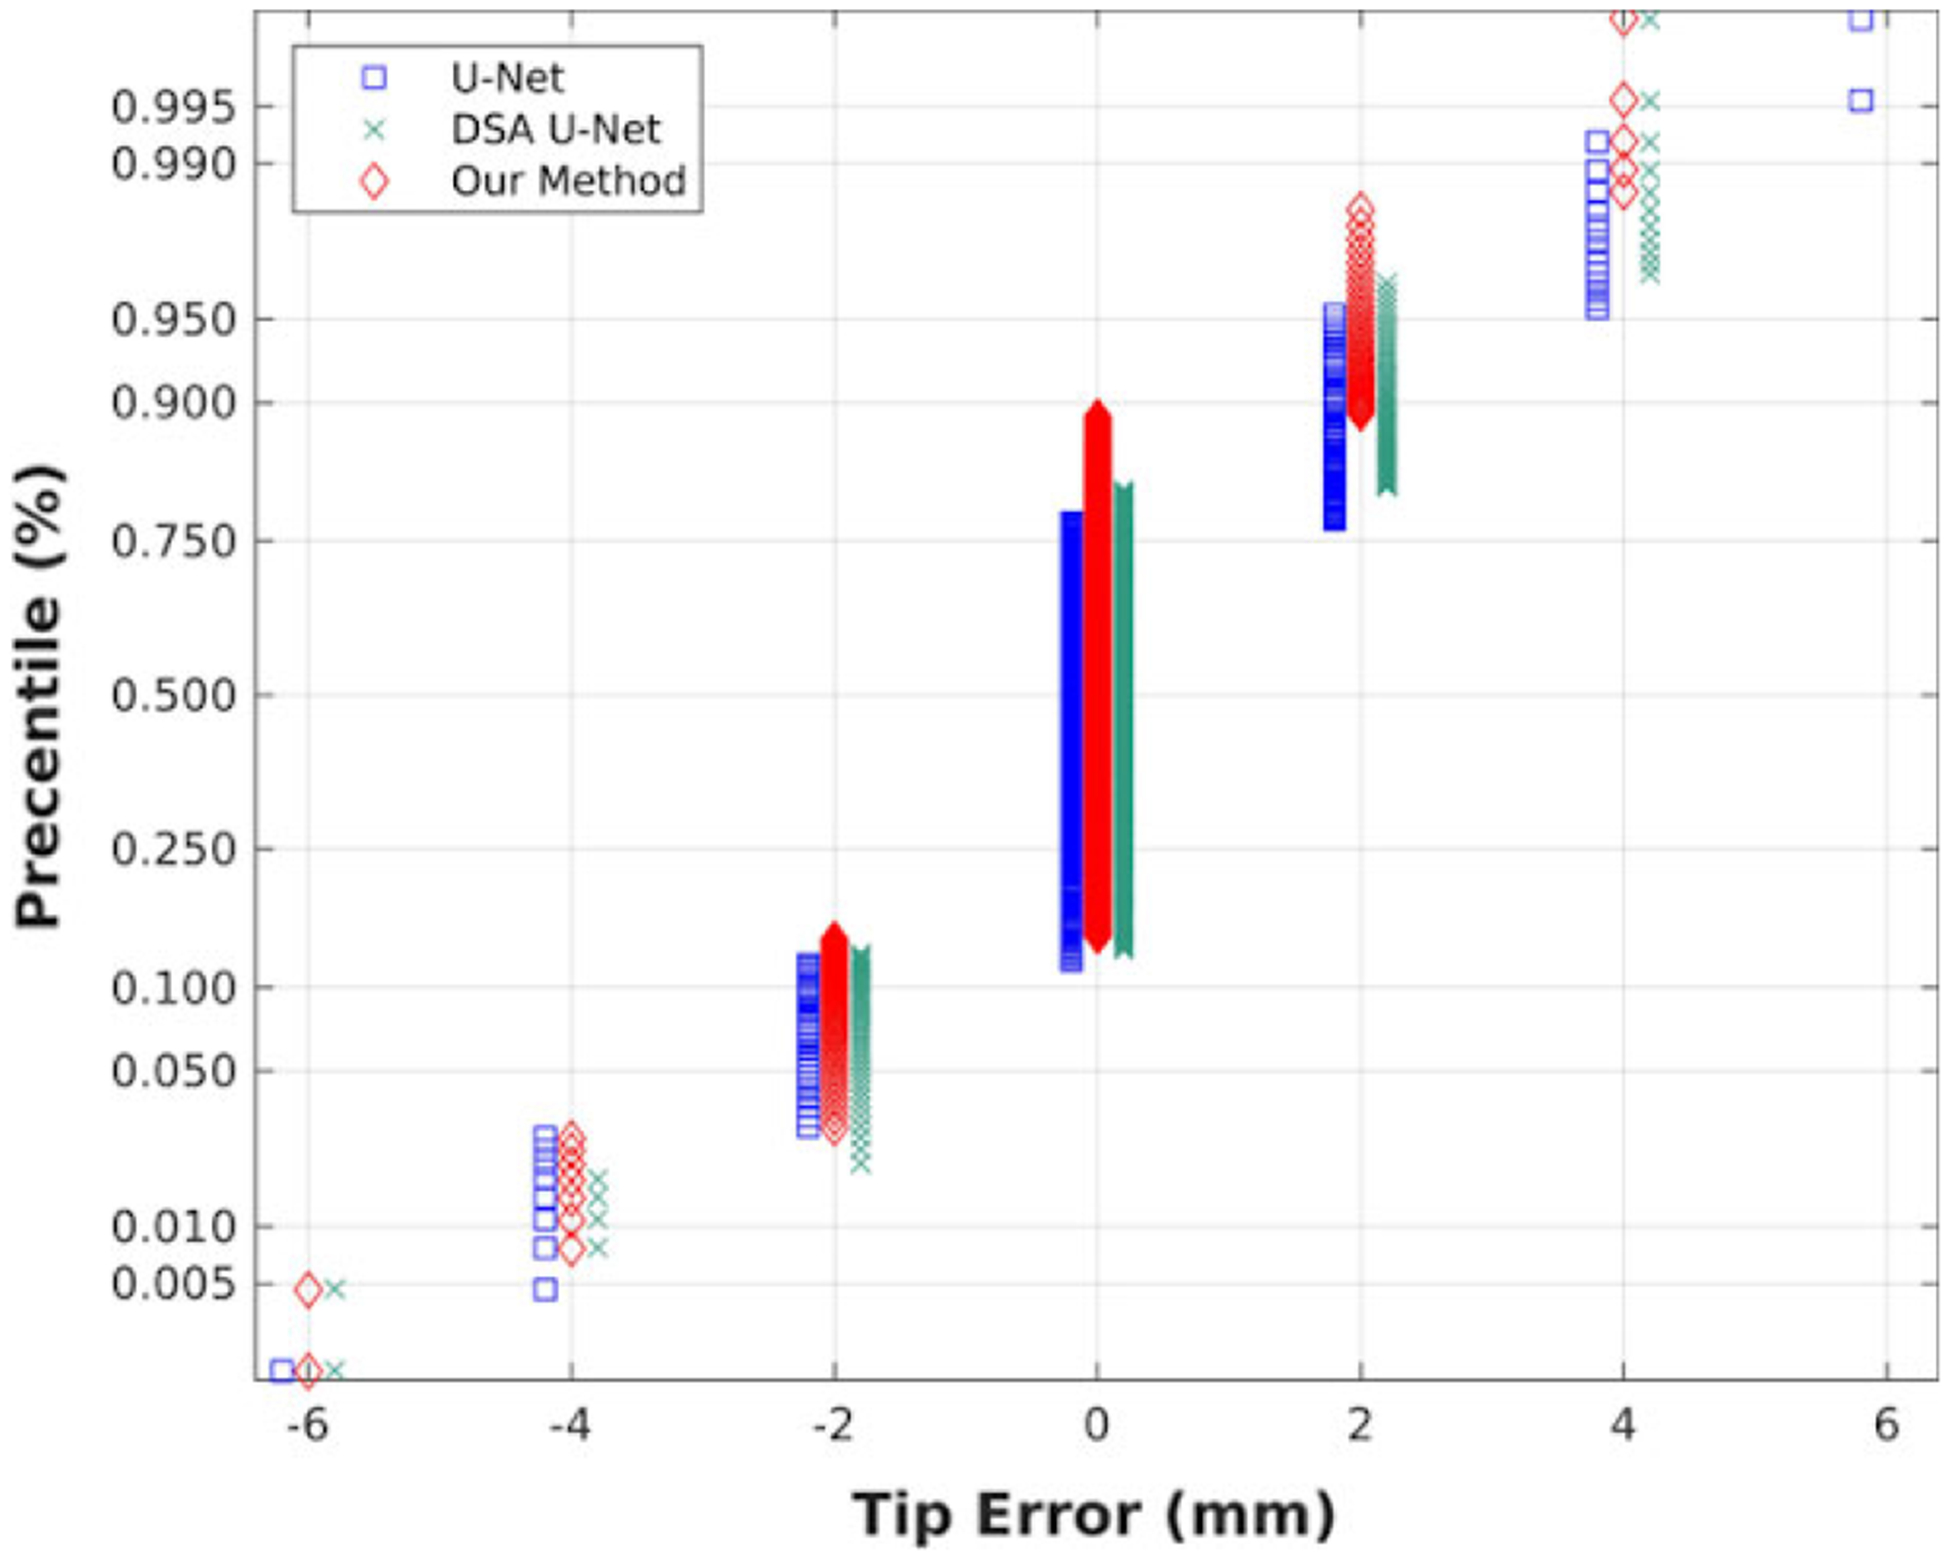
Figure 9 shows the percentiles of each tip error in all errors, where 0.25, 0.5, and 0.75 indicate the first quartile, the median, and the third quartile, respectively. From Fig. 9, our method leads to the range from 14% to 89% at 0 mm error, while U-Net and DSA U-Net is, respectively, from 12% to 77% and from 13% to 81%. The three methods all deliver 0 mm at the three quartiles, but our method has a greater percentile of 0 mm (75%) than other two methods (65% and 68%), which cause large deviations in Table II.
Fig. 9.
The distribution of the tip localization error with the three methods.
3.D. Comparisons with sparse dictionary learning and parameter discussion
The multi-needle detection method, ORDL, proposed by Zhang et al. employed a graph dictionary learning method39 to learn the feature set that excludes needle features from the no-needle US images, and then rebuilt the needle images to obtain the difference between the original images and the reconstructed images, followed by refinements on the difference images corresponding to needles. Here, we trained ORDL on 71 no-needle images and tested on our 23 needle images. The evaluated overall results were: Eshaft = 0.286 ± 0.227 (mm), Etip = 0.741 0.665 (mm), and Acc = 0.941. The P values from comparisons with our method are 0.173 on Eshaft and less than 0.001 on Etip. In comparison with ORDL, our method has a significant improvement on tip detection, a higher performance on correctly detected needle number, and a comparable accuracy on shaft detection. However, our method tackles a patient in less than 1 sec, while ORDL takes about 38 sec per patient.
The parameter λ in our method aims to introduce the importance of TV regularization. We here discussed this parameter to have an insight into this regularization, by varying the λ in {0.1, 0.3, 0.5, 1, 2}. The evaluation results on each λ are summarized in Table IV. From the results in Table IV, the parameter λ has a little impact when it is in [0.3, 2]. But the small regularization could decrease the performance on needle detection, like λ = 0.1, while our method degenerates into DSA U-Net when λ = 0. A relatively large λ is needed to highlight the importance of the TV regularization. We in this paper simply set λ = 0.5 in all experiments.
Table IV.
The overall statistical results using various λ in our method.
| λ = 0.1 | λ = 0.3 | λ = 0.5 | λ = 1 | λ = 2 | |
|---|---|---|---|---|---|
| Eshaft | 0.327 ± 0.297 | 0.290 ± 0.259 | 0.292 ± 0.236 | 0.297 ± 0.281 | 0.301 ± 0.273 |
| Etip | 0.514 ± 0.922 | 0.451 ±0.816 | 0.442 ± 0.831 | 0.439 ± 0.880 | 0.472 ± 0.836 |
| Acc | 0.953 | 0.959 | 0.963 | 0.956 | 0.941 |
4. DISCUSSIONS AND CONCLUSIONS
Exact knowledge of needle positions is essential to accomplish reliable dosimetry of HDR prostate brachytherapy. Multi-needle localization in TRUS images is a difficult task since TRUS images inherently have more noise, speckles, and artifacts than CT and MRI, and inserted needles suffer severe artifacts and worse detectability. Current manual catheter digitization process is labor intensive and prone to errors, which prevents real-time treatment planning and dosimetric evaluation during needle insertion. Alternatively, this study presented an automatic method for accurate needle segmentation and localization in US images by adopting a deep learning-based model.
More specifically, we integrate AGs into standard U-net to suppress feature response in irrelevant background. The needle’s z-axis continuity is also encoded via TV regularization. The network architecture of U-Net is employed to combine both ideas and then trained by deep-supervision strategy. On the used dataset, DSA U-Net deliveries better performance than U-Net, showing the effeteness of deep supervised attention strategy. Our method achieves better performance than DSA U-Net, showing that our method can benefit from both the TV regularization and the deep-supervised attention. These significant improvements comparing with U-Net and DSA U-Net could make the US-based multi-needle digitization more accurate to subsequently have a precise does planning.
Overall, on the 3D US images from 23 prostate patients, our method delivers a decent performance in terms of various metrics in comparison with clinically used needle segmentation manually contoured by physicists in the 339 needles, our method overall detected 96% needles with 0.290 ± 0.236 mm at shaft error and 0.442 ± 0.831 mm at tip error. The maximum shaft error is 1.6mm, well within the recommended 3mm criteria by Morton’s paper2. In addition, our method achieved a high precision (0.967) on shaft localization as shown in Table IV. In addition, the deep learning-based method can tackle needle localization within 1 sec, while an experience physicist takes about 15–20 min to manually digitize all catheters. With these advantages, the proposed method can be used to aid the physicist to localize the needle positions and tips in the digitization step of the US-guided HDR prostate brachytherapy and hence achieve an accurate does planning. Besides, this method has a potential of supporting a real-time needle tracking system.
Our proposed real-time multi-needle detection method can be used to simplify the HDR treatment workflow. Combined with current automatic prostate segmentation method on TRUS,20 it is now possible to build a real-time treatment planning system in the OR. With such a system, physicians will be able to adjust the needle pattern in the OR based on the knowledge of achievable dose distribution. Moreover, it could allow skipping the step of CT scan, reducing the risk of needle shifts over the entire process. Potentially, it would enable treatment right after needle placement in OR room, which decreases the patient’s overall stay and cost and entails logistical issues such as patient transportation. All those innovations have a potential of leading to better clinical outcomes for patients.
Several limitations in clinical practices could be shown as follows. (a) Although the proposed method detects most needles and spots, the results are still needed to be checked by a physicist. Due to the given needle number, the manual work is greatly reduced to the missed needs and spots. (b) The proposed method has a potential of a real-time application to minimal human intervention and cognitive load. Some refinements are needed to improve our results toward a totally automatic real-time use.28 (c) The manual needles in our dataset were made by an experience physicist and checked by other two physicist to ensure the correction. Both the uncertainty and possible errors in manual needles that may affect our method are not considered in our method. We leave these problems in the future works.
Overall, the proposed method can achieve an adequate performance on multi-needle detection in TRUS images for HDR prostate brachytherapy. Since there is no assumption regarding the prostate images, this method can also be used for other object detection assignments in 3D US images, such as implanted seeds in low dose rate (LDR) brachytherapy or any fiducial markers. More importantly, it paves the way for real-time adaptive HDR prostate brachytherapy in the OR and other innovations in the HDR prostate brachytherapy space. In the future, the novel deep learning method will be evaluated on more patient data and various other clinical situations.
ACKNOWLEDGMENTS
This research is supported in part by the National Cancer Institute of the National Institutes of Health under Award Number R01CA215718 (XY), the Department of Defense (DoD) Prostate Cancer Research Program (PCRP) Award W81XWH-17-1-0438 (TL) and W81XWH-17-1-0439 (AJ) and Dunwoody Golf Club Prostate Cancer Research Award (XY), a philanthropic award provided by the Winship Cancer Institute of Emory University.
REFERENCES
- 1.Siegel RL, Miller KD, Jemal A, Cancer statistics, 2019. CA: A Cancer J Clin. 2019;69:7–34. [DOI] [PubMed] [Google Scholar]
- 2.Morton GC. High-dose-rate brachytherapy boost for prostate cancer: rationale and technique. J Contemp Brachyther. 2014;6:323. [DOI] [PMC free article] [PubMed] [Google Scholar]
- 3.Yoshioka Y, Suzuki O, Otani Y, Yoshida K, Nose T, Ogawa K. High-dose-rate brachytherapy as monotherapy for prostate cancer: technique, rationale and perspective. J Contemp Brachyther. 2014;6:91. [DOI] [PMC free article] [PubMed] [Google Scholar]
- 4.Challapalli A, Jones E, Harvey C, Hellawell G, Mangar S. High dose rate prostate brachytherapy: an overview of the rationale, experience and emerging applications in the treatment of prostate cancer. Br J Radiol. 2012;85:S18–S27. [DOI] [PMC free article] [PubMed] [Google Scholar]
- 5.Wang T, Press RH, Giles M, et al. Multiparametric MRI-guided dose boost to dominant intraprostatic lesions in CT-based High-dose-rate prostate brachytherapy. Br J Radiol. 2019;92:20190089. [DOI] [PMC free article] [PubMed] [Google Scholar]
- 6.Holly R, Morton GC, Sankreacha R, et al. Use of cone-beam imaging to correct for catheter displacement in high dose-rate prostate brachytherapy. Brachytherapy. 2011;10:299–305. [DOI] [PubMed] [Google Scholar]
- 7.Schmid M, Crook JM, Batchelar D, et al. A phantom study to assess accuracy of needle identification in real-time planning of ultrasound-guided high-dose-rate prostate implants. Brachytherapy. 2013;12:56–64. [DOI] [PubMed] [Google Scholar]
- 8.Lindegaard JC, Madsen ML, Traberg A, et al. Individualised 3D printed vaginal template for MRI guided brachytherapy in locally advanced cervical cancer. Radiother Oncol. 2016;118:173–175. [DOI] [PubMed] [Google Scholar]
- 9.Younes H, Voros S, Troccaz J. Automatic needle localization in 3D ultrasound images for brachytherapy. Paper presented at: IEEE International Symposium on Biomedical Imaging (ISBI 2018); 2018. [Google Scholar]
- 10.Mehrtash A, Ghafoorian M, Pernelle G, et al. Automatic needle segmentation and localization in MRI With 3-D convolutional neural networks: application to MRI-targeted prostate biopsy. IEEE Trans Med Imaging. 2018;38:1026–1036. [DOI] [PMC free article] [PubMed] [Google Scholar]
- 11.Uherčík M, Kybic J, Liebgott H, Cachard C. Model fitting using RANSAC for surgical tool localization in 3-D ultrasound images. IEEE Trans Biomed Eng. 2010;57:1907–1916. [DOI] [PubMed] [Google Scholar]
- 12.Tiong A, Bydder S, Ebert M, et al. A small tolerance for catheter displacement in high–dose rate prostate brachytherapy is necessary and feasible. Int J Radiat Oncol*Biol*Phys. 2010;76:1066–1072. [DOI] [PubMed] [Google Scholar]
- 13.Pourtaherian A, Scholten HJ, Kusters L, et al. Medical instrument detection in 3-dimensional ultrasound data volumes. IEEE Trans Med Imaging. 2017;36:1664–1675. [DOI] [PubMed] [Google Scholar]
- 14.Zhao Y, Cachard C, Liebgott H. Automatic needle detection and tracking in 3D ultrasound using an ROI-based RANSAC and Kalman method. Ultrason Imaging. 2013;35:283–306. [DOI] [PubMed] [Google Scholar]
- 15.Beigi P, Rohling R, Salcudean T, Lessoway VA, Ng GC. Detection of an invisible needle in ultrasound using a probabilistic SVM and time-domain features. Ultrasonics. 2017;78:18–22. [DOI] [PubMed] [Google Scholar]
- 16.Daoud MI, Alshalalfah A-L, Mohamed OA, Alazrai R. A hybrid camera-and ultrasound-based approach for needle localization and tracking using a 3D motorized curvilinear ultrasound probe. Med Imag Analy. 2018;50:145–166. [DOI] [PubMed] [Google Scholar]
- 17.LeCun Y, Bengio Y, Hinton G. Deep learning. Nature. 2015;521:436. [DOI] [PubMed] [Google Scholar]
- 18.Esteva A, Robicquet A, Ramsundar B, et al. A guide to deep learning in healthcare. Nat Med. 2019;25:24. [DOI] [PubMed] [Google Scholar]
- 19.Wang G, Zuluaga MA, Li W, et al. DeepIGeoS: a deep interactive geodesic framework for medical image segmentation. IEEE Trans Pattern Anal Mach Intell. 2018;41:1559–1572. [DOI] [PMC free article] [PubMed] [Google Scholar]
- 20.Lei Y, Tian S, He X, et al. Ultrasound prostate segmentation based on multidirectional deeply supervised V-Net. Med Phys. 2019;46:3194–3206. [DOI] [PMC free article] [PubMed] [Google Scholar]
- 21.Wang T, Lei Y, Tian S, et al. Learning-based automatic segmentation of arteriovenous malformations on contrast CT images in brain stereotactic radiosurgery. Med Phys. 2019;46:3133–3141. [DOI] [PMC free article] [PubMed] [Google Scholar]
- 22.Wang B, Lei Y, Tian S, et al. Deeply supervised 3D fully convolutional networks with group dilated convolution for automatic MRI prostate segmentation. Med Phys. 2019;46:1707–1718. [DOI] [PMC free article] [PubMed] [Google Scholar]
- 23.Wang T, Lei Y, Tang H, et al. A learning-based automatic segmentation and quantification method on left ventricle in gated myocardial perfusion SPECT imaging: a feasibility study. J Nucl Cardiol. 2019;1–12. [DOI] [PMC free article] [PubMed] [Google Scholar]
- 24.Levine AB, Schlosser C, Grewal J, Coope R, Jones SJ, Yip S. Rise of the machines: advances in deep learning for cancer diagnosis. Trends Cancer. 2019;5:157–169. [DOI] [PubMed] [Google Scholar]
- 25.Pourtaherian A, Zanjani FG, Zinger S, Mihajlovic N, Ng GC, Korsten HH. Robust and semantic needle detection in 3D ultrasound using orthogonal-plane convolutional neural networks. Int J Comput Assist Radiol Surg. 2018;13:1321–1333. [DOI] [PMC free article] [PubMed] [Google Scholar]
- 26.Pourtaherian A, Mihajlovic N, GhazvinianZanjani F, et al. Localization of partially visible needles in 3D ultrasound using dilated CNNs. Paper presented at: IEEE International Ultrasonics Symposium (IUS)2018; 2018. [Google Scholar]
- 27.Çiçek Ö, Abdulkadir A, Lienkamp SS, Brox T, Ronneberger O. 3D U-Net: learning dense volumetric segmentation from sparse annotation. Paper presented at: International Conference on Medical Image Computing and Computer-Assisted Intervention; 2016 [Google Scholar]
- 28.Zhang Y, He X, Tian Z, et al. Multi-needle detection in 3D ultrasound images using unsupervised order-graph regularized sparse dictionary learning. IEEE Trans Med Imaging. 2020. 10.1109/TMI.2020.2968770 [DOI] [PMC free article] [PubMed] [Google Scholar]
- 29.Ronneberger O, Fischer P, Brox T. U-net: Convolutional networks for biomedical image segmentation. Paper presented at: International Conference on Medical Image Computing and Computer-Assisted Intervention; 2015 [Google Scholar]
- 30.Falk T, Mai D, Bensch R, et al. U-Net: deep learning for cell counting, detection, and morphometry. Nat Methods. 2019;16:67. [DOI] [PubMed] [Google Scholar]
- 31.Oktay O, Schlemper J, Folgoc LL, et al. Attention u-net: Learning where to look for the pancreas. arXiv preprint arXiv:180403999. 2018. [Google Scholar]
- 32.Roth HR, Lu L, Lay N, et al. Spatial aggregation of holistically-nested convolutional neural networks for automated pancreas localization and segmentation. Med Imag Analy. 2018;45:94–107. [DOI] [PubMed] [Google Scholar]
- 33.Rudin LI, Osher S, Fatemi E. Nonlinear total variation based noise removal algorithms. Physica D. 1992;60:259–268. [Google Scholar]
- 34.Ehrhardt MJ, Betcke MM. Multicontrast MRI reconstruction with structure-guided total variation. SIAM J Imaging Sci. 2016;9:1084–1106. [Google Scholar]
- 35.Vishnevskiy V, Gass T, Szekely G, Tanner C, Goksel O. Isotropic total variation regularization of displacements in parametric image registration. IEEE Trans Med Imaging. 2016;36:385–395. [DOI] [PubMed] [Google Scholar]
- 36.Liu J, Sun Y, Xu X, Kamilov US. Image restoration using total variation regularized deep image prior. Paper presented at: IEEE International Conference on Acoustics, Speech and Signal Processing (ICASSP); 2019 [Google Scholar]
- 37.Lee C-Y, Xie S, Gallagher P, Zhang Z, Tu Z. Deeply-supervised nets. Paper presented at: Artificial Intelligence and Statistics; 2015. [Google Scholar]
- 38.Zhang Y, Chung AC. Deep supervision with additional labels for retinal vessel segmentation task. Paper presented at: International Conference on Medical Image Computing and Computer-Assisted Intervention; 2018 [Google Scholar]
- 39.Zhang Y, Liu S, Shang X, Xiang M. Low-rank graph regularized sparse coding. Paper presented at: Pacific Rim International Conference on Artificial Intelligence; 2018 [Google Scholar]


