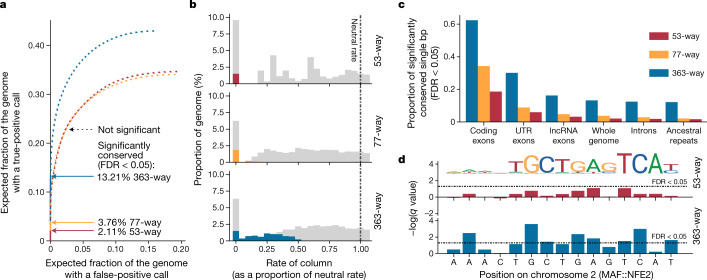
Fig. 3. Denser phylogenomic sequencing increases the power to detect selective constraints.
Results are shown from 3 alignments for 53 birds, 77 vertebrates, and 363 birds. a, Proportion of alignment columns labelled as conserved. The cumulative portion of the genome with a conserved call is shown, starting from the column with the smallest P value and proceeding to the columns with the highest P values. The dotted lines show the path after hitting the false-discovery rate (FDR) P value cutoff of 0.05, below which calls are significant (marked by arrows). b, Histograms of the rate of alignment columns evolving slower relative to the neutral rate (labelled 1.00). Coloured areas indicate significantly conserved columns, and light grey areas indicate non-significantly conserved columns. A rate of zero contains a relatively high proportion of recent insertions present in only a few species; there is limited statistical power to classify such insertions. c, Proportion of various functional regions of the chicken genome that contain single-bp conserved elements in the large alignment compared to alignments with fewer species. UTR, untranslated region. d, An example of a MAF::NFE2 motif overlaid on one of its predicted binding sites demonstrates the high resolution of our conserved site predictions and the increased power to predict conservation in the larger alignment.

