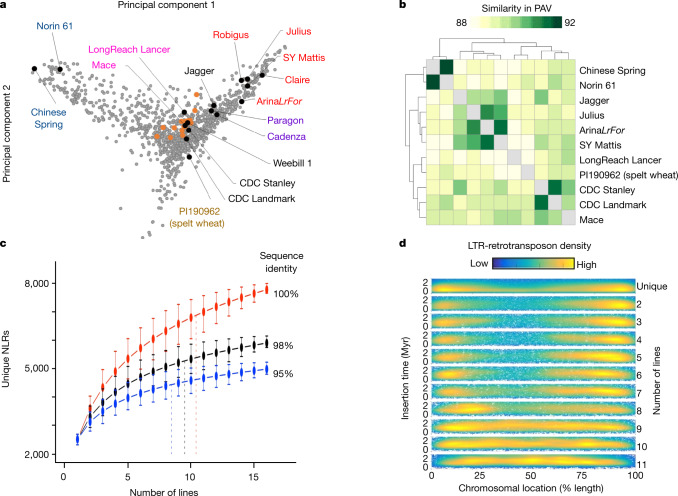
Fig. 1. Patterns of variation in the wheat genome.
a, Principal component analysis of polymorphisms from exome-capture sequencing of about 1,200 lines (grey markers), 16 lines from whole-genome shotgun resequencing (orange markers) and our new assemblies (black markers). Text colours reflect different geographical locations and winter or spring growth. b, Dendrogram of pairwise Jaccard similarities for gene PAV between all RQA assemblies. c, Number of unique NLRs at different per cent identity cut-offs as the number of genomes increases. Dashed vertical lines represent 90% of the NLR complement. Markers indicate the mean values of all permutations of the order of adding genomes. Whiskers show maximum and minimum values based on one million random permutations. d, Chromosomal location versus insertion age distribution of unique to (reading downward) increasingly shared syntenic full-length LTR retrotransposons.

