Abstract
There is an increasing need for improved endpoints to assess clinical trial effects in Parkinson’s disease. We propose the Parkinson’s Disease Comprehensive Response as a novel weighted composite endpoint integrating changes measured in three established Parkinson’s outcomes, including: OFF state Movement Disorder Society Unified Parkinson’s Disease Rating Scale Motor Examination scores; Motor Experiences of Daily Living scores; and total good-quality ON time per day. The data source for the initial development of the composite described herein was a recent Phase II trial of glial cell line-derived neurotrophic factor. A wide range of clinically derived relative weights was assessed to normalize for differentially scoring base rates with each endpoint component. The Parkinson’s disease comprehensive response, in contrast to examining practically defined OFF state Unified Parkinson’s Disease Rating Scale Motor Examination scores alone, showed stability over 40 weeks in placebo patients, and all 432 analyses in this permutation exercise yielded significant differences in favour of glial cell line-derived neurotrophic factor. The findings were consistent with results obtained employing three different global statistical test methodologies and with patterns of intra-patient change. Based on our detailed analyses, we conclude it worth prospectively evaluating the clinical utility, validity and regulatory feasibility of using clinically supported final Parkinson’s disease comprehensive response formulas (for both the Unified Parkinson’s Disease Rating Scale-based and Movement Disorders Society-Unified Parkinson’s Disease Rating Scale-based versions) in future disease-modifying Parkinson’s trials. Whilst the data source employed in the initial development of this weighted composite score is from a recent Phase II trial of glial cell line-derived neurotrophic factor, we wish to stress that the results are not described to provide post hoc evidence of the efficacy of glial cell line-derived neurotrophic factor but rather are presented to further the debate of how current regulatory approved rating scales may be combined to address some of the recognized limitations of using individual scales in isolation.
Keywords: Parkinson’s disease, outcome assessment, glial cell line-derived neurotrophic factor (GDNF), neurorestoration, Parkinson’s disease comprehensive response (PDCORE)
We need improved endpoints to assess neurorestorative therapies in Parkinson’s. We propose the Parkinson’s disease comprehensive response as a novel weighted composite endpoint. The data are presented to further the debate of how regulatory approved rating-scales may be combined to address some of the limitations of individual scales in isolation.
Graphical Abstract
Graphical Abstract.
Introduction
Parkinson’s disease is a multifaceted disorder, with a broad spectrum of clinical symptoms including motor, cognitive, behavioural, and autonomic aspects. The diversity of the condition makes it difficult to assess potential treatment benefits in a standardized way that is adequately balanced across the entire disease spectrum and acceptable to regulatory agencies. Even if focusing on a single functional domain, i.e. motor performance, employing just a single scale or subscale may increase noise, particularly in small cohort investigations (Evers et al., 2019). The complexity of the challenge is potentially illustrated by several observations in the ongoing Parkinson’s therapeutic development program involving glial cell line-derived neurotrophic factor (GDNF).
As part of the program, two Phase 2 studies testing intermittent bilateral intraputamenal administration of GDNF have recently been completed, a 40-week placebo-controlled, randomized, double-blind study and a subsequent 40-week open-label, all-active extension study (Whone et al., 2019a, b). Neither of the studies met its primary clinical endpoint, percentage change from baseline in the OFF state Unified Parkinson’s Disease Rating Scale (UPDRS) motor score (Part 3), or any secondary clinical endpoint. Both studies were therefore correctly reported as negative. However, GDNF, as compared to placebo, induced a marked, statistically significant increase in 18F-DOPA Positron Emission Tomography (PET) uptake throughout the putamen, and results for key clinical endpoints including the OFF state UPDRS motor score, OFF state UPDRS activities of daily living (ADL) score (Part 2), and total good-quality ON time per day consistently favoured GDNF numerically at every post-baseline time-point. In addition, the concordance within individual patients between these endpoints was greater in those who were on GDNF throughout the program versus those who received placebo followed by GDNF (Whone et al., 2019b).
Based on the aggregate available data, regulatory agencies both in the USA and Europe endorsed moving into Phase 3 with a single placebo-controlled pivotal study of 80 weeks duration. However, primary endpoint recommendations were discordant, with change from baseline in the OFF state Movement Disorder Society (MDS)-sponsored revision to the UPDRS motor score, the MDS-UPDRS Motor Examination score (Part 3), being recommended in the USA and change from baseline in total good-quality ON time per day in Europe.
We developed and now propose a novel weighted composite endpoint which combines the two agency-recommended endpoints with the change from baseline in the OFF state MDS-UPDRS Motor Experiences of Daily Living score (Part 2) to provide a broader, integrated view of unmasked motor disease. A composite combining an objectively assessed motor examination with two patient-reported outcome measures that reflect the day-to-day reality of how much time a patient spends OFF, and the impact on motor function in daily life when in the OFF state, may have utility in future trials. This report summarizes initial efforts exploring this combined endpoint, the Parkinson’s disease comprehensive response (PDCORE), which has been optimized based on model fit using clinical criteria.
Materials and methods
Data source
The details of the GDNF Phase 2 studies that constituted the data source for this work have recently been published (Whone et al., 2019a, b). In brief, in the parent study, 41 patients with moderately advanced Parkinson’s disease underwent neurosurgical implantation of a customized drug delivery device and were then randomized to receive intraputamenal GDNF or placebo infusions every 4 weeks for a total of 40 weeks (Whone et al., 2019a). Subsequently, all study completers had the option to enrol in an open-label extension study where everyone received GDNF for another 40 weeks (Whone et al., 2019b). Conventional UPDRS scores and patient-reported outcomes were assessed every 8 weeks throughout the studies (18F-DOPA uptake at baseline and Week 40).
PDCORE development
Change from baseline in the OFF state UPDRS motor and ADL scores, together with a change from baseline in total good-quality ON time (Hauser et al., 2000), was initially selected for inclusion in the PDCORE. The components were normalized for differentially scoring base rates by assigning relative weights based on thresholds for clinically important differences (CIDs) that were considered clinically comparable, starting with 10 points for the motor score, 5 points for the ADL score, and 1.67 h (100 min) for good-quality ON time. Due to the different direction of clinically positive changes in good-quality ON time versus the other two components, values for this endpoint were multiplied by −1 for inclusion in the composite.
Exploratory analyses were undertaken to understand the impact of employing different weightings on the individual components and determine a final version of the PDCORE (see Supplementary Appendix A, for the statistical analysis plan). Secondary objectives included (i) comparing the performance of the PDCORE with a multivariate analysis of the individual components via the global statistical test (GST) procedure (O’Brien, 1984), (ii) assessing the performance of a modified PDCORE based upon the Motor Examination and Motor Experiences of Daily Living (Motor Experiences of Daily Living) sections of the MDS-UPDRS score, and (iii) assessing the performance of the PDCORE in a separate earlier randomized, placebo-controlled study of GDNF in patients with Parkinson’s disease (Lang et al., 2006).
Three distinct threshold values for each UPDRS component and four values for change in good-quality ON time were derived from established CID ranges (Shulman et al., 2010; Hauser et al., 2014; Ferreira et al., 2016; Lees et al., 2017; Schapira et al., 2017). The proposed threshold values for change in good-quality ON time were corroborated via a prospective online survey that was conducted by Dr. Jon Stamford at The Cure Parkinson’s Trust, London, UK, amongst 217 patients with Parkinson’s disease. Detailed results of this survey will be published elsewhere. Notably, 10.0, 10.8, and 11.5 points were used for change in the OFF state UPDRS motor score, 4.4, 5.0, and 5.9 points for change in the OFF state UPDRS ADL score, and 1.5, 1.67, 2.0, and 2.2 h for change in good-quality ON time (for rationale, see statistical analysis plan). Corresponding values for change in the OFF state MDS-UPDRS Motor Examination score were 12.0, 13.0, and 13.8 points, while those for change in the OFF state Motor Experiences of Daily Living score were 4.8, 5.5, and 6.5 points (Hoehn and Yahr ≤2), 4.6, 5.3, and 6.2 points (Hoehn and Yahr 2.5), and 4.4, 5.0, and 5.9 points (Hoehn and Yahr 3), respectively using published UPDRS to MDS-UPDRS conversion algorithms (Goetz et al., 2012). With this, a total of 36 (3 × 3 × 4) possible permutations for each, the PDCORE and the MDS-UPDRS-based PDCORE were obtained per time-point.
Statistical analysis
The PDCORE at Week 40 was the primary endpoint. The primary analysis was based on a mixed model for repeated measures including all time-points up to Week 80, with baseline PDCORE as a covariate, treatment sequence, visit and their interaction as fixed effects, and subject-within-treatment-sequence as a random effect. Differences between treatment sequences at Weeks 16 and 40 were estimated via least squares (LS) means and related 95% confidence intervals (CIs). The Week-80-PDCORE for patients who received GDNF in both studies (GDNF/GDNF sequence) was compared with the Week-40-PDCORE for patients who received a placebo in the parent study and were switched to GDNF in the extension study (placebo/GDNF sequence). As this was an exploratory study, no corrections for multiple comparisons were performed.
As part of the secondary analyses, the above models were repeated for the MDS-UPDRS-based PDCORE. To test for sensitivity, all analyses were replicated after removing baseline PDCORE from the list of covariates. In addition, intra-patient analyses of change were performed for the final version of the PDCORE and the individual endpoint components. For the GST analyses, three different methodologies were used: modified generalized LS, ordinary LS, and ranked sum (O’Brien, 1984; Tang et al., 1993). Each methodology was performed using the raw (unweighted) PDCORE components in triplicate and pairwise combinations as well as separately at Weeks 16, 40, and 80 (after correcting for the difference in directionality of clinically positive changes).
After determining the optimized PDCORE formula based on model fit with clinical criteria, summary statistics were calculated and the impact on the selected model of several covariates including age, sex, L-dopa responsiveness at baseline, OFF state UPDRS motor score at screening, OFF state Hoehn and Yahr stage at screening, time since the first symptom, time since diagnosis, and 18F-DOPA uptake at baseline was explored using a mixed model for repeated measures similar to that used for the primary analysis. Furthermore, assuming that clinical change may temporally lag behind the biological change (Whone et al., 2019b), the GDNF/GDNF sequence was analysed for a potential correlation between change from baseline to Week 40 in 18F-DOPA uptake and change from Week 40 to Week 80 in the final PDCORE, using Fisher’s Z transformation of the sample correlation coefficient to obtain Pearson’s correlation estimate (r).
To explore the advantage of using the PDCORE versus an unweighted combination of its components, the final PDCORE formula was retrospectively assessed in terms of its power to detect a relevant difference between treatment groups at Week 40 using the observed differences and covariances across individual components, adopting a recently published method for a fixed-weight approach (Jin et al., 2019).
The final (optimized) model was also used to assess the performance of the PDCORE in a prior randomized, placebo-controlled study of GDNF in Parkinson’s disease which, like the current studies, did not meet its primary and secondary clinical endpoints (Lang et al., 2006). Based on the assumption that the observed lack of efficacy in the latter study was due to insufficient drug distribution in the putamen (Salvatore et al., 2006; Whone et al., 2019a), it was hypothesized a priori that the PDCORE would not yield positive results when reassessing this dataset.
All analyses were performed using SAS® 9.3 (SAS/STAT 12.1 and SAS/IML 12.1). GST methodologies were implemented by adapting the %GlobTest SAS macro previously described (Dmitrienko et al., 2007). Unless otherwise specified, all tests were two-sided and performed at an alpha level of 0.05, and all CIs are presented at the 95% level.
Data availability
The data that support the development of PDCORE are available from the corresponding author upon request.
Results
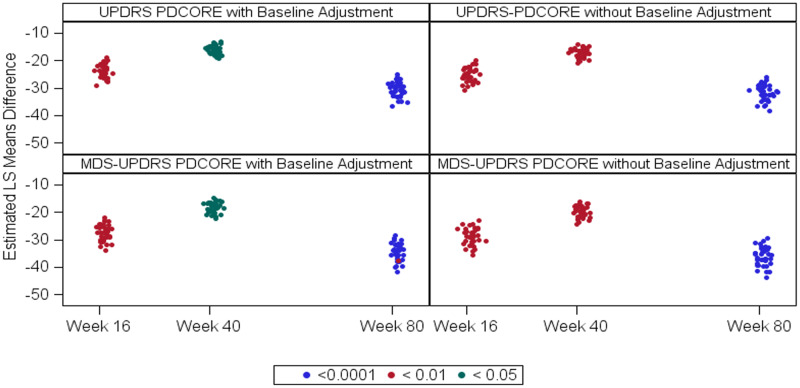
A total of 432 analyses were performed by running four complete analysis sets (using both the conventional UPDRS scores and the respective MDS-UPDRS scores with and without adjustment for baseline) on all 36 possible PDCORE permutations at three distinct time-points. All results were statistically significant in favour of GDNF (see Fig. 1 and Supplementary Appendix B, for a mixed model for repeated measures statistical output). The baseline-adjusted PDCORE analysis showed substantial LS mean improvements in GDNF-treated patients of at least −18.81 points at Week 16 (95% CI: −26.255, −11.358), −16.70 points at Week 40 (95% CI: −23.836, −9.569), and −28.77 points at Week 80 (95% CI: −37.592, −19.957), whereas no LS mean changes were seen in placebo-treated patients (maximum at Week 16: −0.06 points, 95% CI: −8.504, 8.390; maximum at Week 40: −4.29 points, 95% CI: −13.203, 4.614).
Figure 1.
Scatter plot of PDCORE LS mean differences. The figure summarizes the results of all 432 analyses performed as part of the permutation exercise. The analyses were done in four separate sets of PDCOREs including either conventional UPDRS scores or the respective MDS-UPDRS scores with or without adjustment for the baseline values. Each graph represents a complete set of 108 analyses using three threshold values for each UPDRS component and four threshold values for change in good-quality ON time at three time-points. Each point in the graphs represents the result of one analysis, with the position of the point on the x-axis indicating the time-point, the position on the y-axis indicating the magnitude of the estimated effect (LS mean difference), and the colour indicating the level of statistical significance.
The minimum LS mean differences between the treatment sequences were −19.06 points at Week 16 (95% CI: −29.950, −8.172; P = 0.0011), −13.09 points at Week 40 (95% CI: −23.434, −2.746; P = 0.0146), and −25.16 points for the comparison of Week 80 GDNF/GDNF versus Week 40 placebo (95% CI: −36.523, −13.801; P < 0.0001). The differences between the results for the PDCORE and the MDS-UPDRS-based PDCORE were small, as expected in view of the largely linear conversion. Notably, removing baseline PDCORE as a covariate from the model did not appreciably alter the results for either PDCORE version. Similarly, the GST analyses were statistically significant in favour of GDNF with all three methodologies and at all time-points for all triple combinations and most of the pairwise combinations (see Supplementary Appendix C for GST statistical output).
As these results did not pose any relevant restrictions (i.e. all tested thresholds led to a composite score that was qualitatively and to a great extent quantitatively consistent across all permutations), the selection of threshold values for the PDCORE components within the boundaries of the tested permutations was made based on clinical considerations. The following optimized values were selected:
OFF state UPDRS motor score: 10.8 points; this value was previously proposed as a large CID (Shulman et al., 2010).
OFF state UPDRS ADL score: 5.2 points; this value is the midpoint of the calculated range of 4.4–5.9 points for large CIDs in ADL (Shulman et al., 2010), and equivalent to 10.8 motor points based on maximum possible values for the UPDRS motor (108) and ADL (52) scores.
Good-quality ON time: 1.67 h; this value is consistent with changes in OFF time that were previously proposed as substantial clinical differences (Hauser et al., 2014), and with improvements in good-quality ON time that led to the registration of opicapone (Ferreira et al., 2016; Lees et al., 2017) and safinamide (Schapira et al., 2017). Furthermore, 1.67 h is close to the midpoint of the range specified by participants in The Cure Parkinson’s online survey (93–120 min).
With these threshold values, the final PDCORE formula reads as follows:
(x: change in UPDRS motor score; y: change in UPDRS ADL score; z: change in good-quality ON time).
For the MDS-UPDRS-based PDCORE, the following formulas were derived:
Hoehn and Yahr ≤2: PDCORE = 1x + 13.0/5.7y − 13.0/1.67z = 1x + 2.28y − 7.78z
Hoehn and Yahr 2.5: PDCORE = 1x + 13.0/5.5y − 13.0/1.67z = 1x + 2.36y − 7.78z
Hoehn and Yahr 3: PDCORE = 1x + 13.0/5.2y − 13.0/1.67z = 1x + 2.50y – 7.78z
(x: change in MDS-UPDRS Motor Examination score; y: change in MDS-UPDRS Motor Experiences of Daily Living score; z: change in good-quality ON time).
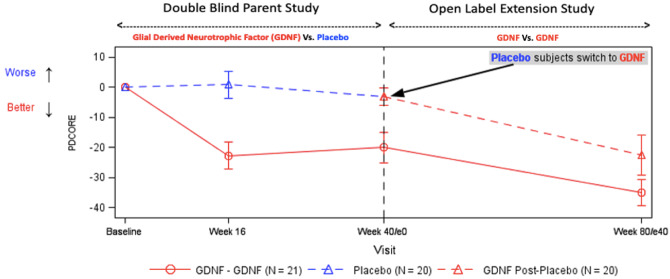
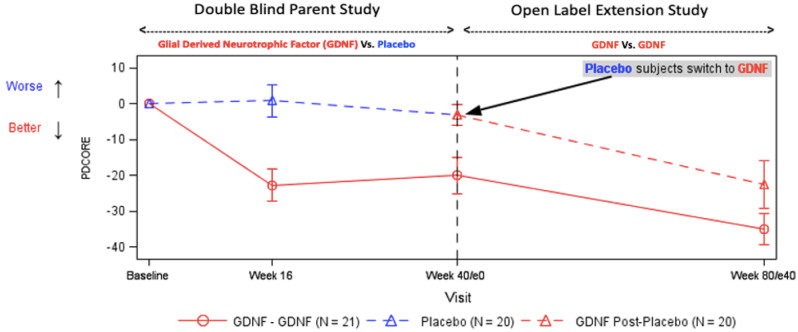
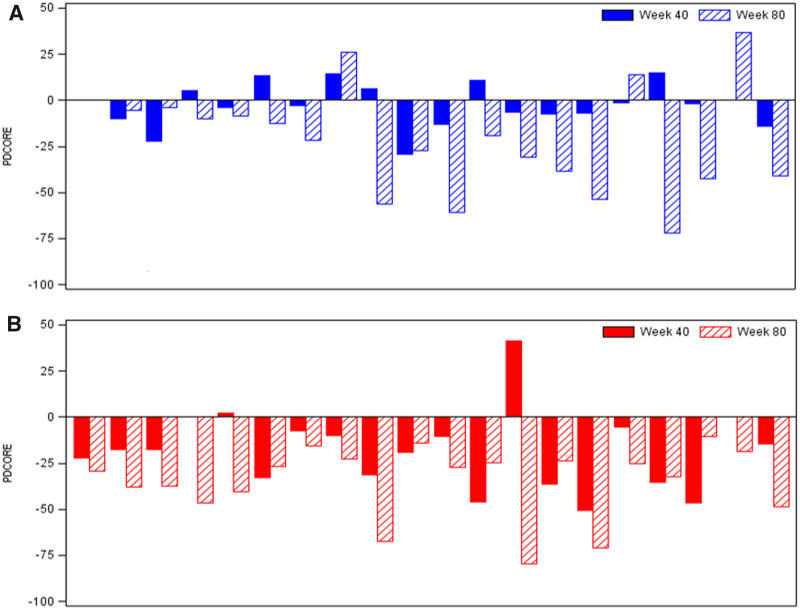
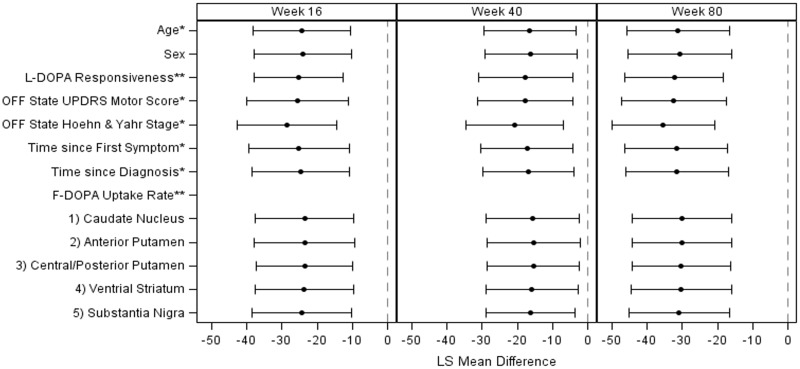
Figure 2 presents the profile of the final PDCORE over time, Fig. 3 the intra-patient change in the final PDCORE and Fig. 4 the individual PDCORE components (without weighting), and Fig. 5 the results of the covariate analyses using the final PDCORE. The correlation analysis in the GDNF/GDNF sequence suggested a relationship between change from baseline to Week 40 in 18F-DOPA uptake and change from Week 40 to Week 80 in the final PDCORE both in the anterior and central/posterior putamenal regions of interest [r = −0.552 (95% CI: −0.810, −0.114; P = 0.0135) and r = −0.434 (95% CI: −0.749, 0.041; P = 0.0638), respectively] – potentially suggesting a clinical composite score/biomarker tie-up.
Figure 2.
Profile of the final PDCORE over time. Data points represent means, and error bars represent standard errors. The baseline PDCORE was artificially set to 0 for both sequences. One GDNF patient was involved in a car accident during the study and was excluded from the analysis due to a conus injury preventing several parts of the UPDRS at different time-points from being completed. Two patients in each sequence had missing values for good-quality ON time at Week 40 (one placebo/GDNF patient also at Week 80) and were excluded from the respective analyses. Treatment differences were significant at P = 0.0009 at Week 16, P = 0.0136 at Week 40, and P < 0.0001 for the comparison of Week 80 GDNF/GDNF versus Week 40 placebo.
Figure 3.
Intra-patient change in the final PDCORE. The final PDCORE was calculated as 1x + 10.8/5.2y − 10.8/1.67z = 1x + 2.08y − 6.47z (x: change from baseline in OFF state UPDRS motor score; y: change from baseline in OFF state UPDRS ADL score; z: change in total good-quality ON time per day). Negative PDCORE values are indicative of clinical improvement. (A) Placebo/GDNF sequence. Patients received placebo between baseline and Week 40 (randomized, double-blind), followed by GDNF between Week 40 and Week 80 (open-label) (Whone et al., 2019a, b). Two patients had missing values for good-quality ON time at Week 40 and one at Week 80 and were excluded from the respective analyses. The distribution of the PDCORE values across placebo patients at Week 40 appears to be heterogeneous, with limited response in approximately half of the patients. In contrast, at Week 80 (placebo/GDNF), a more homogeneous pattern of negative PDCORE values emerges. (B) GDNF/GDNF sequence. Patients received GDNF both between baseline and Week 40 (randomized, double-blind) and between Week 40 and Week 80 (open-label) (Whone et al., 2019a, b). One patient was involved in a car accident during the study and was excluded from the analysis due to a conus injury preventing several parts of the UPDRS at different time-points from being completed. Two other patients had missing values for good-quality ON time at Week 40 and were excluded from the analysis. The distribution of the PDCORE values across GDNF patients at Week 40 appears to be similar to the pattern observed in patients of the placebo/GDNF sequence at Week 80, with further improvements incurred by Week 80. Of note, all patients in the GDNF/GDNF sequence had a negative PDCORE value (indicating clinical improvement) at Week 80.
Figure 4.
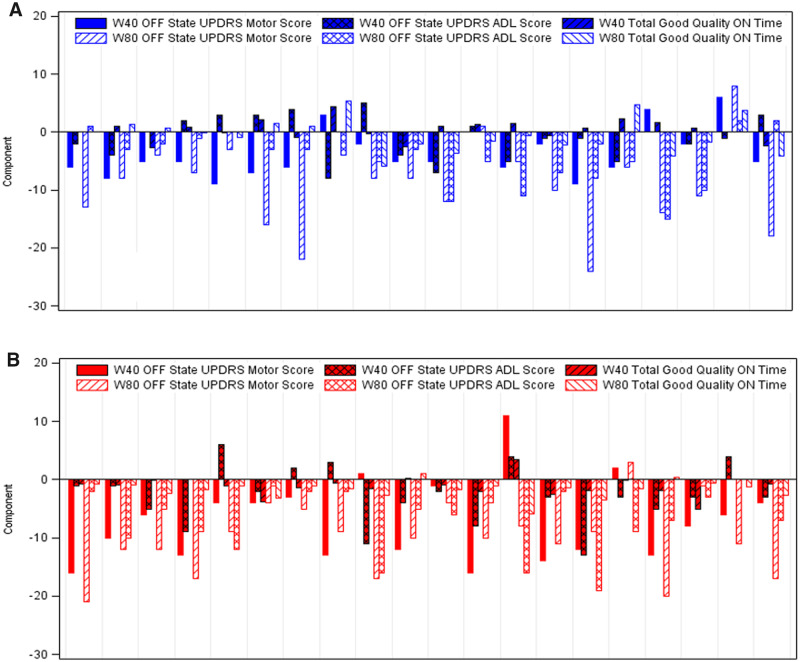
Intra-patient change in the individual PDCORE components. Negative values are indicative of clinical improvement (values for good-quality ON time were multiplied by −1 before the analysis). (A) Placebo/GDNF sequence. Patients received placebo between baseline and Week 40 (randomized, double-blind), followed by GDNF between Week 40 and Week 80 (open-label) (Whone et al., 2019a, b). Two patients were excluded from the analysis at Week 40 and one at Week 80 due to missing values for good-quality ON time. The response pattern across endpoints and patients at Week 40 appears to be discordant and heterogeneous, and responses, where noticeable, are limited. In contrast, at Week 80, a more concordant and homogeneous response pattern emerges. (B) GDNF/GDNF sequence. Patients received GDNF both between baseline and Week 40 (randomized, double-blind) and between Week 40 and Week 80 (open-label) (Whone et al., 2019a, b). One patient was involved in a car accident during the study and was excluded from the analysis due to a conus injury preventing several parts of the UPDRS at different time-points from being completed. Two other patients had missing values for good-quality ON time at Week 40 and were excluded from the respective analysis. The response pattern across endpoints and patients at Week 40 appears to be similar to the pattern observed in patients of the placebo/GDNF sequence at Week 80, with further concordant improvements incurred by Week 80. Of note, all but three patients in this sequence had values ≤0 (indicating clinical improvement) for all three endpoints at Week 80.
Figure 5.
Covariate analyses using the final PDCORE. Note: *measured at screening, **measured at baseline. The impact on the PDCORE of the covariates was explored using a similar MMRM as the one described for the primary analysis. Adjustment for OFF state Hoehn and Yahr stage at screening appeared slightly to improve the results; no other covariate was found to have a relevant impact on the results or improve the model fit. MMRM = mixed model for repeated measures
The post hoc power assessment returned one-sided power estimates of 84% and 66% for the weighted and unweighted test statistics, respectively, and two-sided power estimates of 75% and 54% (weighted and unweighted) at a 5%-significance level.
Applying the final baseline-adjusted PDCORE model to the first Phase 2 study of GDNF in Parkinson’s disease (Lang et al., 2006) yielded no evidence of a significant LS mean difference either at 3 months (−18.475, 95% CI: −37.602 to 0.651; P = 0.0578) or at 6 months (−6.149, 95% CI: −30.129 to 17.830; P = 0.6050).
Discussion
It has become increasingly clear that neither using a single MDS-UPDRS subscale nor all four domains can adequately capture the patient-experience, and thus broader endpoints are required to assess treatment effects (Huang et al., 2009; Stocchi et al., 2018; Evers et al., 2019).
The PDCORE is a novel weighted composite endpoint designed to integrate rater assessment of motor function in the practically defined OFF state, and its implications on the integrity of the nigrostriatal projection, with the patient’s reported perspective. Common composites like the MDS-UPDRS total score use the nominal values of the included sections which necessarily leads to skewing of the composite towards the section with the highest nominal value, typically the motor section. By contrast, the PDCORE components are normalized for the differential base rates based on published threshold values for large CIDs (Shulman et al., 2010; Hauser et al., 2014; Ferreira et al., 2016; Lees et al., 2017; Schapira et al., 2017).
This study provides insight into analyses employing PDCORE. It combines regulatory-recognized key endpoints including clinician-rated and patient-reported outcomes and has implications for future disease-modifying treatment trials. These PDCORE analyses represent an initial attempt to answer the crucial question of whether a CID can only be defined for a single outcome or also for a set of outcomes even though the differences for the individual outcomes may each be below the CID level.
The use of the PDCORE was explored over a wide range of relative weights for its three endpoint components. PDCORE showed stability over 40 weeks in placebo patients, and all 432 analyses in this permutation exercise yielded marked and statistically significant differences in favour of GDNF. The two treatment sequences were reliably discriminated at all three time-points tested, starting as early as 16 weeks into the parent study. The findings were consistent with the positive results obtained with the use of three different GST methodologies and by the different patterns of intra-patient change in the placebo/GDNF sequence as compared with the GDNF/GDNF sequence.
Based on the results of the present study, clinically supported final formulas were selected both for the UPDRS-based and MDS-UPDRS-based versions of the PDCORE. A post hoc power assessment of the final formula supported the proposed fixed weight approach by showing markedly improved power estimates for the weighted test statistic relative to the unweighted test statistic. Furthermore, we found that utilizing PDCORE did not change the outcome of an earlier failed GDNF Phase II study (Lang et al., 2006) – where there was no difference between GDNF vs placebo. This was unsurprising since study failure in that instance may have been primarily due to insufficient drug distribution in the putamen (Salvatore et al., 2006); a drug delivery problem which, as evidenced by 18F-DOPA uptake, was subsequently overcome (Whone et al., 2019a).
When proposing a new scale or new composite score, investigators would typically model from patients in large scale natural history cohorts (although using data from prior trials has the advantage of providing a placebo receiving group), and we recognize using data from a concluded study risks bias. The current PDCORE data, since they were derived post hoc, do not provide proof of efficacy for GDNF. However, what they do importantly suggest is that using PDCORE in future disease-modifying Parkinson’s trials (as a consistency-focused measure of broader disease presentation) offers a potential optimization of the way we use current clinical rating scales – reducing variance and minimizing placebo effects. To that end, it seems critical next to pursue validation for the PDCORE by obtaining regulatory permission to use it as a co-primary outcome (with a ‘gold standard’ measurement also as a co-primary) in the future trials of neuroprotective and neurorestorative agents in Parkinson’s disease.
Supplementary Material
Acknowledgements
The authors gratefully acknowledge the contribution of all participants in the studies used for this work. The authors thank Dr. Jon Stamford and Ms. Helen Matthews at The Cure Parkinson’s Trust for their contributions. Dr. Stamford designed and analysed the online survey that was used to corroborate the threshold for clinically important change in good-quality ON time, and Ms. Matthews was instrumental in executing the survey. The authors thank Dr. Howard Federoff for reviewing the manuscript and providing valuable feedback.
Funding
This research was funded by MedGenesis Therapeutix. The underlying Phase II study was funded by Parkinson’s UK (J-1102), with financial support from The Cure Parkinson’s Trust, and was sponsored by North Bristol NHS Trust. Study drug, additional project resources and supplementary funding was provided by MedGenesis Therapeutix, who in turn received program funding support from the Michael J. Fox Foundation for Parkinson’s Research. Renishaw plc manufactured the drug delivery device on behalf of North Bristol NHS Trust and provided additional technical and analytical support.
Competing interests
M.L. was, and E.M. is, employed by MedGenesis Therapeutix Inc., owners of the license for GDNF. Both have shares and share options with MedGenesis. N.B. is employed by Quanticate International Ltd, a contract research organization hired by MedGenesis for this work. G.T.S. is a consultant for MedGenesis. No other potential conflict of interest relevant to this article was reported.
Glossary
- ADL
= activities of daily living
- CI
= confidence interval
- CID
= clinically important difference
- GDNF
= glial cell line-derived neurotrophic factor
- GST
= global statistical test
- LS
= least squares
- MDS
= Movement Disorder Society
- PDCORE
= Parkinson’s disease comprehensive response
- UPDRS
= Unified Parkinson’s Disease Rating Scale
References
- Dmitrienko A, Chuang-Stein C, D’Agostino RB.. Pharmaceutical statistics using SAS: a practical guide. Cary, NC: SAS Institute; 2007. [Google Scholar]
- Evers LJW, Krijthe JH, Meinders MJ, Bloem BR, Heskes TM.. Measuring Parkinson’s disease over time: the real-world within-subject reliability of the MDS-UPDRS. Mov Disord 2019; 34: 1480–7. [DOI] [PMC free article] [PubMed] [Google Scholar]
- Ferreira JJ, Lees A, Rocha JF, Poewe W, Rascol O, Soares-da-Silva P.. Opicapone as an adjunct to levodopa in patients with Parkinson’s disease and end-of-dose motor fluctuations: a randomised, double-blind, controlled trial. Lancet Neurol 2016; 15: 154–65. [DOI] [PubMed] [Google Scholar]
- Goetz CG, Stebbins GT, Tilley BC.. Calibration of unified Parkinson’s disease rating scale scores to Movement Disorder Society-unified Parkinson’s disease rating scale scores. Mov Disord 2012; 27: 1239–42. [DOI] [PubMed] [Google Scholar]
- Hauser RA, Friedlander J, Zesiewicz TA, Adler CH, Seeberger LC, O'Brien CF, et al. A home diary to assess functional status in patients with Parkinson’s disease with motor fluctuations and dyskinesia. Clin Neuropharmacol 2000; 23: 75–81. [DOI] [PubMed] [Google Scholar]
- Hauser RA, Gordon MF, Mizuno Y, Poewe W, Barone P, Schapira AH, et al. Minimal clinically important difference in Parkinson’s disease as assessed in pivotal trials of pramipexole extended release. Parkinsons Dis 2014; 2014: 1–8. [DOI] [PMC free article] [PubMed] [Google Scholar]
- Huang P, Goetz CG, Woolson RF, Tilley B, Kerr D, Palesch Y, et al. Using global statistical tests in long-term Parkinson’s disease clinical trials. Mov Disord 2009; 24: 1732–9. [DOI] [PMC free article] [PubMed] [Google Scholar]
- Jin K, Cameron B, Dunn B.. On weighted composite scores for early Alzheimer’s trials. Pharm Stat 2019; 18: 239–47. [DOI] [PubMed] [Google Scholar]
- Lang AE, Gill S, Patel NK, Lozano A, Nutt JG, Penn R, et al. Randomized controlled trial of intraputamenal glial cell line-derived neurotrophic factor infusion in Parkinson disease. Ann Neurol 2006; 59: 459–66. [DOI] [PubMed] [Google Scholar]
- Lees AJ, Ferreira J, Rascol O, Poewe W, Rocha JF, McCrory M, et al. Opicapone as adjunct to levodopa therapy in patients with Parkinson disease and motor fluctuations: a randomized clinical trial. JAMA Neurol 2017; 74: 197–206. [DOI] [PubMed] [Google Scholar]
- O’Brien PC. Procedures for comparing samples with multiple endpoints. Biometrics 1984; 40: 1079–87. [PubMed] [Google Scholar]
- Salvatore MF, Ai Y, Fischer B, Zhang AM, Grondin RC, Zhang Z, et al. Point source concentration of GDNF may explain failure of phase II clinical trial. Exp Neurol 2006; 202: 497–505. [DOI] [PubMed] [Google Scholar]
- Schapira AH, Fox SH, Hauser RA, Jankovic J, Jost WH, Kenney C, et al. Assessment of safety and efficacy of safinamide as a levodopa adjunct in patients with Parkinson disease and motor fluctuations: a randomized clinical trial. JAMA Neurol 2017; 74: 216–24. [DOI] [PubMed] [Google Scholar]
- Shulman LM, Gruber-Baldini AL, Anderson KE, Fishman PS, Reich SG, Weiner WJ.. The clinically important difference on the unified Parkinson’s disease rating scale. Arch Neurol 2010; 67: 64–70. [DOI] [PubMed] [Google Scholar]
- Stocchi F, Radicati FG, Chaudhuri KR, Johansson A, Padmakumar C, Falup-Pecurariu C, et al. The Parkinson’s Disease Composite Scale: results of the first validation study. Eur J Neurol 2018; 25: 503–11. [DOI] [PubMed] [Google Scholar]
- Tang DI, Geller NL, Pocock SJ.. On the design and analysis of randomized clinical trials with multiple endpoints. Biometrics 1993; 49: 23–30. [PubMed] [Google Scholar]
- Whone AL, Boca M, Luz M, Woolley M, Mooney L, Dharia S, et al. Extended treatment with glial cell line-derived neurotrophic factor in Parkinson’s disease. J Parkinsons Dis 2019. b; 9: 301–13. [DOI] [PMC free article] [PubMed] [Google Scholar]
- Whone A, Luz M, Boca M, Woolley M, Mooney L, Dharia S, et al. Randomized trial of intermittent intraputamenal glial cell line-derived neurotrophic factor in Parkinson’s disease. Brain 2019. a; 142: 512–25. [DOI] [PMC free article] [PubMed] [Google Scholar]
Associated Data
This section collects any data citations, data availability statements, or supplementary materials included in this article.
Supplementary Materials
Data Availability Statement
The data that support the development of PDCORE are available from the corresponding author upon request.


