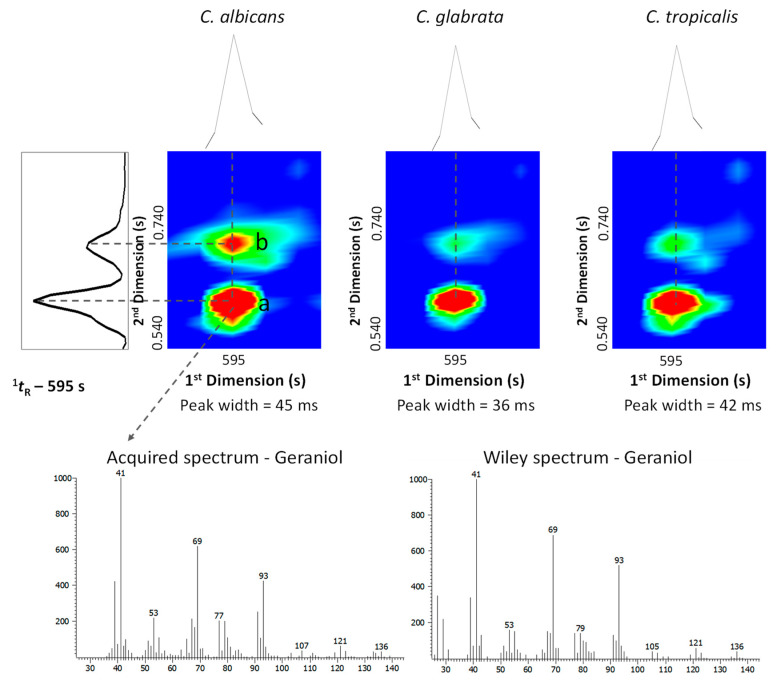
Figure 4.
Blow-up of a part of GC×GC chromatogram contour plots from the C. albicans, C. glabrata and C. tropicalis (12 h) showing the separation, through the 2D, of (a) geraniol (C10H18O) and (b) 2-isoamyl-6-methyl pyrazine (C10H16N2), metabolites that exhibited the same retention time in the 1D. The 36–45 milliseconds wide geraniol GC×GC peak was identified at a mass spectral acquisition of 100 spectra/s. The geraniol acquired mass spectrum presented a similarity value of 939/1000 compared to the Wiley database.

