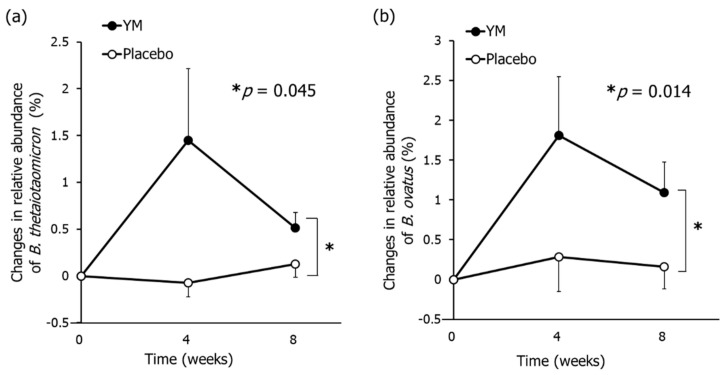
Figure 1.
Effects of YM intake on the relative abundance of B. thetaiotaomicron and B. ovatus in feces. Changes in relative abundance of B. thetaiotaomicron (a) and B. ovatus (b). The black circles represent the YM group and the white circles represent the placebo group. Data represent the means ± standard error (SE). The p-values were measured using repeated-measures analysis of variance (ANOVA) for the differences between groups without multiple comparison correction. Asterisks indicate overall significance between groups across time points (* p < 0.05).

