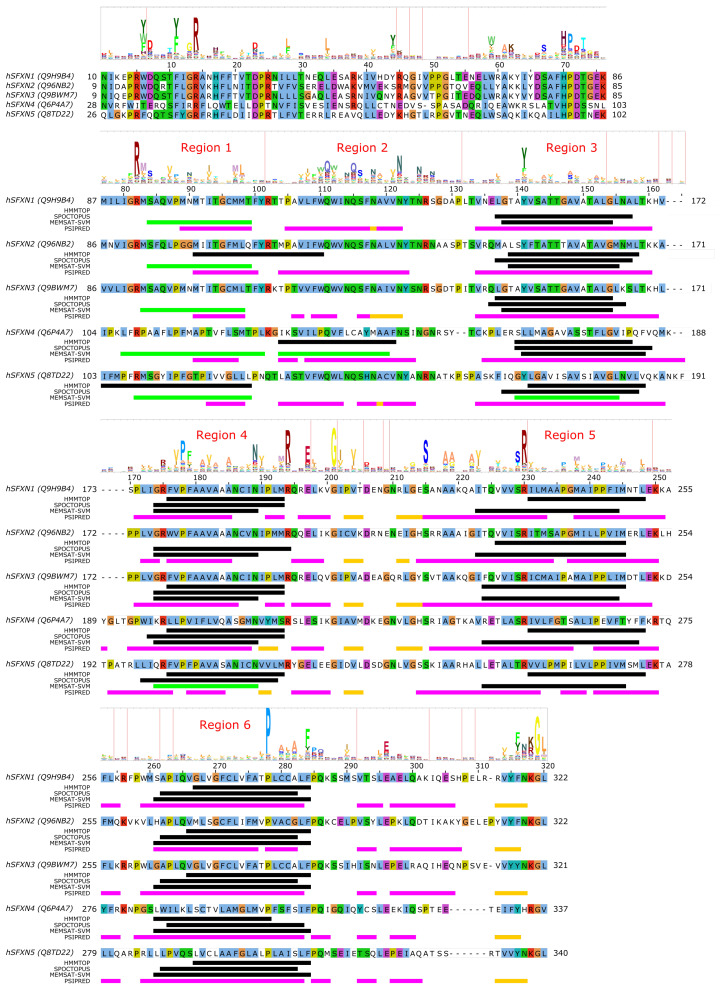
Figure 3.
Sequence analysis of human sideroflexin proteins (SLC56 family). The HMM logo is shown above the sequence alignment (see text). Vertical lines in the HMM logo show positions with non-zero insertion frequency. Transmembrane regions predicted by three different methods (HMMTOP, SPOCTOPUS, MEMSAT-SVM) are marked by black lines. Green lines mark transmembrane regions predicted to by pore-lining by MEMSAT-SVM. Secondary structure as predicted by PSIPRED is shown as magenta lines (-helix) and golden lines (-strand). Uniprot sequence identifiers are shown next to protein names for each sequence.

