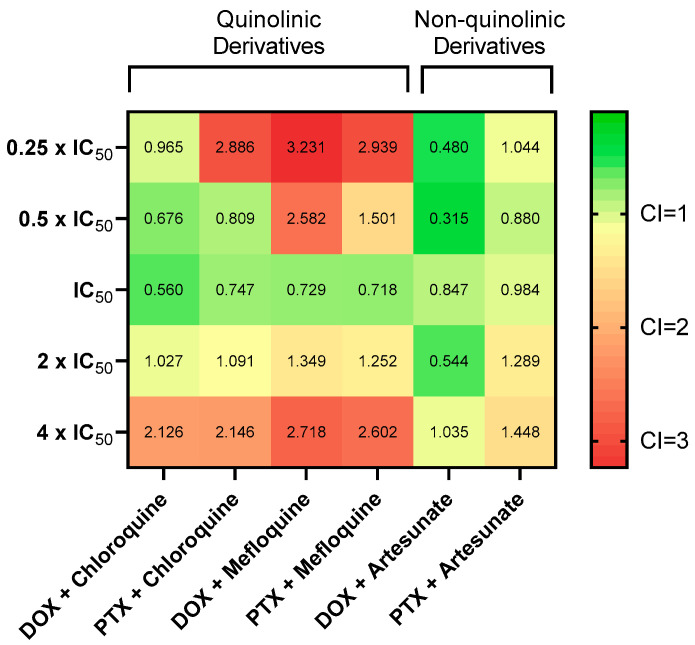
Figure 10.
Synergy heat map compiling CI values. The squares in the figure indicate antagonism (CI > 1.2, red), additivity (0.9 < CI < 1.1, yellow), and synergism (CI < 0.9, green) between DOX/PTX and chloroquine/mefloquine/artesunate against MCF-7 cells at combination settings described in Figure 6.

