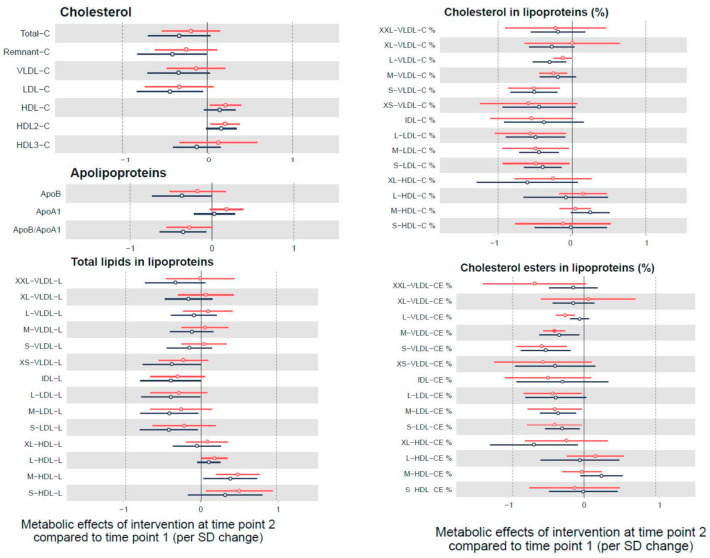
Figure 2.
Metabolic effects of the intervention after 6 months follow up (time point 2) compared to baseline (time point 1) (linear mixed models adjusted by age and sex). Results show changes by SD in each metabolite per unit change in mMDS score and are displayed by hollow points. Only those significant results (after correction of multiple testing) are indicated by filled points along with their 95% confidence intervals. In black is shown Group 1 (the intervention group for 12 months) that continued under a self-sustained continuation phase for another 6 months. In red is shown Group 2 (control) that received the active Mediterranean Diet Nutritional Intervention for 6 months.

