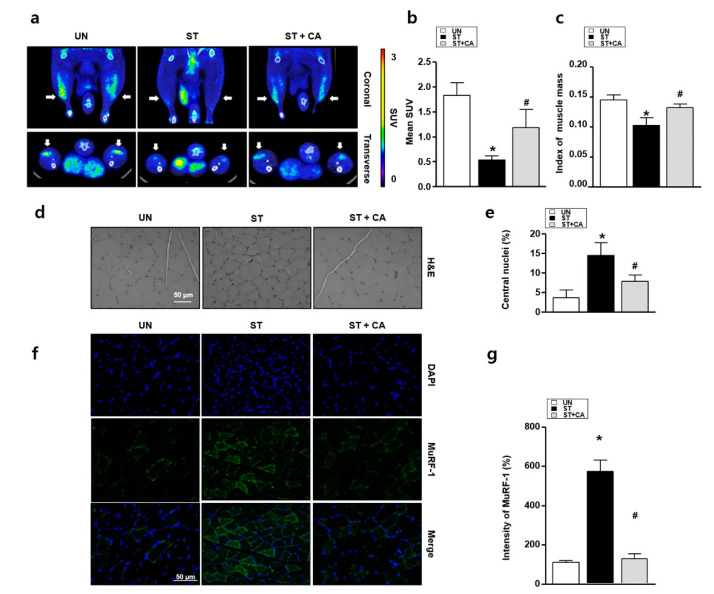
Figure 4.
Effects of camphene on skeletal muscle cells in starved rats. UN: untreated group; ST: starved group; ST + CA: the group is starved and treated with camphene. (a) Representative 18F-fluoro-2-deoxy-D-glucose-positron emission tomography/computed tomography (18F-FDG-PET/CT) images of a rat model of skeletal muscle atrophy with and without camphene treatment; (b) mean standardized uptake value (SUV) values from 18F-FDG-PET examinations are shown (n = 4). * p < 0.05; (c) the index of muscle mass was defined as the ratio between the thickness of the muscle and length of the tibia acquired by MIM software; (d) hematoxylin and eosin staining of gastrocnemius muscles from each group; (e) the graph of the central nuclei ratio shown in panel d (n = 4); (f) representative MuRF-1 protein expression images in each group; (g) the bar graph indicates MuRF-1 protein expression (n = 4); * p < 0.05 vs. UN; # p < 0.05 vs. ST; all data are expressed as mean percentages relative to the UN ± standard deviations.

