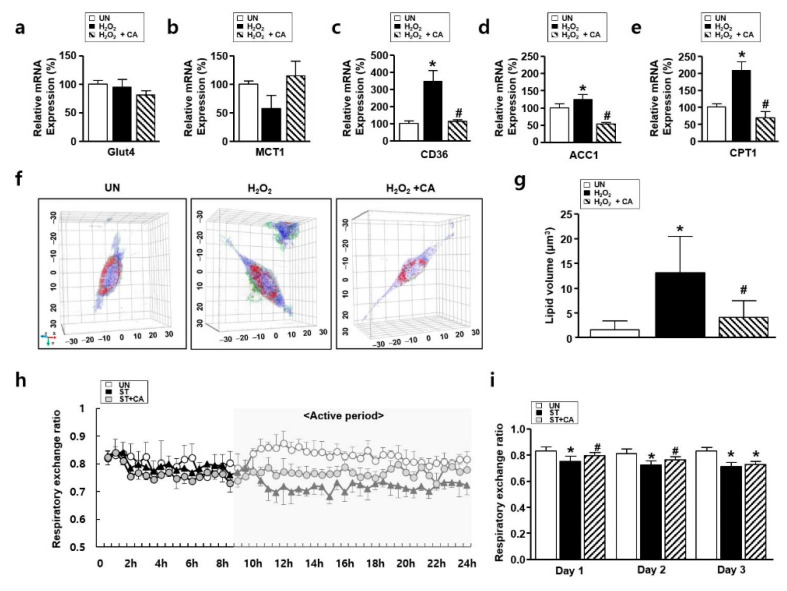
Figure 5.
The effect of camphene on lipid metabolism in hydrogen peroxide (H2O2)-stimulated L6 skeletal muscle cells and starved rats. (a–e) Expression of carbohydrate and lipid metabolism genes in the UN, H2O2, and H2O2 + CA. Expression levels were normalized to β-actin. * p < 0.05 vs. UN; # p < 0.05 vs. H2O2; (f,g) tomographic images of L6 cells treated with H2O2 with and without camphene. Red indicates lipids; UN: untreated group; H2O2: the group is treated with H2O2 (500 μM) for 24 h; H2O2 + CA: the group is treated with camphene (300 μM) and H2O2 (500 μM) for 24 h. * p < 0.05 vs. UN; # p < 0.05 vs. H2O2; (h,i) respiratory exchange ratios of the UN, ST, and ST + CA over (h) 24 h and (i) change in mean respiratory exchange rate over 3 days (n = 8). UN: untreated group; ST: starved group; ST + CA: the group is starved and treated with camphene. * p < 0.05 vs. UN; # p < 0.05 vs. ST; all data are expressed as mean percentages relative to the UN ± standard deviations.

