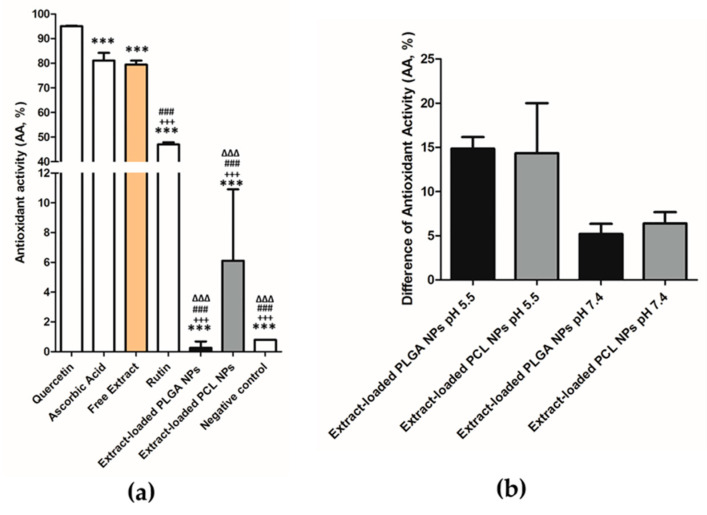
Figure 10.
(a) AA of quercetin and ascorbic acid (positive controls), free extract, extract-loaded PLGA NPs, extract-loaded PCL NPs, (%, mean ± S.D.; n = 3, *** p < 0.001, when compared the quercetin with the other samples, +++ p < 0.001, when compared the ascorbic acid with the other samples, ### p < 0.001, when compared the free extract with the other samples and ∆∆∆ p < 0.001, when compared the rutin with the other samples), (b) Difference of AA in release medium when compared with respective extract-loaded NPs (%, mean ± S.D.; n = 3).

