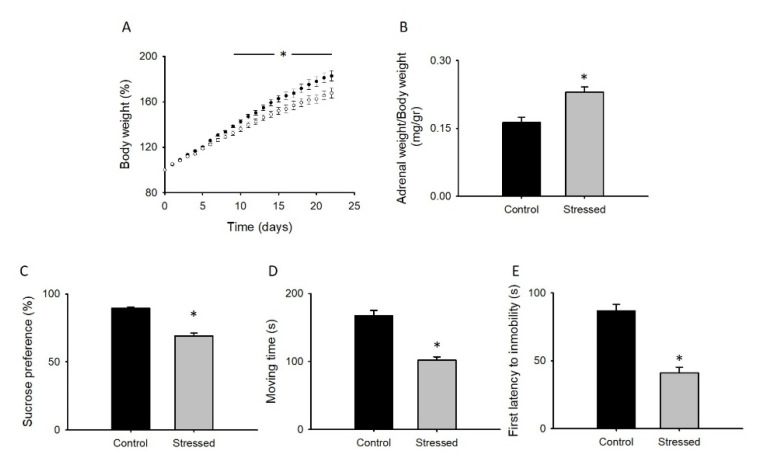
Figure 1.
Rats subjected to CRS display behavioral modifications. (A) Body weight gain recorded daily of control animals (black circles) or rats during three weeks of CRS protocol. Bar graphs of adrenal glands weight normalized by total body weight (B), sucrose preference shown as percentage of sweetened water consumed with respect to the total consumed water (C). D and E shows the total time of swimming and climbing (D), and the latency to the first period of immobility (E) of animals during the forced swimming test. Bar graphs are mean ± SEM; black bars are control animals, and gray bars correspond to CRS-subjected animals. n > 9 * p value < 0.05.

