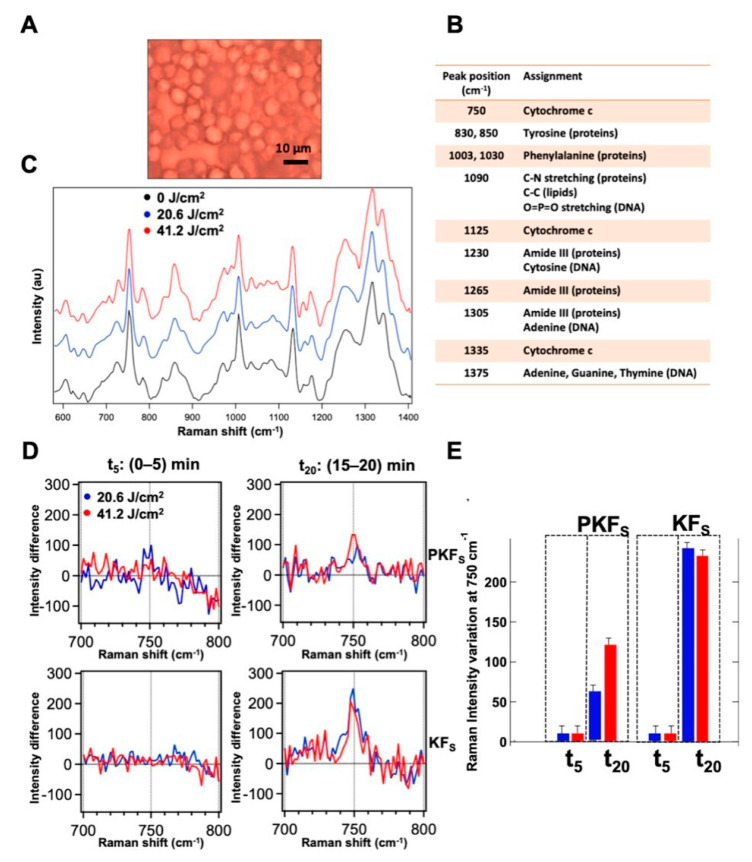
Figure 8.
(A) Microscopic images of a typical keloid fibroblast pellet prepared for Raman measurements. (B) Main assignments of the Raman peaks in keloid fibroblast spectrum. (C) Averaged Raman spectra of keloid fibroblasts before (black) and after the application of 20.6 (blue) and 41.2 (red) J/cm2 of blue LED light. (D) Differential spectra obtained by subtraction of the pre-irradiation spectrum from the post-irradiation spectrum of perilesional and keloid cells averaged in the first 5 min (between 0 and 5 min after irradiation, t5) and in the last 5 min (between 15 and 20 min after irradiation, t20) of the Raman experiment. (E) Column bars showing the Raman intensity variation of the peak at 750 cm−1 at different times after the irradiation at 20.6 J/cm2 (blue) and 41.2 J/cm2 (red) of blue LED light.

