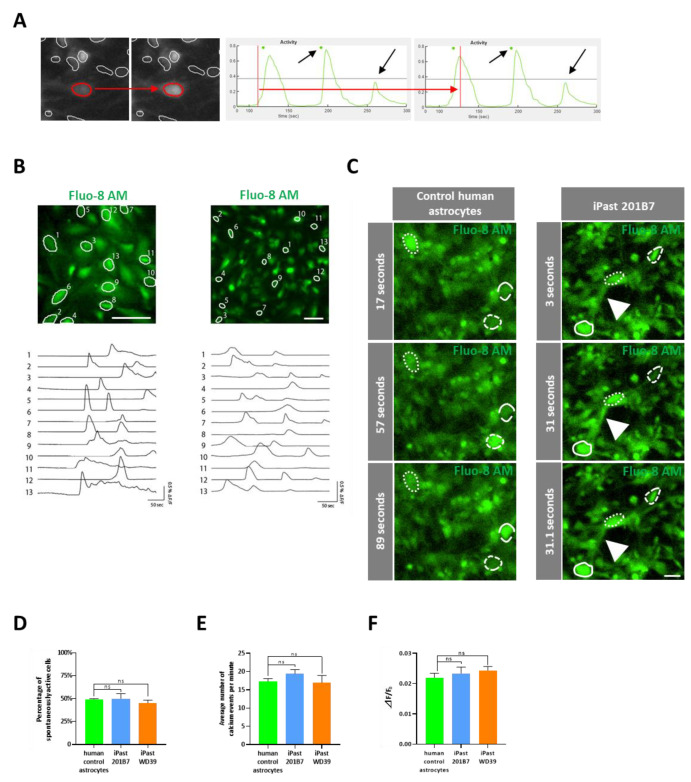
Figure 6.
Spontaneous Calcium Fluctuations in Control Human Astrocytes, 201B7 and WD39 iPasts. (A) Representative ROI (red line) after automatic preprocessing by miniscope 1-photon-based calcium imaging signal extraction pipeline (MIN1PIPE) software, before and at the peak of fluorescence (left pictures). Illustration of the method of analysis: the determination of a threshold and duration of calcium fluctuation for each same event results in considering 2 calcium transients (green dots) rather than 3 peaks (black arrows) (right panels). (B) Representative calcium transients in human control-astrocytes (left) and iPasts (right). Time traces of corresponding cells delineated with white outlines. Scale bars: 20 µm. (C) Representative experiments of Fluo-8 AM-stained human control astrocytes and 201B7 iPasts at different time points. The dotted circles indicate calcium transients captured during the acquisition, while white arrowheads point to a transient calcium fluctuation along an intercellular process. Scale bar: 10 µm. (D) Percentage of spontaneously active cells in human control-astrocytes, 201B7 iPasts and WD39 iPasts. (E) Average number of calcium events per minute in human control-astrocytes, 201B7 iPasts and WD39 iPasts. (F) Average variation of calcium transients amplitude for human control-astrocytes, 201B7 iPasts and WD39 iPasts. Data shown are represent mean ± SEM. n = 3 passages. Statistical test: Mann-Whitney test. ns stands for non significant.

