

Abstract
Background
Aortic stenosis–related mortality might vary across demographic subsets, regions, and states in the United States.
Methods and Results
We reviewed the death certificate data from the Centers for Disease Control and Prevention Wide‐Ranging OnLine Data for Epidemiologic Research database to examine aortic stenosis–related mortality trends from 2008 to 2018. Crude and age‐adjusted mortality rates (AAMRs) per 100 000 people and annual percentage change with 95% CIs were calculated. Between 2008 and 2018, AAMR reduced from 12.7 to 11.5 (average annual percentage change, −1.0 [95% CI, −1.5 to −0.5]), because of an accelerated decline between 2015 and 2018 (annual percentage change, −4.4 [95% CI, −6.0 to −2.7]). Older (aged >85 years), male, and White patients had higher death rates than younger, female, and non‐White patients, respectively. Although mortality reduction was similar across sexes, significant mortality reduction was limited to White patients only. The AAMRs were higher in rural than urban areas. States with AAMRs >90th percentile were distributed in the West and the Northeast, and <10th percentile in the South. The AAMRs for sex and race were highest in the West and lowest in the South. None of the states located in the Midwest showed a significant reduction in mortality. Mortality remained stable for hospital setting and nursing home/long‐term care facility, except that the number of deaths increased at home and hospice facility since 2014.
Conclusions
The reduction in mortality in patients with aortic stenosis was not consistent among demographic subsets and states. The substantial public health and economic implications call for determination of underlying clinical and socioeconomic factors to narrow the gap.
Keywords: aortic stenosis, epidemiology, mortality
Subject Categories: Epidemiology, Valvular Heart Disease
Nonstandard Abbreviations and Acronyms
- AS
aortic stenosis
- APC
annual percentage change
- AAPC
average annual percentage change
- AAMR
age‐adjusted mortality rate
- AVR
aortic valve replacement
- TAVR
transcatheter aortic valve replacement
Clinical Perspective
What Is New?
Between 2008 and 2018, aortic stenosis–related mortality reduced in the United States, because of an accelerated decline between 2015 and 2018.
Demographic differences existed, whereas geographical patterns demonstrated higher burden of mortality in the rural areas or states located in the West and the Northeast.
What Are the Clinical Implications?
The demographic and regional variations in aortic stenosis mortality might have stemmed from clinical and behavioral heterogeneities as well as socioeconomic disparities, and limited health care access among patients.
The substantial public health implications call for identification of underlying clinical and social determinants of health to narrow the differences in aortic stenosis mortality.
Aortic stenosis (AS) is one of the most common valvular problems associated with significant morbidity and mortality in the United States. 1 , 2 Before transcatheter aortic valve replacement (TAVR) therapy, surgical aortic valve replacement (AVR) was considered the gold standard to improve the prognosis. 3 Consequently, a significant proportion of elderly patients with significant multimorbidity burden were left untreated. There has been a significant improvement in life expectancy in older patients after TAVR. 1 However, the survival benefit does not appear to be similar in non‐White compared with White patients. 1 , 4 Moreover, geographical variations in the use of TAVR have demonstrated contrasting patterns of in‐hospital mortality in the US regions. 5
Prior data through 2017 suggested that AS‐related mortality did not improve in nonmetropolitan populations. 1 In view of striking regional socioeconomic disparities and variations in TAVR volumes, 5 , 6 it is imperative to identify the patterns of AS‐related mortality at the state level in the United States. Moreover, because prior data primarily focused on mortality trends in the inpatient setting, 4 , 5 assessment of contemporary trends for individuals with AS is warranted. Death certificates remain the key data source for measuring longitudinal global and local death trends in public health. 6 Accordingly, we used a national‐level database examining death certificates to measure AS‐related mortality trends in the United States, stratified by demographic and regional characteristics.
Methods
The Centers for Disease Control and Prevention Wide‐Ranging OnLine Data for Epidemiologic Research data sets used in this project are publicly available and are easily replicable from the methods described in the article.
Data Source
We analyzed the Mortality Multiple Cause‐of‐Death Public Use Record from the National Center for Health Statistics database, which provides mortality data for all US deaths, merged with death certificate data from the Centers for Disease Control and Prevention Wide‐Ranging OnLine Data for Epidemiologic Research database. 7 This database includes the assigned cause of mortality from all death certificates filed in the 50 states and District of Columbia. 8 We selected natural deaths (defined by the World Health Organization as the disease or injury that initiated the events leading directly to death as entered by the physician on the death certificate) attributed to AS. 7 , 9 In multiple comorbidities (common in AS), the underlying cause is determined by the condition sequence on the certificate, provision of the International Classification of the Diseases, Tenth Revision (ICD‐10) codes, and associated selection rules and modifications. 7 , 9 We identified AS‐related cases using ICD‐10 revision codes: I06.0, I06.2, I35.0, and I35.20. 1 To counter the potential ascertainment bias, AS‐related mortality rates were corroborated with all‐cause, cardiovascular (I00‐I78), and cancer‐related (C00‐C97) mortality (Figure S1); sex‐ and race‐stratified analyses were performed for cancer mortality (Figures S2 and S3) to validate estimates of AS‐related mortality. This study did not require institutional review board approval because we analyzed government‐issued public‐use data without individual identifiable information.
Data Extraction
The number of AS‐related deaths and population size were abstracted from 2008 to 2018. This period was selected (1) to document contemporary 10‐year trends in AS‐related mortality and (2) to approximate the changing AS mortality patterns most closely in relation to use of TAVR in the United States. The data were abstracted on age, sex, race, region, states, and place of death. For age, we selected patients aged ≥45 years 1 , and stratified them into 10‐year age groups. Race was identified as White, Black, Hispanic, American Indian/Alaskan Native (North, Central, and South American Indians, Eskimos, and Aleuts), and Asian/Pacific Islander (Chinese, Filipino, Hawaiian, Japanese, and other Asian or Pacific Islanders). Regions were classified according to Census Bureau–defined regions into Northeast, Midwest, South, and West. 7 Using the National Center for Health Statistics Urban‐Rural Classification Scheme, we divided our population into urban (large metropolitan area [≥1 million], medium/small metropolitan area [50 000–999 999]) and rural (<50 000) counties per the 2013 US census classification. 10 Place of death was categorized as medical facility (inpatient, outpatient, or emergency room), home, hospice facility, nursing home/long‐term care, and other.
Statistical Analysis
The crude death rates for individual years were calculated by dividing the number of AS‐related deaths by the total corresponding population. The annual mortality rates were calculated per 100 000 population with the corresponding 95% CIs. 11 The mortality rates were age‐adjusted based on the US standard population from the year 2000. Temporal trends in mortality were examined to identify changes in slope using Joinpoint Regression Program version 4.7.0.0, which models consecutive linear segments on a log scale, connected by joinpoints, where the segments converge. 12 Annual percentage change (APC) with 95% CIs were calculated for the line segments linking a joinpoint using Monte Carlo permutation test. We estimated the weighted average of the APCs to calculate the average APC (AAPC) for entire study period (2008–2018). The AAPC is a summary estimate of the trend over a prespecified fixed time interval, which allows provision of a single numerical measure to describe the AAPCs over a duration of multiple years. 13 This measure is valid even if the joinpoint model suggests changes in trends during those years. Slopes were considered increasing or decreasing if the estimated slope differed significantly from zero. 12 The statistical significance was determined by 2‐sided t testing (P=0.05).
Results
Between 2008 and 2018, 176 743 AS‐related deaths occurred, corresponding to age‐adjusted mortality rate (AAMR) of 12.7 (95% CI, 12.6–12.8). The APC in AAMR was stable between 2008 and 2015 (0.4 [95% CI, −0.02 to 0.91]), but there was an accelerated decline between 2015 and 2018 (−4.4 [95% CI, −6.0 to −2.7]; Figure 1). Overall, AAMR reduced from 12.7 (95% CI, 12.5–12.9) to 11.5 (95% CI, 11.3–11.6) with AAPC of −1.0 (95% CI, −1.5 to −0.5).
Figure 1. Overall and sex‐stratified aortic stenosis–related mortality rates in the United States, 2008 to 2018.
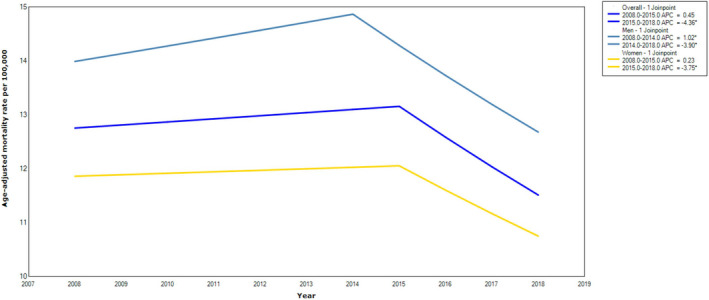
*Indicates that the annual percentage change (APC) is significantly different from zero at α=0.05.
Demographic Patterns
The crude mortality rates increased with age, with exponential distribution (Figure 2). AS‐related mortality reduction was most pronounced in patients who were aged 75 to 84 years (AAPC, −2.2 [95% CI, −2.9 to −1.6]). The mortality trend remained flat in patients aged >85 years, because of significant increase in APC in crude death rate between 2008 and 2015 (0.8 [95% CI, 0.2–1.5]), followed by a significant downtrend between 2015 and 2018 (−4.1 [95% CI, −6.5 to −1.7]; Figure S4). Tables S1 and S2 report crude and AAMRs for AS‐related mortality; and Table S3 reports the absolute number of AS‐related deaths grouped by sex and race in the United States. Overall, men had higher AAMRs than women, and White patients had higher AAMRs than other races.
Figure 2.

Aortic stenosis–related mortality rates in the US regions by age and sex, 2008 to 2018.
A consistent reduction in mortality was noted in women (AAPC, −1.0 [95% CI, −1.5 to −0.4]) and men (AAPC, −1.0 [95% CI, −1.4 to −0.46]), because of accelerated mortality decline since 2015 in women and 2014 in men into subsequent years (Figure 1). However, this downtrend was not consistent across race. In White patients, APC in AAMR initially increased between 2008 and 2015 (0.6 [95% CI, 0.2–1.0]), followed by reduction through 2018 (−4.0 [95% CI, −5.4 to −2.6]), translating into AAPC of −0.8 (95% CI, −1.2 to −0.4). Conversely, in Black, American Indian/Alaskan Native, and Hispanic patients, the mortality trends remained static, except in Asian/Pacific Islanders, where mortality declined between 2013 and 2018 (−4.2 [95% CI, −7.5 to −0.8]; Figure 3).
Figure 3. Aortic stenosis–related mortality rates stratified by race in the United States, 2008 to 2018.
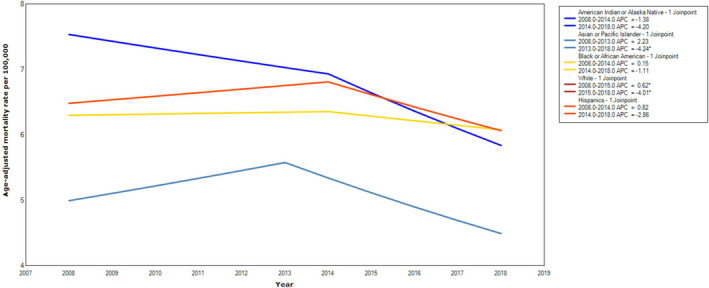
*Indicates that the annual percentage change (APC) is significantly different from zero at α=0.05.
Geographical Patterns
Between 2008 and 2018, the AAMRs were higher in rural (13.3–14.3) than urban (12.9–11.5) areas (Figure S5). In the urban areas, the APC in AAMR was stable between 2008 and 2014 (0.6 [95% CI, −0.1 to 1.4]), but there was an accelerated decline between 2014 and 2018 (−3.3 [95% CI, −4.6 to −2.0]). Conversely, in the rural area, APC in AAMR increased between 2008 and 2015 (2.4 [95% CI, 1.7–3.1]), followed by a decline between 2015 and 2018 (−3.4 [95% CI, −5.8 to −0.9]).
Across the states, AAMRs varied from 8.0 (95% CI, 7.6–8.4) to 26.6 (95% CI, 25.9–27.3; Figure 4). States with AAMRs >90th percentile were distributed in the West and the Northeast regions (Oregon, Vermont, Washington, Maine, New Hampshire, and Idaho). States with AAMRs <10th percentile were clustered in the South (Texas, Mississippi, District of Columbia, Georgia, and Alabama) (Table S4). The AAMRs for sex and race were highest in the West and lowest in the South. Sex‐ and age‐specific differences were most prominent in the West and least prominent in the Northeast (Figure 5). Race‐ and age‐specific differences were most prominent in the Northeast and least prominent in the South. Death rates classified by sex and race for each individual state are shown in Tables S1 and S2.
Figure 4.
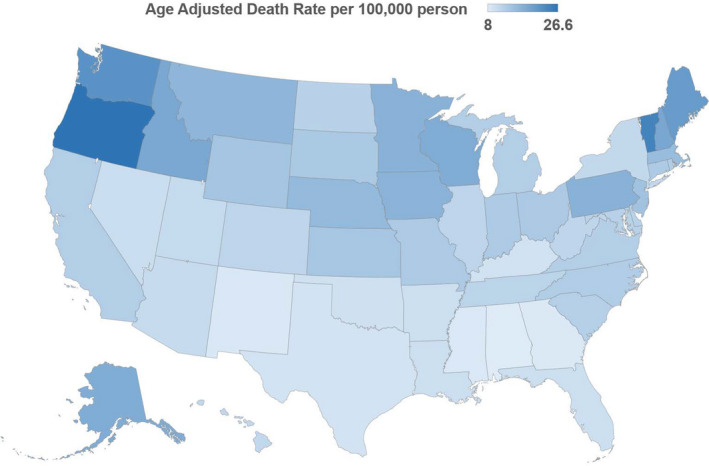
State‐level aortic stenosis–related age‐adjusted mortality rates per 100 000 people among adults aged ≥45 years in the United States, 2008 to 2018.
Figure 5.
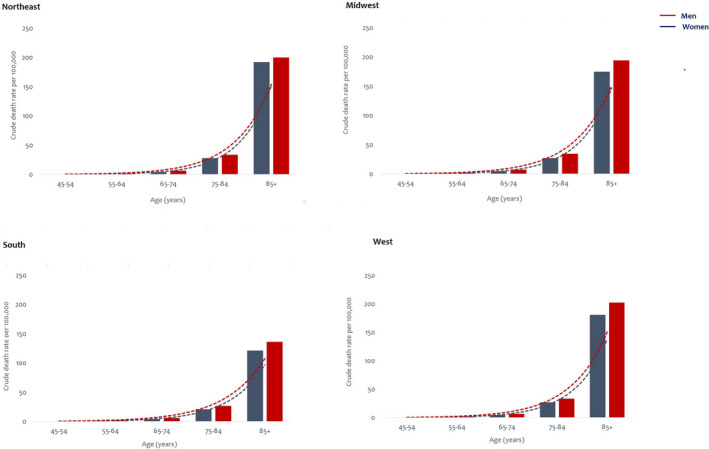
Sex and age‐specific aortic stenosis–related crude mortality rates per 100 000 people in the US regions, 2008 to 2018.
During the study period, the AAPC remained flat for most states except California (−2.29 [95% CI, −3.86 to −0.69]), New York (−1.64 [95% CI, −2.17 to −1.12]), North Carolina (−1.74 [95% CI, −2.94 to −0.53]), and Oregon (1.22 [95% CI, 0.11–2.33]) (Table S2). However, inflection points were identified in the year 2010 for Washington (−2.59 [95% CI, −3.89 to −1.28]) and Georgia (−3.06 [95% CI, −4.52 to −1.59]); 2012 and 2013 for North Carolina (−4.07 [95% CI, −5.59 to −2.53]) and Virginia (−4.70 [95% CI, −8.34 to −0.91]), respectively; 2014 for New York (−5.56 [95% CI, −6.79 to −4.33]), Arizona (−6.34 [95% CI, −12.15 to −0.15]), and Oregon (−3.60 [95% CI, −6.14 to −1.00]); and 2015 for New Jersey (−6.63 [95% CI, −12.62 to −0.23]). None of the states located in the Midwest showed reduction in AS mortality (Table S5). Tables S6 to S9 report state‐level mortality rates stratified by sex and race.
Location of Death
Annually, the average absolute number of deaths was highest in the inpatient setting (n=6368), followed by home (n=4188) and nursing home/long‐term care facility (n=3190); and lowest in outpatient/emergency department (n=671) and hospice facility (n=850). The APC in number of deaths increased for outpatient/emergency department between 2008 and 2012 (3.6 [95% CI, 0.3–7.1]), followed by decline between 2012 and 2018 (−2.9 [95% CI, −4.6 to −1.2]; Figure S6). A similar trend was noticed for nursing home/long‐term care facility. The APC for inpatient deaths initially increased and then stabilized since 2015 onwards. The AAPC increased for deaths at home (3.3 [95% CI, 2.0–4.5]) and hospice facility (13.1 [95% CI, 9.7–16.6]), secondary to significant growth between 2008 and 2014 for home (5.6 [95% CI, 4.2–7.1]) and hospice facilities (19.8 [95% CI, 16.4–23.3]).
Discussion
Using contemporary US data, we found some distinct patterns of AS‐related mortality during the past 10 years. First, urban‐rural differences existed, with higher burden of mortality in rural than urban areas. Second, the mortality varied across states, with higher death rates observed in states located in West and Northeast, and lower in South. Third, demographic disparities were observed at the national and state levels. And fourth, there was an upsurge in the number of patients dying at home and hospice facilities.
Geographical variations in total and cardiovascular mortality in the United States have persisted over the years. 6 , 12 In a recent report, rural areas showed greater all‐cause mortality rates with absolute rural‐urban differences in AAMR doubling between 1999 and 2017. 10 Our study also illustrated higher AAMRs in rural than urban areas. We also identified new hotspots of AS‐related death in states located in West and Northeast regions. During the past 5 to 8 years, advancement in AS‐related life expectancy was observed in states substantially clustered outside the Midwest. These patterns are partially consistent with overall mortality trends in the United States, 12 and stem from different demographic makeup of the states and their inherent disease risk, heterogeneities in metabolic, behavioral, and clinical risk factors faced by the state’s residents, 6 , 12 and access to health care that can modify prognosis over time. 14
The known risk factors for AS include advancing age, men, White race, smoking, obesity, hypertension, atherosclerosis, and congenital bicuspid valve. 2 , 15 Different degrees of exposure to cardiometabolic risk factors and higher proportions of men and White population in certain regions can explain some of these trends. For instance, as per the Centers for Disease Control and Prevention Behavioral Risk Factor Surveillance System surveys, the recent prevalence of hypertension and obesity, respectively, in Oregon (30.1% and 29.9%), Vermont (30.4% and 27.5%), Washington (29.5% and 28.7%), Maine (34.8% and 30.4%), New Hampshire (30.0% and 29.6%), and Idaho (29.8% and 28.4%) were relatively higher than some states located in lower percentile for AS‐related mortality. 16 , 17 Similarly, some of these states (Vermont, Maine, New Hampshire, and Idaho) had a higher prevalence of White people than other states. 18
Similarly, both men and White people had higher AAMRs in West and Northeast states compared with those in South. Another set of potential explanations include socioeconomic pressures and financial hardships that can influence mortality. There was lack of AS‐related mortality reduction in areas with history of economic challenges, such as rural areas 19 or the industrial Midwest. 12 However, mortality decline was prominent in states with more robust economies, such as California and New York. 12 Interplay of socioeconomic predictors, such as income, education level, quality of life, exposure to discrimination, and employment status between states and residential minorities can shape the mortality trends. 6 , 12 , 15 , 20 Finally, geographical variation in volume and use of AVR procedures, lower density of TAVR programs in rural areas, and challenges in accessing therapy can largely influence mortality. 5 Recently, residents of rural counties in Florida were shown to travel an extra 44 miles for TAVR and experience ≈7‐fold lower rates of TAVR procedures compared with heavily populated regions. 15 , 21
Prior evidence showed that AS‐related morality decline was exclusively limited to patients aged ≥80 years. 1 We document an overall improvement in life expectancy in those aged 75 to 84 years during the past decade, and reversal of escalating mortality in those aged >85 years since 2015. These statistics signal the penetration of therapeutic benefits of TAVR in this target population, who may not have been candidates for surgical AVR procedures in the past. Although reductions in mortality were uniformly distributed across sexes, these patterns were not observed across race. The national data of inpatient hospitalization and Medicare beneficiaries showed that Black patients had lower proportion of AS‐related hospitalizations and received fewer AVR procedures than White patients. 4 , 22 The transcatheter valve therapy registry from 2011 to 2016 showed that among 70 221 patients undergoing TAVR, 91% were White, 3.8% were Black, 3.4% were Hispanic, and 1.5% were Asian/Pacific Islander and American Indian/Alaskan Native patients. 14 The potential reasons for this imbalance include lower prevalence of AS in non‐White patients compared with White patients, 2 , 15 referral bias for AVR favoring White people over other races, 23 , 24 and detection bias, where patients belonging to higher‐income class were diagnosed more than poor. 20 Some of these factors might explain reduction in AS mortality in White compared with non‐White patients.
Location of death is an important component of end‐of‐life care experience. 9 Overall proportion of AS‐related deaths was higher in the inpatient setting. However, there was an emerging trend favoring more patients dying at home and hospice facilities. The most remarkable (≈20%) increase was noticed in patients dying at hospice facility. This trend is consistent with general population and patients with cardiovascular disease, 9 , 25 and reflects the use of palliative care in patients with debilitating symptoms without cure.
This study has various limitations. Vital statistics and census population data rely on death certificates. These sources are subject to error because reporting of deaths might vary across the states or deaths within the population might be missed or allocated to wrong state. 6 Inaccurate ascertainment of demographic information and cause of death based on ICD‐10 codes, which are subject to misclassification, can bias the results. 12 Analysis of the FHS (Framingham Heart Study) showed mismatch between true versus reported causes of death in decedents aged >85 years. 26 In‐hospital mortality rates might be higher because AS is more readily diagnosed in the hospital than in those at the time of death. This might influence the estimates on location of death. The data set lacks the information on prevalence of AS or AVR rates. However, although the frequency of TAVR has increased, prevalence of AS does not seem to have changed over the years. 4 , 14 , 22 , 27 Because data were missing on pertinent clinical and social determinants of health, and regional growth rates of transcatheter or surgical AVR in the United States, the predictors of mortality could not be analyzed. Finally, the vital statistic records deaths to state of residence at the time of death, and does not factor migration between the states. 6
In summary, AS‐related mortality has reduced in the United States during the past 10 years, with the decline being more prominent in the second half of the decade. However, the downward trend in mortality was not consistent among all demographic groups or across all the states. The demographic and regional variations might have emerged from different clinical and social determinants of health among patients. Future studies designed to explore underlying clinical mechanisms, social disparities, and access to healthcare issues might shed further light to explain community‐level variations in AS‐related mortality.
Sources of Funding
.The study was funded by the Ram and Sanjita Kalra Aavishqaar Fund at Section of Cardiovascular Research, Heart, Vascular and Thoracic Department at Cleveland Clinic Akron General, Akron, Ohio.
Disclosures
None.
Supporting information
Tables S1–S9
Figures S1–S6
(J Am Heart Assoc. 2020;9:017433 DOI: 10.1161/JAHA.120.017433.)
Supplementary Material for this article is available at https://www.ahajournals.org/doi/suppl/10.1161/JAHA.120.017433
Equal contribution.
For Sources of Funding and Disclosures, see page 7.
References
- 1. Bevan GH, Zidar DA, Josephson RA, Al‐Kindi SG. Mortality due to aortic stenosis in the United States, 2008–2017. JAMA. 2019;2236–2238. [DOI] [PMC free article] [PubMed] [Google Scholar]
- 2. Stewart BF, Siscovick D, Lind BK, Gardin JM, Gottdiener JS, Smith VE, Kitzman DW, Otto CM. Clinical factors associated with calcific aortic valve disease: Cardiovascular Health Study. J Am Coll Cardiol. 1997;630–634. [DOI] [PubMed] [Google Scholar]
- 3. Khan SU, Riaz H, Khan MU, Zarak MS, Khan MZ, Khan MS, Sattur S, Desai MY, Kaluski E, Alkhouli M. Meta‐analysis of temporal and surgical risk dependent associations with outcomes after transcatheter versus surgical aortic valve implantation. Am J Cardiol. 2019;1608–1614. [DOI] [PMC free article] [PubMed] [Google Scholar]
- 4. Alqahtani F, Aljohani S, Amin AH, Al‐Hijji M, Ali OO, Holmes DR, Alkhouli M. Effect of race on the incidence of aortic stenosis and outcomes of aortic valve replacement in the United States. Mayo Clin Proc. 2018;607–617. [DOI] [PubMed] [Google Scholar]
- 5. Gupta T, Kalra A, Kolte D, Khera S, Villablanca PA, Goel K, Bortnick AE, Aronow WS, Panza JA, Kleiman NS, et al. Regional variation in utilization, in‐hospital mortality, and health‐care resource use of transcatheter aortic valve implantation in the United States. Am J Cardiol. 2017;1869–1876. [DOI] [PubMed] [Google Scholar]
- 6. Roth GA, Dwyer‐Lindgren L, Bertozzi‐Villa A, Stubbs RW, Morozoff C, Naghavi M, Mokdad AH, Murray CJL. Trends and patterns of geographic variation in cardiovascular mortality among US counties, 1980–2014. JAMA. 2017;1976–1992. [DOI] [PMC free article] [PubMed] [Google Scholar]
- 7. National Center for Health Statistics, CDC . About underlying cause of death 1999–2018. Available at: https://wonder.cdc.gov/ucd-icd10.html. Accessed April 15, 2020.
- 8. Sidney S, Quesenberry CP Jr, Jaffe MG, Sorel M, Nguyen‐Huynh MN, Kushi LH, Go AS, Rana JS. Recent trends in cardiovascular mortality in the United States and public health goals. JAMA Cardiol. 2016;594–599. [DOI] [PubMed] [Google Scholar]
- 9. Cross SH, Kaufman BG, Mentz RJ, Kamal AH, Taylor DH Jr, Warraich HJ. Trends in place of death for individuals with cardiovascular disease in the United States. J Am Coll Cardiol. 2019;1943–1946. [DOI] [PMC free article] [PubMed] [Google Scholar]
- 10. Cross SH, Mehra MR, Bhatt DL, Nasir K, O’Donnell CJ, Califf RM, Warraich HJ. Rural‐urban differences in cardiovascular mortality in the US, 1999–2017. JAMA. 2020;1852–1854. [DOI] [PMC free article] [PubMed] [Google Scholar]
- 11. Barco S, Mahmoudpour SH, Valerio L, Klok FA, Munzel T, Middeldorp S, Ageno W, Cohen AT, Hunt BJ, Konstantinides SV. Trends in mortality related to pulmonary embolism in the European Region, 2000–15: analysis of vital registration data from the WHO mortality database. Lancet Respir Med. 2020;277–287. [DOI] [PubMed] [Google Scholar]
- 12. Woolf SH, Schoomaker H. Life expectancy and mortality rates in the United States, 1959–2017. JAMA. 2019;1996–2016. [DOI] [PMC free article] [PubMed] [Google Scholar]
- 13. Clegg LX, Hankey BF, Tiwari R, Feuer EJ, Edwards BK. Estimating average annual per cent change in trend analysis. Stat Med. 2009;3670–3682. [DOI] [PMC free article] [PubMed] [Google Scholar]
- 14. Alkhouli M, Holmes DR Jr, Carroll JD, Li Z, Inohara T, Kosinski AS, Szerlip M, Thourani VH, Mack MJ, Vemulapalli S. Racial disparities in the utilization and outcomes of TAVR: TVT registry report. JACC Cardiovasc Interv. 2019;936–948. [DOI] [PubMed] [Google Scholar]
- 15. Batchelor W, Anwaruddin S, Ross L, Alli O, Young MN, Horne A, Cestoni A, Welt F, Mehran R. Aortic valve stenosis treatment disparities in the underserved: JACC council perspectives. J Am Coll Cardiol. 2019;2313–2321. [DOI] [PubMed] [Google Scholar]
- 16. Behavioral Risk Factor Surveillance System: Centers for Disease Control and Prevention. Available at: https://www.cdc.gov/brfss/index.html. Accessed April 12, 2020.
- 17. Adult Obesity Prevalence Maps: Centers for Disease Control and Prevention. Available at: https://www.cdc.gov/obesity/data/prevalence-maps.html. Accessed June 6, 2020.
- 18. United States Census Bureau: Percent of the Total Population Who Are White Alone. Available at: https://www.census.gov/. Accessed June 6, 2020.
- 19. Monnat SM, Beeler PC. Rural/urban differences in self‐rated health: examining the roles of county size and metropolitan adjacency. Health Place. 2011;311–319. [DOI] [PubMed] [Google Scholar]
- 20. Beydoun HA, Beydoun MA, Liang H, Dore GA, Shaked D, Zonderman AB, Eid SM. Sex, race, and socioeconomic disparities in patients with aortic stenosis (from a nationwide inpatient sample). Am J Cardiol. 2016;860–865. [DOI] [PMC free article] [PubMed] [Google Scholar]
- 21. Damluji AA, Epstein R, Moscucci M, Rayer S, Wang Y, Cohen MG, Resar JR, Cohen DJ, O’Connor C, Batchelor WB, et al. Abstract 14981: healthcare access to TAVR procedures by population density: a focus on healthcare disparity in Florida. Circulation. 2019;A14981. [Google Scholar]
- 22. Barreto‐Filho JA, Wang Y, Dodson JA, Desai MM, Sugeng L, Geirsson A, Krumholz HM. Trends in aortic valve replacement for elderly patients in the United States, 1999–2011. JAMA. 2013;2078–2085. [DOI] [PMC free article] [PubMed] [Google Scholar]
- 23. Cruz Rodriguez B, Acharya P, Salazar‐Fields C, Horne A Jr. Comparison of frequency of referral to cardiothoracic surgery for aortic valve disease in blacks, hispanics, and whites. Am J Cardiol. 2017;450–455. [DOI] [PubMed] [Google Scholar]
- 24. Sleder A, Tackett S, Cerasale M, Mittal C, Isseh I, Radjef R, Taylor A, Farha R, Lupak O, et al. Socioeconomic and racial disparities: a case‐control study of patients receiving transcatheter aortic valve replacement for severe aortic stenosis. J Racial Ethnic Health Disparities. 2017;1189–1194. [DOI] [PubMed] [Google Scholar]
- 25. Cross SH, Warraich HJ. Changes in the place of death in the United States. N Engl J Med. 2019;2369–2370. [DOI] [PubMed] [Google Scholar]
- 26. Lloyd‐Jones DM, Martin DO, Larson MG, Levy D. Accuracy of death certificates for coding coronary heart disease as the cause of death. Ann Intern Med. 1998;1020–1026. [DOI] [PubMed] [Google Scholar]
- 27. Alkhouli M, Alqahtani F, Ziada KM, Aljohani S, Holmes DR, Mathew V. Contemporary trends in the management of aortic stenosis in the USA. Eur Heart J. 2020;921–928. [DOI] [PubMed] [Google Scholar]
Associated Data
This section collects any data citations, data availability statements, or supplementary materials included in this article.
Supplementary Materials
Tables S1–S9
Figures S1–S6