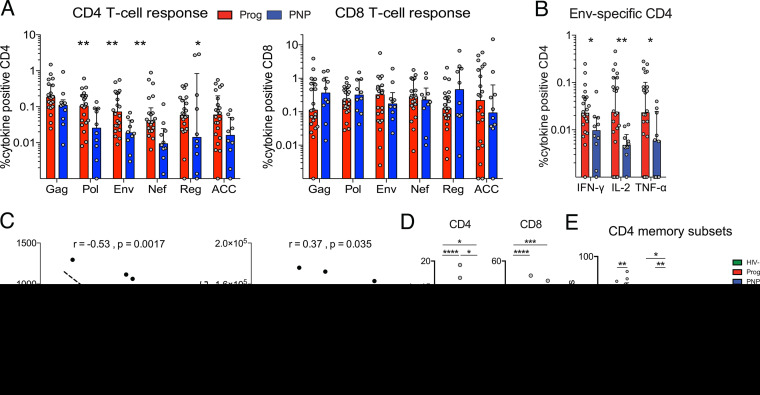
FIG 2.
Increased T-cell responses and activation in progressor children. (A) Frequencies of CD4 (left) and CD8 (right) T cells responding with IFN-γ, interleukin-2 (IL-2), and/or TNF-α after stimulation with HIV-1 subtype C Gag, Pol, Env, Nef, regulatory (Reg) (Tat and Rev), or accessory (ACC) (Vpr, Vpu, and Vif) peptide pools. Medians are shown by bar graphs, and interquartile ranges are shown by error bars. Statistical comparisons between groups are based on Mann-Whitney U tests (*, P < 0.05; **, P < 0.01). (B) Individual cytokine responses for CD4 T cells after stimulation with pooled HIV Env peptides. (C) Spearman rank correlations between frequencies of Env-specific CD4 T cells and CD4 counts or gp41-specific IgG titers with trend lines and 95% confidence intervals (dotted lines). (D) Frequencies of activated (CD38+ HLADR+) cells gated on live CD3+ CD4+ or CD8+ T cells from HIV-infected progressor (Prog) (n = 23) and nonprogressor (PNP) (n = 10) children compared to HIV-uninfected children (HIV−) (n = 10). Median values are indicated by bar graphs, and interquartile ranges are indicated by error bars. Statistical comparisons between groups are based on Mann-Whitney U tests (*, P < 0.05; **, P < 0.01; ***, P < 0.001; ****, P < 0.0001). (E) Frequencies of naive (CD45RA+ CCR7+), effector memory (Tem) (CD45RA− CCR7−), central memory (Tcm) (CD45RA− CCR7+), and Temra (CD45RA+ CCR7−) CD4 T cells (gated on live CD3+ cells) expressed as medians with interquartile ranges. Statistical comparisons between groups are based on Mann-Whitney U tests (*, P < 0.05; **, P < 0.01).

