

Abstract
Background
We investigated daily blood pressure (BP) changes during fasting periods ranging from 4 to 41 (10.0±3.8) days in a cohort of 1610 subjects, including 920 normotensive, 313 hypertensive nonmedicated, and 377 hypertensive medicated individuals.
Methods and Results
Subjects underwent a multidisciplinary fasting program with a daily intake of ≈250 kcal. Weight and stress scores decreased during fasting, and the well‐being index increased, documenting a good tolerability. BP mean values decreased from 126.2±18.6/81.4±11.0 to 119.7±15.9/77.6±9.8 mm Hg (mean change, −6.5/3.8 mm Hg). BP changes were larger for hypertensive nonmedicated subjects (>140/90 mm Hg) and reduced by 16.7/8.8 mm Hg. This reduction reached 24.7/13.1 mm Hg for hypertensive nonmedicated subjects (n=76) with the highest BP (>160/100 mm Hg). In the normotensive group, BP decreased moderately by 3.0/1.9 mm Hg. Interestingly, we documented an increase of 6.3/2.2 mm Hg in a subgroup of 69 female subjects with BP <100/60 mm Hg. In the hypertensive medicated group, although BP decreased from 134.6/86.0 to 127.3/81.3 mm Hg, medication was stopped in 23.6% of the subjects, whereas dosage was reduced in 43.5% and remained unchanged in 19.4%. The decrease in BP was larger in subjects fasting longer. Baseline metabolic parameters, such as body mass index and glucose levels, as well as age, can be used to predict the amplitude of the BP decrease during fasting with a machine learning model.
Conclusions
Long‐term fasting tends to decrease BP in subjects with elevated BP values. This effect persisted during the 4 days of stepwise food reintroduction, even when subjects stopped their antihypertensive medication.
Registration
URL: https://www.drks.de/drks_web/; Unique identifier: DRKS00010111.
Keywords: Buchinger fasting, hypertension, weight loss
Subject Categories: High Blood Pressure, Diet and Nutrition
Nonstandard Abbreviations and Acronyms
- BWC
Buchinger Wilhelmi Clinic
- DBP
diastolic blood pressure
- HTM
hypertensive medicated
- HTNM
hypertensive nonmedicated
- LF
long‐term fasting
- NP
natriuretic peptide
- SBP
systolic blood pressure
- WC
waist circumference
Clinical Perspective
What Is New?
This study investigated the effects of long‐term fasting on blood pressure (BP) variations in a large cohort of 1610 subjects.
We grouped the subjects into normotensive, hypertensive nonmedicated, and hypertensive medicated subjects, documenting beneficial effects, especially on medicated hypertensive subjects who could diminish or stop their medication during the procedure.
Longer fasting periods modulated the BP more strongly than shorter periods.
What Are the Clinical Implications?
Long‐term fasting, as a specific nutritional intervention, could be complementary to medication in achieving normal and controlled BP, especially in cases where antihypertensive drugs fail to control BP.
Hypertensive nonmedicated as well as medicated subjects normalized their BP during long‐term fasting; remarkably, two thirds of the medicated subjects could reduce their antihypertensive medication.
Normotensive subjects stayed in the normal range, whereas female subjects with low baseline BP increased their BP within the normal range during long‐term fasting.
The management of high blood pressure (BP) is an important public health issue because it is one of the leading risk factors for cardiovascular diseases. Values ≥140/90 mm Hg are defined as hypertension by the International Society of Hypertension guidelines. 1 Genetic, environmental, and lifestyle factors contribute to the development of high BP, including stress, obesity, sedentary lifestyle, excess of alcohol consumption, smoking, and high salt intake. 2 Aging and insulin resistance are also associated with an increase in BP. Uncontrolled hypertension increases the risk of stroke, myocardial infarction, cardiac failure, dementia, renal failure, and blindness. 3
Lifestyle interventions are recommended as a first step to treat elevated BP. This can include 30 minutes of moderate physical exercise 5 to 7 days per week, moderation of alcohol consumption and salt intake (<6 g/d), cessation of smoking, and stress reduction. 4 , 5 Individuals are also advised to maintain a normal body mass index (BMI) and waist circumference (WC) (<102 cm in men and 88 cm in women).
When lifestyle modification fails, the use of antihypertensive medication is recommended. Patients can receive combinations of diuretics, adrenergic receptor blockers, calcium channel blockers, angiotensin‐converting enzyme inhibitors, angiotensin II receptor blockers, and renin inhibitors. 6 Antihypertensive drug treatments are effective and have a high medical importance. However, adverse drug effects are common. 7 They can reduce quality of life and impair compliance 2 and thus reduce the control of BP. 8 , 9 , 10 This is an unresolved medical problem. Further nonpharmacological strategies are thus needed to complement drug therapies. We aimed to evaluate the impact of fasting regimens in hypertensive medicated and nonmedicated subjects.
Fasting regimens have become increasingly popular in the past decade. Fasting is an important adaptive mechanism developed by animals to cope with cyclical seasonal variations in food availability. The mobilization of energy stored in fat tissues ensured survival of animals and humans when food was not readily available. Fasting has also been shown to be associated with important health benefits, including a decrease in BP. 11 , 12
In the medical context, fasting is defined as a voluntary abstinence from food, or a reduction of total food intake, for short periods of 12 to 48 hours (intermittent fasting and time‐restricted eating) or longer periods of 48 hours to 21 days or more (long‐term fasting [LF] or periodic fasting 11 , 12 ). We investigated a LF program documented previously in a peer‐reviewed guideline. 13
Early studies documented that very long periods of fasting (up to 382 days) were used to treat massive obesity and comorbidities, including high BP. 14 A decrease in BP has been widely documented in obese subjects in other weight reduction programs. 15 LF as water‐only fasting, 16 or Buchinger type fasting, 17 , 18 was shown to diminish BP. A similar reduction in BP was documented for intermittent fasting 19 and calorie restriction. 2 We previously reported health outcomes in 1422 subjects undergoing LF therapy at the Buchinger Wilhelmi Clinic (BWC). 20 Herein, we report a comprehensive analysis of daily BP variation on an augmented sample size, including 1610 subjects who fasted in a specialized in‐patient medical center during a mean of 10.0±4.1 days followed by 3.0±0.9 days of food reintroduction. We focused on 313 hypertensive nonmedicated (HTNM), 377 hypertensive medicated (HTM), and 920 normotensive subjects to provide more insights into the effectiveness of fasting as a complementary therapy to mitigate high BP.
Methods
The authors declare that all supporting data are available within the article and its online supplementary files.
Participants
In total, 1610 subjects were included in this observational study. Inclusion criteria were a stay of ≥10 nights at the BWC, during which the subjects had to comply with its multidisciplinary fasting program. All participants gave their informed written consent and declared that during this period they were not participating in any other study. The age range was 18 to 99 years. Predefined contraindications were a BMI <16 kg/m2 and/or cachexia; anorexia nervosa or eating disorder; advanced kidney, liver, or cerebrovascular insufficiency; dementia or other debilitating cognitive disease; and pregnancy or lactation period. 13 Moreover, inclusion criteria were a minimal fasting length of 4 days and the obligation to stay at BWC during the period of food reintroduction. At the beginning of the stay, a blood examination was done. All participants had their baseline BP measured in the morning of the first fasting day.
Fasting periods ranged from 4 to 41 (10.0±3.8) days (Table S1). Subjects were divided according to their baseline BP values into 3 groups: normotensive nonmedicated (BP <140/<90 mm Hg), HTNM (BP ≥140/≥90 mm Hg), and HTM, either normotensive or still hypertensive. This corresponded to most major guidelines to classify an individual as hypertensive according to the last International Society of Hypertension practice guidelines. 1
Ethical Approval
The medical council of Baden‐Württemberg and the Ethics Committee of the Charité–University Medical Center, Berlin (application No. EA4/054/15), approved the prospective observational study on May 5, 2015. The study protocol was registered on June 3, 2016, in the German Clinical Trials Register (DRKS‐ID DRKS00010111). Written informed consent was obtained from all participants who were enrolled between January 1, 2016, and December 31, 2016. This study was conducted in accordance with the principles of the Declaration of Helsinki in the BWC in Überlingen (Germany). The follow‐up phase, consisting of a questionnaire administered 2 weeks, 3 months, and 11 months after the participants left the BWC, took place between January 26, 2016, and December 18, 2017. The follow‐up questionnaires were administered online using Typeform, Barcelona. The subjects received a link and an individual code in a standardized mail. Subjects had to enter their pseudonymized code and answer the follow‐up questions. To motivate the subjects to respond to the follow‐up questionnaires, they were given explanations by the nurse at departure. They could win a treatment voucher if they filled in the 3 follow‐up questionnaires. Despite this effort to motivate the subjects, the response to the follow‐up was limited after 2 weeks (n=448), 3 months (n=256), and 11 months (n=188). Because we could not exclude a response bias, we did not include this data set in the analysis. All the raw data are provided in supplementary material for the sake of clarity (Data S1). Correlations between the persistence of BP changes during the follow‐up period and the persistence of the weight loss are provided (Figure S1).
Fasting Program
The course of the fasting included daily supervision by trained nurses and physicians. One day before the start of the fasting, a 600‐kcal vegetarian diet of either rice and vegetables or fruits was served in 3 meals. All subjects underwent a physical examination before initiating the fasting period. On the first fasting day, the intestinal tract was emptied through the intake of a laxative (20–40 g NaSO4 in 500 mL water). During fasting, subjects were advised to drink 2 to 3 L/d of water or herbal teas. In addition, 20 g of honey was provided daily, as well as 250 mL organic fresh fruit juice at noon and 250 mL vegetable soup in the evening. On average, the total calorie intake was 200 to 250 kcal/d. The fasting was accompanied by physical activity, alternating with rest, in an environment that promotes calmness and mindfulness. During fasting every second day, an enema or a mild laxative was applied. The period of fasting was followed by a phase of refeeding, during which food was progressively reintroduced from 800 to 1600 kcal/d. This lasted up to 4 days.
Measurements
Clinical examinations were conducted according to the BWC standards. Data, including baseline demographic and clinical information, adverse effects, and laboratory results, were abstracted from medical records and captured in a secure, web‐based software platform called Research Electronic Data Capture. 21 Plausibility of the recorded data was verified continuously by automated checks (eg, for data range) during data entry.
BP, Medication, and Clinical Parameters
BP and pulse were measured by trained nurses every morning between 7:00 am and 9:00 am just after getting up from the night sleep and having only some steps to take place in the calm waiting space of the nurse ward. The measurement was conducted once on the nondominant arm in sitting position after resting for 5 minutes with an upper arm BP monitor (boso Carat professional; BOSCH+SOHN GmbH u. Co. KG, Jungingen, Germany). During follow‐up, subjects self‐reported their BP values 2 weeks, 3 months, and 11 months after fasting via online questionnaires. For the self‐measurement of BP, the subjects received an instruction to measure their BP as done in the clinic. Subjects without an upper arm BP monitor at home were advised to go to a pharmacy or their family physician. BP medication was regularly documented and monitored for adaptations of the medication. The drug intake was grouped according to the number of antihypertensive classes. Because fasting is known to reduce BP, medication had to be reduced in most of the cases to avoid hypotensive episodes. A fasting treatment guideline recommends to diminish and if possible to stop diuretics when fasting is initiated. 13 This was carefully monitored.
Body weight was measured by a nurse while subjects were lightly dressed (Seca 704; Seca, Hamburg, Germany) during the fasting program and the follow‐up stage. WC was measured before and at the end of fasting using a tape measure placed halfway between the lowest rib and the iliac crest (openmindz GmbH, Heidelberg, Germany). Height was determined with Seca 285 (Seca).
Well‐Being
Subjects self‐reported daily their well‐being. This happened under nurses’ supervision and later by means of an online follow‐up questionnaire.
The Well‐Being Index (World Health Organization 5 [WHO‐5]) is a questionnaire reflecting the positive mental attitude. Five statements had to be answered with responses between 0 (at no time) and 5 (all of the time). By adding up the factors for each response and multiplying by 4, we obtained ranges between 0 and 100, whereby 100 reflected the best possible level of well‐being. 22 The Well‐Being Index normally refers to the past 14 days, but in our study the time span was variable. In this study, we collected the data before and after fasting, as well as in the follow‐up period.
Lifestyle
Smoking habits were documented before and after the fasting period. Subjective stress level was rated on a scale from 0 (threatening tension) to 10 (total relaxation) before fasting and daily during fasting, as well as in the follow‐up questionnaires, which were administered to the subjects 2 weeks, 3 months, and 11 months afterwards.
Safety
Nurses and physicians monitored the subjects constantly over 24 hours. Adverse events were recorded in an adverse effects report form.
Clinical Blood Parameters
Baseline blood samples were collected at the beginning of the stay at the BWC by trained medical technical assistants in the morning. Blood glucose, glycated hemoglobin, cholesterol, low‐density lipoprotein cholesterol, high‐density lipoprotein cholesterol, and triglycerides, as well as sodium, were determined, as described in detail in a previously published report. 20
Categorization of Diagnoses
Subjects were categorized into groups of diagnoses that are usually associated with high BP, such as diabetes mellitus, when glycated hemoglobin levels were ≥6.5% or an assured diagnosis was noted in the medical report by the physician. Hyperlipidemia was documented when low‐density lipoprotein cholesterol levels were ≥4.14 mmol/L, and hypertriglyceridemia was documented when triglyceride levels were ≥1.7 mmol/L.
Metabolic syndrome was defined according to the National Cholesterol Education Program Adult Treatment Panel III conventions. Of the following 5 criteria, 3 have to be met for metabolic syndrome diagnosis 23 : WC >102 cm for men and >88 cm for women, BP ≥130/85 mm Hg, fasting glucose ≥5.6 mmol/L or known diabetes mellitus, triglycerides ≥1.7 mmol/L, and high‐density lipoprotein cholesterol levels <1.0 mmol/L for men and <1.3 mmol/L for women.
Statistical Analysis
The statistical analysis was performed using R (version 4.0.0) on a MacBook Pro with MacOS Catalina version 10.15.5. Data were formatted with dplyr (version 0.8.5). Differences at baseline (Table 1) were evaluated using an ANOVA test (continuous variables) or a χ2 goodness‐of‐fit test (categorical variables), with post hoc comparisons made using Tukey honestly significant difference tests (stats::TukeyHSD, version 4.0.0) or pairwise Fisher exact tests (rcompanion::pairwiseNominalIndependence version 2.3.25). We used a Self‐Starting Nls Asymptotic Regression Model (stats::Ssasymp) to fit an exponential decay to the variations in systolic BP (SBP) and diastolic BP (DBP) observed over the course of the fasting intervention using a nonlinear model (stats::nls). Differences in BP between the different time points or the different categories were evaluated using least squares means (emmeans:: emmeans, version 1.4.7) of a linear mixed model, considering the time point as a covariate and the repeated measure (patient grouping) as a random effect. P values were adjusted for multiple comparisons using Tukey adjustments. Figures were created using ggplot2 (version 3.3.0).
Table 1.
Summary Statistics Showing the Stratification of the Subjects in Clinically Relevant BP Categories
| Variable | Overall (n=1610) | Normotensive (n=920) | HTNM (n=313) | HTM (n=377) | P Value |
|---|---|---|---|---|---|
| Sex distribution, n (%) | <0.001 * , † , ‡ | ||||
| Women | 955 (59) | 630 (68) | 167 (53) | 158 (42) | |
| Men | 655 (41) | 290 (32) | 146 (47) | 219 (58) | |
| Age, y | 55.4±13.3 | 51.3±13.3 | 59.3±11.3 | 62.3±10.7 | <0.001 * , † , ‡ |
| Fasting length, d | 10.1±4.1 | 9.7±3.8 | 10.6±4.3 | 10.3±4.5 | <0.001 † , ‡ |
| Body mass index, kg/m2 | 27.9±5.6 | 26.3±4.8 | 29.9±6.4 | 30.3±5.4 | <0.001 † , ‡ |
| Weight, kg | 81.1±19.2 | 76.0±16.7 | 87.3±21.7 | 88.9±19.0 | <0.001 † , ‡ |
| WC, cm | 94.1±16.5 | 88.6±14.4 | 99.4±16.2 | 103.2±16.0 | <0.001 * , † , ‡ |
| DBP, mm Hg | 81.4±11.1 | 75.9±7.3 | 92.5±9.4 | 86.0±11.0 | <0.001 * , † , ‡ |
| SBP, mm Hg | 126.2±18.6 | 116.6±11.3 | 145.5±15.3 | 134.6±19.3 | <0.001 * , † , ‡ |
| Heart rate, bpm | 70.7±10.7 | 70.2±10.4 | 72.6±10.7 | 70.2±11.4 | 0.002 * , † |
| Glucose, mmol/L | 5.4±1.1 | 5.1±0.7 | 5.6±1.1 | 5.9±1.5 | <0.001 * , † , ‡ |
| Triglycerides, mmol/L | 1.5±0.8 | 1.4±0.6 | 1.7±0.9 | 1.8±1.0 | <0.001 * , † , ‡ |
| Cholesterol, mmol/L | 5.5±1.1 | 5.5±1.1 | 5.8±1.2 | 5.4±1.2 | <0.001 * , † |
| HDL‐C, mmol/L | 1.6±0.5 | 1.6±0.5 | 1.5±0.5 | 1.4±0.4 | <0.001 * , ‡ |
| LDL‐C, mmol/L | 3.5±1.0 | 0.6±1.3 | 0.8±1.5 | 0.6±1.3 | 0.01 * , † |
| HbA1c, % | 5.5±0.6 | 5.3±0.4 | 5.5±0.6 | 5.7±0.8 | <0.001 * , † , ‡ |
| Sodium, mmol/L | 140.1±2.9 | 140.0±2.9 | 140.2±2.2 | 139.9±3.1 | 0.47 |
| Well‐Being Index, % | 56.1±16.2 | 56.2±16.1 | 56.8±16.8 | 55.4±15.9 | 0.69 |
| Nicotine abuse, (%) | 0.20 | ||||
| No | 941 (58) | 532 (58) | 187 (60) | 222 (59) | |
| Yes | 176 (11) | 111 (12) | 26 (8) | 39 (10) | |
| Hyperlipidemia, n (%) | 0.003 † | ||||
| No | 1193 (74) | 711 (77) | 211 (67) | 271 (72) | |
| Yes | 386 (24) | 198 (22) | 96 (31) | 92 (24) | |
| Hypertriglyceridemia, n (%) | <0.001 † , ‡ | ||||
| No | 1099 (68) | 708 (77) | 190 (61) | 201 (53) | |
| Yes | 494 (31) | 206 (22) | 120 (38) | 168 (45) | |
| Diabetes mellitus, n (%) | <0.001 † , ‡ | ||||
| No | 1503 (93) | 894 (97) | 287 (92) | 322 (85) | |
| Yes | 107 (27) | 26 (3) | 26 (8) | 55 (15) | |
| Metabolic syndrome, n (%) | <0.001 * , † , ‡ | ||||
| No | 358 (22) | 128 (14) | 147 (47) | 83 (22) | |
| Yes | 399 (25) | 81 (9) | 155 (50) | 163 (43) |
The 1610 subjects were divided into different clinically relevant BP categories (normotensive, HTNM, and HTM) based on the BP value determined in the morning of the first fasting day or the intake of antihypertensive medication. The P value is indicated for the multigroup comparisons. Values represent the mean±SD unless otherwise indicated. BP indicates blood pressure; bpm, beats per minute; DBP, diastolic BP; HbA1c, glycated hemoglobin; HDL‐C, high‐density lipoprotein cholesterol; HTM, hypertensive medicated; HTNM, hypertensive nonmedicated; LDL‐C, low‐density lipoprotein cholesterol; SBP, systolic BP; and WC, waist circumference.
Adjusted P<0.05 for hypertensive vs medicated.
Adjusted P<0.05 for hypertensive vs normal.
Adjusted P<0.05 for medicated vs normal.
We used a variety of metabolic parameters (presented in Table 1) to predict the amplitude of the BP changes with the caret package (Classification And Regression Training) in R (version 6.0.86) on a training set constituting 75% of the patients randomly selected from our data set (seed number 123). The parameters "weight" and "waist circumference" had large variance inflation factors (calculated with car::vif[] function, version 3.0.7), and were thus dropped. They were highly collinear with BMI, which was left as an indicator of weight status. Missing values were imputed as column medians with randomForest:: na.roughfix(), version 4.6.14. Variables in the training sets were scaled and centered before a linear model was used to evaluate which are the most important predictors of the amplitude of the BP decrease with caret::train().
Results
During the observation period, 3929 subjects were admitted at the BWC. Of the 1901 eligible subjects, 121 did not undergo a fasting treatment and 170 were excluded because of a too‐short fasting length (n=7), not conducting the food reintroduction at BWC (n=27), incorrect or missing blood sampling (n=8), occurrence of an adverse effect (n=3), or missing baseline BP measurement in the nonmedicated subjects (n=125) (Figure 1).
Figure 1. Flowchart of the study population.
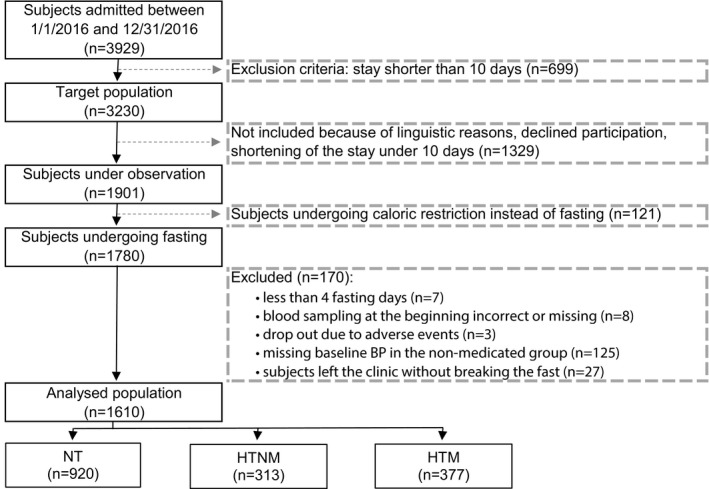
BP indicates blood pressure; HTM, hypertensive medicated; HTNM, hypertensive nonmedicated; and NT, normotensive.
We evaluated changes in BP caused by LF in 1610 subjects stratified into normotensive (n=920), HTNM (n=313), and HTM (n=377) categories (Table 1). Subjects with normotensive BP were predominantly women. The proportion of men was higher in HTNM and HTM categories. Normotensive subjects were younger than HTNM and HTM subjects (Table 1). In general, HTNM and HTM subjects had a poorer metabolic health. This is reflected by the increased proportion of individuals with metabolic syndrome in the HTNM and HTM categories. Overall, body weight, BMI, and WC were significantly lower in normotensive subjects than in HTNM and HTM subjects (Table 1). In addition, glucose, glycated hemoglobin, and triglyceride levels were highest in HTM subjects, whereas total cholesterol level was lower. The latter effect could be caused by the fact that 31.8% of the subjects in the HTM group took lipid‐lowering drugs, by contrast to 9.3% in the HTNM group and 6.6% in the normotensive subjects. Sodium levels, Well‐Being Index, and smoking status did not differ between the 3 groups.
Adverse effects were reported in 19 of 1610 subjects (1.2%). The following effects were documented: cardiac arrhythmia, n=3; eczema, n=3; dizziness, n=2; hypoglycemia, n=2; hypokalemia, n=2; hyponatremia, n=2; and single cases of bleeding gums, spasmodic abdominal pain, visual disorder, gout, hyperventilation, outbreak of infection, pleuropneumonia, syncope, tetany, and vomiting. Two subjects were hospitalized because of myocardial infarction and vomiting. Except for the 2 latter participants, all subjects continued fasting.
Effects of LF on BP
We first examined the daily changes in BP. The baseline BP levels varied between 116.6±11.3/75.9±7.3 mm Hg for normotensive and 145.5±15.3/92.5±9.4 mm Hg for HTNM subjects. Of the 1610 subjects, 377 took antihypertensive drugs, with a mean baseline BP of 134.6±19.3/86.0±11.0 mm Hg. Linear‐mixed models of the day‐to‐day changes in BP, adjusted for BMI and sex, showed that a significant decrease in SBP (Table S2) and DBP (Table S3) was documented for the HTNM group from the first day of the fast (Figure 2A and 2C). For normotensive subjects, SBP and DBP significantly differed from baseline from the 8+ day of fast (Figure 2B and 2D). For HTM subjects, BP significantly starting to differ from baseline on the third day for DBP (Figure 2F), and from the fifth day for SBP (Figure 2E). The effect of LF on BP (Tables S4 through S7) was comparable in men (Figure S2) and women (Figure S3).
Figure 2. Systolic blood pressure (SBP) and diastolic blood pressure (DBP) levels are normalized during long‐term fasting.
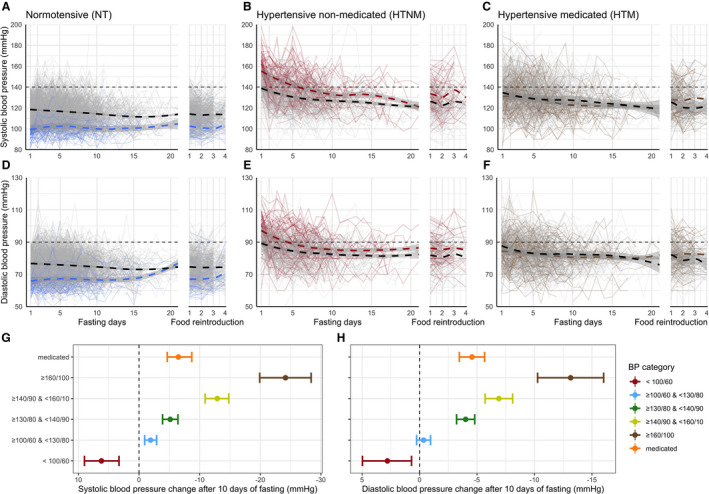
The blood pressure (BP) in normal (A, SBP; D, DBP), hypertensive (B, SBP; E, DBP), and medicated subjects (C, SBP; F, DBP) is presented during the first 20 days of fast and the consecutive refeeding. Individual changes in BP are displayed as gray lines. Smoothed conditional means are plotted as dashed lines to illustrate global trends. A color code is used to highlight subgroups consisting of 74 subjects with low BP (<100/60 mm Hg; in blue in A and D), 76 subjects with high BP (>160/100 mm Hg; in red in B and E), as well as 89 subjects who stopped their antihypertensive treatment (in brown in C and F). We also provided a summary of the changes in BP amplitude for SBP after 10 days of fasting (G) and DBP (H). Sex‐specific changes in BP are presented in supplementary material Figure S2 (men) and Figure S3 (women).
The group of normotensive subjects included 74 individuals (69 women and 5 men) with a BP <100/60 mm Hg. Their BP increased during the course of the intervention (Figure 2A and 2C). The least square mean increase from baseline to the end of the fast was 7.3±1.5/3.1±1.2 mm Hg (P<0.001) (Figure 2G and 2H). Considering women only, we documented an increase of 6.3/2.2 mm Hg.
In HTNM and HTM subjects (Figure 2), the decrease in SBP and DBP over the fasting course was exponential and showed an asymptotic floor effect. Horizontal asymptotes from the nonlinear model were reached for the HTNM at 126.0±1.0/82.6±0.4 mm Hg and the HTM at 123.2±2.6/80.1±0.6 mm Hg (P<0.001). The reduction in BP was the highest for the HTNM subjects with the most elevated starting BP values (Figure 2G and 2H). Among 76 HTNM subjects with BP levels >160/100 mm Hg, SBP and DBP were reduced by 23.1±2.0/13.0±1.3 mm Hg (P<0.001). In contrast, BP was unchanged by fasting in the group of subjects with a healthy BP (>100/60 and <120/80 mm Hg), as evidenced by the mean BP changing from 110.3±5.0/71.8±4.5 to 108.9±10.7/71.4±6.8.
Of the 377 HTM subjects, 89 stopped their BP treatment according to the physicians’ prescription. Although the changes in BP from baseline were not statistically significant for these 89 subjects (reduction of 1.2±1.7/2.5±1.3 mm Hg; P=0.44), it is noteworthy that the BP was substantially decreased in some individuals who stopped their BP treatment (Figure 2E and 2F).
Persistence of Metabolic Changes
In the HTNM group, 190 of the 313 subjects shifted at the end of the fasting to the normal BP category (Table 2). As many as 265 of the 377 medicated subjects normalized their BP at the end of fasting, despite reductions in medication.
Table 2.
Number of Individuals in the Different BP Categories After Fasting and Subsequent Food Reintroduction, Reflecting the BP Normalization Divided According to the Fasting Lengths of 5±2, 10±2, and 15±2 and More Days
| Variable | Hypertensive | |||||
|---|---|---|---|---|---|---|
| Nonmedicated (n=313) | Medicated (n=377) | |||||
| 5 | 10 | ≥15 | 5 | 10 | ≥15 | |
| (n=75) | (n=159) | (n=79) | (n=116) | (n=178) | (n=83) | |
| BP after fasting, n (%) | ||||||
| Normalized | 42 (56) | 98 (62) | 50 (63) | 78 (67) | 126 (71) | 61 (73) |
| Hypertensive | 33 (44) | 61 (38) | 29 (37) | 37 (32) | 52 (29) | 22 (27) |
| BP after food reintroduction, n (%) | ||||||
| Normalized | 43 (57) | 93 (58) | 56 (71) | 80 (69) | 120 (67) | 59 (71) |
| Hypertensive | 24 (32) | 49 (31) | 17 (22) | 33 (28) | 51 (29) | 23 (28) |
| Missing | 8 (10.7) | 17 (10.7) | 6 (7.6) | 3 (2.6) | 7 (3.9) | 1 (1.2) |
BP indicates blood pressure.
There were no differences in SBP or DBP levels between the measure taken during the examination on the last day of the fast and the measure at the fourth day of the food reintroduction phase, showing that the reduction of BP caused by fasting persisted during the food reintroduction phase.
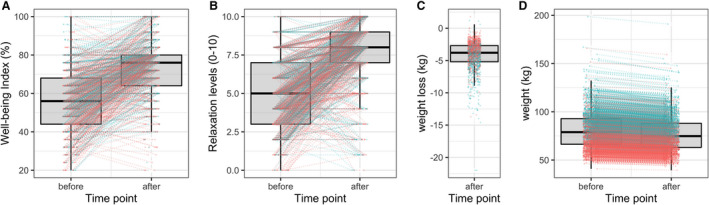
LF induced a significant weight reduction in the whole cohort from 81.1±19.2 to 77.0±18.4 kg (P<0.001) (Figure 3). In total, 636 subjects (39.5%) reduced their body weight ≥5% during fasting. WC decreased for all from 94.1±16.5 to 88.1±15.1 cm (P<0.001) during fasting. The Well‐Being Index was significantly enhanced for the whole cohort by 17.2% during the fasting program (P<0.001). Moreover, self‐reported relaxation level improved during the fasting from 4.9±2.2 to 7.8±2.1 on a visual scale from 0 to 10 points (P<0.001).
Figure 3. Changes in blood pressure are concomitant to an increased well‐being and a weight loss. Well‐being (A), relaxation levels (B), weight loss (C), and weight change (D) were evaluated before and after long‐term fasting (men, blue; women, red).
Effect of LF on BP Medication
Subjects under drug treatment took on average 1.74 drugs at baseline (Table 3). The following antihypertensive medication was documented: angiotensin II receptor antagonist, n=180; adrenergic receptor blocker use, n=149; diuretic use, n=129; angiotensin‐converting enzyme inhibitor use, n=104; calcium channel blocker use, n=90; and renin inhibitor use, n=4. A single medication was prescribed in 44.8%, a combination of 2 drugs in 38.7%, and a combination of 3 or 4 drugs in 16.5% of the subjects.
Table 3.
Antihypertensive Drug Intake at Baseline
| Variable | All | Men | Women | |||
|---|---|---|---|---|---|---|
| No. | % | No. | % | No. | % | |
| Total BP drug intake | 377 | 100.0 | 219 | 100.0 | 158 | 100.0 |
| Intake of 1 BP drug | 169 | 44.8 | 98 | 44.7 | 71 | 44.9 |
| Intake of 2 BP drugs | 146 | 38.7 | 83 | 37.9 | 63 | 39.9 |
| Intake of 3 BP drugs | 53 | 14.1 | 31 | 14.2 | 22 | 13.9 |
| Intake of 4 BP drugs | 9 | 2.4 | 7 | 3.2 | 2 | 1.3 |
| Mean intake of antihypertensive substances | 1.74 | 1.78 | 1.72 | |||
| Diuretic use | 129 | 19.7 | 67 | 17.4 | 62 | 22.9 |
| Adrenergic receptor blocker use | 149 | 22.7 | 85 | 22.1 | 64 | 23.6 |
| Calcium channel blocker use | 90 | 13.7 | 56 | 14.5 | 34 | 12.5 |
| ACE inhibitor use | 104 | 15.9 | 70 | 18.2 | 34 | 12.5 |
| Angiotensin II receptor antagonist | 180 | 27.4 | 107 | 27.8 | 73 | 26.9 |
| Renin inhibitor use | 4 | 0.6 | 0 | 0.0 | 4 | 1.5 |
ACE indicates angiotensin‐converting enzyme; and BP, blood pressure.
The antihypertensive medication was adapted according to the BP changes during fasting (Table 4). As many as 89 of the 377 medicated subjects (23.6%) stopped the intake of BP drugs. Their BP values went concomitantly from 129.1/84.3 to 127.8/81.6 mm Hg after an average of 10 days of fasting. Furthermore, 43.5% were able to reduce the medication. In 19.4%, the medication was unchanged and BP values went from 136.8/86.2 to 128.1/81.1 mm Hg. The medication had to be changed to other active substances in 6 subjects; and in 12 subjects, the dosage was increased, because of insufficient dosage of the medication at baseline. It was not possible to evaluate the BP drug change in 8.7% because of missing data.
Table 4.
Change in the Intake of Antihypertensive Drug Intake During LF. Subjects were grouped according to the fasting lengths of 5±2, 10±2, and 15±2 and more days.
| Variable | 5 (n=116) | 10 (n=178) | ≥15 (n=83) | Overall (n=377) |
|---|---|---|---|---|
| Changed | 4 (3.4) | 1 (0.6) | 1 (1.2) | 6 (1.6) |
| Increased | 3 (2.6) | 6 (3.4) | 3 (3.6) | 12 (3.2) |
| Reduced | 51 (44.0) | 73 (41.0) | 40 (48.2) | 164 (43.5) |
| Stopped | 28 (24.1) | 42 (23.6) | 19 (22.9) | 89 (23.6) |
| Unchanged | 20 (17.2) | 36 (20.2) | 17 (20.5) | 73 (19.4) |
| Unknown | 10 (8.6) | 18 (11.2) | 3 (3.6) | 31 (8.7) |
Data are given as number (percentage). LF indicates long‐term fasting.
Influence of Other Metabolic Parameters on the BP Reduction
It appeared that BP response to fasting was highly variable and individualized. To understand why BP normalized in some subjects while it decreased in some others, we then evaluated whether clinical parameters measured before the fasting intervention or demographic factors could inform on the amplitude of the BP decrease. Subjects were then split in 2 groups, one constituting 75% of the subjects, which was used to train a machine learning algorithm, whereas the remaining 25% of subjects were used to test this algorithm on an independent sample. The correlation between the predicted values and actual values in the test set was statistically significant (P<2.2e‐16 for SBP and DBP). This was because of the large influence of the baseline BP, which is strongly linked to the changes in BP observed during LF (Figure 4), as described above. Even when the BP baseline parameters were dropped, the prediction of the changes in SBP caused by fasting was still statistically significant (Pearson coefficient, 0.15; 95% CI, 0.06–0.25; P=0.002).
Figure 4. Baseline parameters can predict the changes in blood pressure (BP) during long‐term fasting (LF).
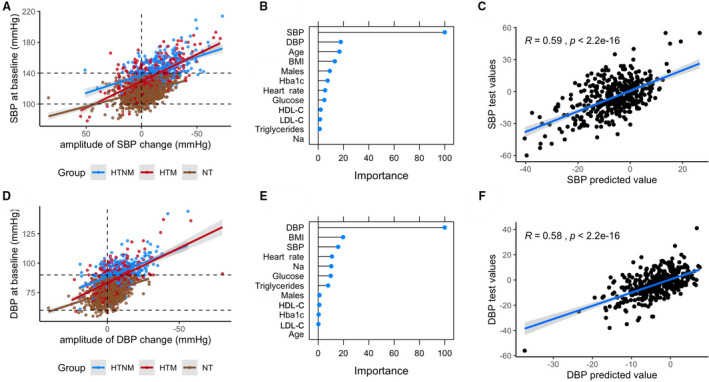
Baseline BP is strongly associated to the amplitude of systolic BP (SBP) (A) and diastolic BP (DBP) (D) changes during LF. A machine learning model including baseline metabolic parameters was trained on 75% of the data. This model was used to predict BP changes on a test data set constituted of the remaining 25% of the data. The most important predictors are presented (B, SBP; E, DBP), along with the reliability of the predictions on the test data set (C, SBP; F, DBP). BMI indicates body mass index; HbA1c, glycated hemoglobin; HDL‐C, high‐density lipoprotein cholesterol; HTM, hypertensive medicated; HTNM, hypertensive nonmedicated; LDL‐C, low‐density lipoprotein cholesterol; Na, sodium; and NT, normotensive.
Aside from the roles of the baseline BP and the fasting length, which are extensively described above, the metabolic parameters that were the most important to predict BP changes were age, BMI, and lipid and glucose parameters indicative of metabolic syndrome (Figure 4). The predictive ability of the body weight and the WC was the same as BMI, but these factors were not included in the final model to avoid multicollinearity. As a matter of fact, a linear mixed model using daily weights as predictors showed that the decrease in body weight has an influence on the decrease in BP (P<2e‐16). Collectively, this analysis shows that individuals with poor metabolic health are more likely to display substantial reductions in BP. However, most of the parameters investigated were collinear because BMI generally increases with age, associated with metabolic impairments: All of these are intimately linked to the BP.
Discussion
The present study reports BP variations during LF in a large cohort of 1610 subjects, documenting concomitant changes in antihypertensive medication. We found that LF affects BP with a nonlinear time response, leading to a normalization and a floor effect. A common issue occurring when drugs that lower BP are stopped is a rebound effect. 24 In our study, the BP‐lowering effect of LF led to the reduction of the intake of antihypertensive drugs in 43.5% of the medicated subjects. In addition, 23.6% of subjects were able to stop the medication. In both cases, reduction and stopping of medication, the decrease in BP was maintained during the whole fasting period as well as during the period of food reintroduction. The food was reintroduced stepwise during 4 days, increasing from 800 to 1600 kcal, thus remaining hypocaloric. Further studies are needed to close the gap of knowledge on the long‐term maintenance of the effects observed in this study. Although BP decreased in hypertensive subjects during fasting, in accordance with the results of earlier studies, 17 , 18 , 25 we reported that BP increased in a subgroup of female subjects with a BP <100/60 mm Hg. It is not clear if this subgroup had hypotensive symptoms, and therefore we cannot evaluate the clinical relevance of the observed increase in BP. Remarkably, BP was unchanged in subjects with a healthy BP of ≈110/70 mm Hg.
Previous scientific studies were mostly performed on relatively small groups of individuals. A period of 10.5 days of water‐only fasting in 174 hypertensive subjects led to an average reduction of 37/13 mm Hg. 16 In another study, 10 to 21 days of fasting, according to the BWC program in 124 subjects with nontreated high BP, led to a mean reduction of 34/17 mm Hg. 18
An explanation for the observed results could be that the lifestyle recommendations to treat elevated BP 5 were all addressed by the fasting program of the BWC. A significant mean weight loss and a diminution of WC were documented. Natriuresis contributes to the rapid weight loss at the beginning of the fast until sodium and protein sparing mechanisms occur after a few days in humans and animals. 11 , 26 , 27 Furthermore, daily physical exercise is part of the multidisciplinary fasting program, as well as low sodium intake and abstinence from alcohol. Stress reduction in the course of fasting was documented on visual scales as well as by an increase in the Well‐Being Index. Absence of daily life stress during the trial, and thus the potentially improved sleep, or the increased relaxation, could have contributed to the BP‐lowering effect. However, we cannot quantify the role of these factors with the present study design. Randomized trials should be performed to further evaluate the BP reducing effect of LF and the role of unspecific factors.
Further explanations could be the similarities between the effects of fasting and antihypertensive drugs on key mechanisms of BP regulation at the level of natriuresis, the autonomous nervous system, the renin‐angiotensin‐aldosterone system, and the endothelial function. The main BP lowering occurred during the first 5 days, pointing to the physiological changes that happen at the onset of fasting. Sodium is eliminated along with ketone bodies until ammonium replaces sodium after a few days, when gluconeogenesis takes place mainly in the kidneys rather than in the liver. 28 Furthermore, an elevation of cardiac natriuretic peptides (NPs) has been observed. 29 , 30 NPs enhance sodium and chloride excretion in the kidney, inhibit adipocyte proliferation, activate lipolysis, and increase the availability of free fatty acids for substrate oxidation. 31 In obese hypertensive subjects, the expression of the clearance receptor for NPs is enhanced. Fasting inhibits its expression, thus leading to normalized levels of NPs. 32 , 33 Natriuresis could partly explain the effects of LF on BP by modulating blood volume, 34 and it is therefore generally recommended to discontinue diuretic medication during fasting, to avoid hyponatremia or hypotensive episodes. 13 , 35
Profound hormonal changes during fasting contribute to the BP normalization. Catecholamine levels, reflecting sympathetic nervous system activity, decrease after an initial activation. 36 A 16‐day fast (230 kcal/d) in obese subjects documented the largest decrease in norepinephrine and BP on the second fasting day. 37 In addition, an increase in parasympathetic activity was documented in rodents on either alternate‐day fasting or 40% calorie restriction, triggered by brain‐derived neurotrophic factor via cholinergic neurons and diminished resting heart rate. 38 , 39 Because a large number of BP drugs act at the level of the sympathetic nervous system, it could be hypothesized that the sustained attenuation of sympathetic nervous system, concomitant to an increase in parasympathetic activity, during fasting could explain the absence of a rebound effect. 40
Furthermore, insulin resistance is also known to contribute to the pathogenesis of hypertension by inhibiting the physiological vasodilatory effect of insulin. 41 , 42 Hyperinsulinemia has antinatriuretic effects. It stimulates directly renal tubular reabsorption and decreases circulating levels of NPs. 31 The insulin lowering effect of fasting is well documented. 43 We reported that 10 days of LF led to a significant reduction of the insulin levels in 15 healthy men. 44 In addition, 4 to 21 fasting days in 1422 subjects improved blood glucose and glycated hemoglobin levels. 20
In our study, the significant weight loss (≈5%) is likely to have a profound impact on BP reduction through lowering the renin‐angiotensin‐aldosterone system. Thirteen weeks of calorie restriction reduced levels of angiotensinogen (−27%), renin (−43%), aldosterone (−31%), angiotensin‐converting enzyme activity (−12%), and angiotensinogen expression in adipose tissue (−20%) in postmenopausal women. 45 This was concomitant to a 5% weight loss and an SBP reduction of 7 mm Hg. In another study, a 5‐week dietary intervention with 40% calorie restriction showed similarly reduced plasma renin activity, aldosterone levels, and angiotensin‐converting enzyme activity. 46
Fasting can impact the peripheral vascular system through adiponectin‐mediated endothelial nitrogen monoxide production, leading to vasodilatation. 47 , 48 Intermittent fasting increased the circulating adiponectin levels in rats, 49 as well as alternate‐day fasting in mice. 50 In obese adults, an 8‐week alternate‐day fasting did not change adiponectin levels. 51 Moreover, chronic hyperleptinemia is also related to obesity‐associated hypertension. Leptin stimulates the secretion of aldosterone, leading to endothelial dysfunction, and further increases sympathetic nerve activity by binding to leptin receptors in the central nervous system. 52 , 53 , 54 LF reduces circulating leptin levels. 55 Although we did not measure adipokines, the positive effects seen in other fasting studies could also contribute to the observed BP normalization in our cohort.
Because the response to our follow‐up questionnaires was low (27.8% after 2 weeks, 15.9% after 3 months, and 11.7% after 11 months), because of difficulties in questioning the participants several months after they left the clinic, we did not include these data in our analysis because it was not possible to control for a possible response bias. The persistence of long‐term effects has to be tested in a more accurate follow‐up group in future studies.
Altogether, 253 of the 377 medicated subjects reduced or stopped their antihypertensive medication. In 12 subjects, the BP treatment had to be increased because of the fact that the baseline prescription of the antihypertensive drugs was insufficient. Hypertension is often characterized by long‐term drug treatment. Long‐term intake could lead to a resistance to the medical treatment and to an increase in the needed dosage. 56 Furthermore, dose‐related adverse effects (eg, dizziness, fatigue, headaches, renal insufficiency, tachycardia, hyponatremia, hyperkalemia, hyperglycemia, depression, and impotence) are well known under antihypertensive intake. 7 , 9 , 10 The acceptance is poor, leading to patients skipping doses or quitting the drug treatment. 57 In contrast, compliance is high when subjects undergo a voluntary fasting therapy. 20 Reasons therefore could be the above‐demonstrated increase in well‐being, the absence of hunger feelings, and the improvement of individual major health complaints. 20 It might be comprehensible that subjects under antihypertensive treatment feel relieved when they can stop their drug intake and improve their BP profile during fasting. Furthermore, it can be hypothesized that the fasting‐dependent interruption in antihypertensive drug intake, as well as improvements in weight and thus fat mass, insulin and leptin sensitivity, or NP clearance receptors in adipose tissue, could contribute to a resensitization of the BP regulation. This could at least temporarily reduce the prescribed drug dosage, leading to reduced adverse effects.
Some limitations apply to our study. The BP measurements, repeated daily, were conducted only once every day, and details on preexisting antihypertensive treatments were not documented. Despite the large number of participants, it was not possible to match the groups because of the size of the groups of hypertensive and medicated subjects and the observational study design. In addition, the follow‐up response was low, introducing selection bias and limiting interpretation. Long‐term effects remain to be investigated. This present study nonetheless lays the foundation for further studies focusing on the long‐term effects of LF on BP. A key point for further studies would be to understand if BP changes caused by LF can differ between individuals treated with different types of drugs.
Conclusions
In conclusion, the LF protocol used in our study is a safe and well‐tolerated approach to normalize elevated BP in subjects with and without antihypertensive drug intake. LF affects BP through several mechanisms, such as weight reduction and lifestyle changes. The mechanisms by which LF decreases BP are similar to those of antihypertensive drugs that act on natriuresis, sympathetic nervous system, renin‐angiotensin‐aldosterone system, and endothelial function. We describe how LF can be a strategy to reduce hypertension, and to transiently reduce or even stop antihypertensive treatments. Fasting appears to be a promising nonpharmacological complementary approach in the treatment of hypertension.
Sources of Funding
The study was financed by Amplius GmbH, Überlingen, Germany. This company has the task to develop a research department for the Buchinger Wilhelmi Clinics Überlingen and Marbella, who are the funders. Amplius GmbH had no role in the design, analysis, or writing of this article. No additional external funding was received for this study.
Disclosures
Dr Wilhelmi de Toledo is managing director of Amplius GmbH. Dr Mesnage and Dr Michalsen are consultants of Amplius GmbH and receive financial compensation for this role. Dr Wilhelmi de Toledo and F. Grundler are employees of Buchinger Wilhelmi Clinic. The remaining authors have no disclosures to report.
Supporting information
Tables S1–S7
Figures S1–S3
Data S1
Acknowledgments
We thank the study patients for their participation and the physicians and nursing staff of the Buchinger Wilhelmi Clinic for their cooperation.
Author contributions: Dr Wilhelmi de Toledo, F. Grundler, and Dr Michalsen conceived and conceptualized the study. F. Grundler was project manager and coordinated study conduction and data collection. Dr Mesnage performed the bioinformatics and statistical analysis. F. Grundler, Dr Mesnage, and Dr Wilhelmi de Toledo drafted the manuscript. All authors contributed to data interpretation and the revision and editing of the final manuscript.
(J Am Heart Assoc. 2020;9:e018649 DOI: 10.1161/JAHA.120.018649.)
Supplementary Materials for this article are available at https://www.ahajournals.org/doi/suppl/10.1161/JAHA.120.018649
For Sources of Funding and Disclosures, see page 12.
References
- 1. Unger T, Borghi C, Charchar F, Khan NA, Poulter NR, Prabhakaran D, Ramirez A, Schlaich M, Stergiou GS, Tomaszewski M, et al. 2020 International Society of Hypertension global hypertension practice guidelines. Hypertension. 2020;75:1334–1357. [DOI] [PubMed] [Google Scholar]
- 2. Nicoll R, Henein M. Caloric restriction and its effect on blood pressure, heart rate variability and arterial stiffness and dilatation: a review of the evidence. Int J Mol Sci. 2018;19:751. [DOI] [PMC free article] [PubMed] [Google Scholar]
- 3. Dorans KS, Mills KT, Liu Y, He J. Trends in prevalence and control of hypertension according to the 2017 American College of Cardiology/American Heart Association (ACC/AHA) Guideline. J Am Heart Assoc. 2018;7:e008888 DOI: 10.1161/JAHA.118.008888. [DOI] [PMC free article] [PubMed] [Google Scholar]
- 4. Mancia G, Fagard R, Narkiewicz K, Redán J, Zanchetti A, Böhm M, Christiaens T, Cifkova R, De Backer G, Dominiczak A. 2013 Practice guidelines for the management of arterial hypertension of the European Society of Hypertension (ESH) and the European Society of Cardiology (ESC): ESH/ESC Task Force for the Management of Arterial Hypertension. J Hypertens. 2013;31:1925–1938. [DOI] [PubMed] [Google Scholar]
- 5. Bakris G, Ali W, Parati G. ACC/AHA versus ESC/ESH on hypertension guidelines: JACC guideline comparison. J Am Coll Cardiol. 2019;73:3018–3026. [DOI] [PubMed] [Google Scholar]
- 6. Whelton PK, Carey RM, Aronow WS, Casey DE, Collins KJ, Himmelfarb CD, DePalma SM, Gidding S, Jamerson KA, Jones DW. 2017 ACC/AHA/AAPA/ABC/ACPM/AGS/APhA/ASH/ASPC/NMA/PCNA guideline for the prevention, detection, evaluation, and management of high blood pressure in adults: a report of the American College of Cardiology/American Heart Association Task Force on Clinical Practice Guidelines. Circulation. 2018;138:e484–e594. [DOI] [PubMed] [Google Scholar]
- 7. Laurent S. Antihypertensive drugs. Pharmacol Res. 2017;124:116–125. [DOI] [PubMed] [Google Scholar]
- 8. Suthar J, Pathak A, Shelat B. Comparison of safety and efficacy of different class of anti‐hypertensive drugs prescribed in patients with hypertension. Indian J Pharm Pract. 2019;12:257. [Google Scholar]
- 9. Cao Y, Xiang X, Song J, Tian Y, Wang M, Wang X, Li M, Huang Z, Wu Y, Wu T. Distinct effects of antihypertensives on depression in the real‐world setting: a retrospective cohort study. J Affect Disord. 2019;259:386–391. [DOI] [PubMed] [Google Scholar]
- 10. Tarukallo N, Rasyid H. Anti‐hypertensive drugs and sexual dysfunction in men. J Health Sci. 2020;13:1–11. [Google Scholar]
- 11. Wilhelmi de Toledo F, Grundler F, Sirtori CR, Ruscica M. Unravelling the health effects of fasting: a long road from obesity treatment to healthy life span increase and improved cognition. Ann Med. 2020;52:147–161. [DOI] [PMC free article] [PubMed] [Google Scholar]
- 12. de Cabo R, Mattson MP. Effects of intermittent fasting on health, aging, and disease. N Engl J Med. 2019;381:2541–2551. [DOI] [PubMed] [Google Scholar]
- 13. Wilhelmi de Toledo F, Buchinger A, Burggrabe H, Hölz G, Kuhn C, Lischka E, Lischka N, Lützner H, May W, Ritzmann‐Widderich M. Fasting therapy‐an expert panel update of the 2002 consensus guidelines. Forsch Komplementmed. 2013;20:434–443. [DOI] [PubMed] [Google Scholar]
- 14. Stewart W, Fleming LW. Features of a successful therapeutic fast of 382 days' duration. Postgrad Med J. 1973;49:203–209. [DOI] [PMC free article] [PubMed] [Google Scholar]
- 15. Bricarello LP, Poltronieri F, Fernandes R, Retondario A, de Moraes Trindade EBS, de Vasconcelos FdAG. Effects of the dietary approach to stop hypertension (DASH) diet on blood pressure, overweight and obesity in adolescents: a systematic review. Clin Nutr ESPEN. 2018;28:1–11. [DOI] [PubMed] [Google Scholar]
- 16. Goldhamer A, Lisle D, Parpia B, Anderson SV, Campbell TC. Medically supervised water‐only fasting in the treatment of hypertension. J Manipulative Physiol Ther. 2001;24:335–339. [DOI] [PubMed] [Google Scholar]
- 17. Li C, Ostermann T, Hardt M, Lüdtke R, Broecker‐Preuss M, Dobos G, Michalsen A. Metabolic and psychological response to 7‐day fasting in obese patients with and without metabolic syndrome. Complement Med Res. 2013;20:413–420. [DOI] [PubMed] [Google Scholar]
- 18. Müller H, Wilhelmi de Toledo F, Schuck P, Resch K. Blutdrucksenkung durch Fasten bei adipösen und nichtadipösen Hypertonikern. Perfusion. 2001;14:108–112. [Google Scholar]
- 19. Stekovic S, Hofer SJ, Tripolt N, Aon MA, Royer P, Pein L, Stadler JT, Pendl T, Prietl B, Url J. Alternate day fasting improves physiological and molecular markers of aging in healthy, non‐obese humans. Cell Metab. 2019;30:462–476.e465. [DOI] [PubMed] [Google Scholar]
- 20. Wilhelmi de Toledo F, Grundler F, Bergouignan A, Drinda S, Michalsen A. Safety, health improvement and well‐being during a 4 to 21‐day fasting period in an observational study including 1422 subjects. PLoS One. 2019;14:e0209353. [DOI] [PMC free article] [PubMed] [Google Scholar]
- 21. Harris PA, Taylor R, Minor BL, Elliott V, Fernandez M, O'Neal L, McLeod L, Delacqua G, Delacqua F, Kirby J, et al. The REDCap consortium: building an international community of software platform partners. J Biomed Inform. 2019;95:103208. [DOI] [PMC free article] [PubMed] [Google Scholar]
- 22. Bech P. Measuring the dimension of psychological general well‐being by the WHO‐5. Quality of Life Newsletter. 2004;32:15–16. [Google Scholar]
- 23. Moebus S, Hanisch JU, Neuhäuser M, Aidelsburger P, Wasem J, Jöckel K‐H. Assessing the prevalence of the metabolic syndrome according to NCEP ATP III in Germany: feasibility and quality aspects of a two step approach in 1550 randomly selected primary health care practices. Ger Med Sci. 2006;4:Doc07. [PMC free article] [PubMed] [Google Scholar]
- 24. Reidenberg MM. Drug discontinuation effects are part of the pharmacology of a drug. J Pharmacol Exp Ther. 2011;339:324–328. [DOI] [PMC free article] [PubMed] [Google Scholar]
- 25. Goldhamer AC, Lisle DJ, Sultana P, Anderson SV, Parpia B, Hughes B, Campbell TC. Medically supervised water‐only fasting in the treatment of borderline hypertension. J Altern Complement Med. 2002;8:643–650. [DOI] [PubMed] [Google Scholar]
- 26. Lignot J‐H, LeMaho Y. A history of modern research into fasting, starvation, and inanition In: McCue MD, ed. Comparative Physiology of Fasting, Starvation, and Food Limitation. Berlin, Heidelberg: Springer; 2012:7–23. [Google Scholar]
- 27. Viallon M, Leporq B, Drinda S, Wilhelmi de Toledo F, Galusca B, Ratiney H, Croisille P. Chemical‐shift‐encoded magnetic resonance imaging and spectroscopy to reveal immediate and long‐term multi‐organs composition changes of a 14‐days periodic fasting intervention: a technological and case report. Front Nutr. 2019;6:5. [DOI] [PMC free article] [PubMed] [Google Scholar]
- 28. Kerndt PR, Naughton JL, Driscoll CE, Loxterkamp DA. Fasting: the history, pathophysiology and complications. West J Med. 1982;137:379–399. [PMC free article] [PubMed] [Google Scholar]
- 29. Maoz E, Shamiss A, Peleg E, Salzberg M, Rosenthal T. The role of atrial natriuretic peptide in natriuresis of fasting. J Hypertens. 1992;10:1041–1044. [PubMed] [Google Scholar]
- 30. Spark RF, Arky RA, Boulter PR, Saudek CD, O'Brian JT. Renin, aldosterone and glucagon in the natriuresis of fasting. N Engl J Med. 1975;292:1335–1340. [DOI] [PubMed] [Google Scholar]
- 31. Sarzani R, Spannella F, Giulietti F, Balietti P, Cocci G, Bordicchia M. Cardiac natriuretic peptides, hypertension and cardiovascular risk. High Blood Press Cardiovasc Prev. 2017;24:115–126. [DOI] [PMC free article] [PubMed] [Google Scholar]
- 32. Cannone V, Cabassi A, Volpi R, Burnett JC. Atrial natriuretic peptide: a molecular target of novel therapeutic approaches to cardio‐metabolic disease. Int J Mol Sci. 2019;20:3265. [DOI] [PMC free article] [PubMed] [Google Scholar]
- 33. Dessì‐Fulgheri P, Sarzani R, Serenelli M, Tamburrini P, Spagnolo D, Giantomassi L, Espinosa E, Rappelli A. Low calorie diet enhances renal, hemodynamic, and humoral effects of exogenous atrial natriuretic peptide in obese hypertensives. Hypertension. 1999;33:658–662. [DOI] [PubMed] [Google Scholar]
- 34. Davidson MB. Role of ketogenesis in urinary sodium excretion: elucidation by nicotinic acid administration during fasting*. J Clin Endocrinol Metab. 1979;49:818–823. [DOI] [PubMed] [Google Scholar]
- 35. Lischka E. Kombinierte Fastentherapie zur Behandlung der primären arteriellen Hypertonie. Erfahrungsheilkunde. 2014;63:36–41. [Google Scholar]
- 36. Wan R, Camandola S, Mattson MP. Intermittent food deprivation improves cardiovascular and neuroendocrine responses to stress in rats. J Nutr. 2003;133:1921–1929. [DOI] [PubMed] [Google Scholar]
- 37. Göhler L, Hahnemann T, Michael N, Oehme P, Steglich H‐D, Conradi E, Grune T, Siems W. Reduction of plasma catecholamines in humans during clinically controlled severe underfeeding. Prev Med. 2000;30:95–102. [DOI] [PubMed] [Google Scholar]
- 38. Mager DE, Wan R, Brown M, Cheng A, Wareski P, Abernethy DR, Mattson MP. Caloric restriction and intermittent fasting alter spectral measures of heart rate and blood pressure variability in rats. FASEB J. 2006;20:631–637. [DOI] [PubMed] [Google Scholar]
- 39. Wan R, Weigand LA, Bateman R, Griffioen K, Mendelowitz D, Mattson MP. Evidence that BDNF regulates heart rate by a mechanism involving increased brainstem parasympathetic neuron excitability. J Neurochem. 2014;129:573–580. [DOI] [PMC free article] [PubMed] [Google Scholar]
- 40. Young JB, Landsberg L. Suppression of sympathetic nervous system during fasting. Obes Res. 1997;5:646–649. [DOI] [PubMed] [Google Scholar]
- 41. Ferrannini E, Natali A, Capaldo B, Lehtovirta M, Jacob S, Yki‐Järvinen H; for the European Group for the Study of Insulin Resistance (EGIR) . Insulin resistance, hyperinsulinemia, and blood pressure: role of age and obesity. Hypertension. 1997;30:1144–1149. [DOI] [PubMed] [Google Scholar]
- 42. Steinberg HO, Brechtel G, Johnson A, Fineberg N, Baron AD. Insulin‐mediated skeletal muscle vasodilation is nitric oxide dependent: a novel action of insulin to increase nitric oxide release. J Clin Invest. 1994;94:1172–1179. [DOI] [PMC free article] [PubMed] [Google Scholar]
- 43. Mattson MP, Longo VD, Harvie M. Impact of intermittent fasting on health and disease processes. Ageing Res Rev. 2017;39:46–58. [DOI] [PMC free article] [PubMed] [Google Scholar]
- 44. Mesnage R, Grundler F, Schwiertz A, Le Maho Y, Wilhelmi de Toledo F. Changes in human gut microbiota composition are linked to the energy metabolic switch during 10 d of Buchinger fasting. J Nutr Sci. 2019;8:e36. [DOI] [PMC free article] [PubMed] [Google Scholar]
- 45. Engeli S, Böhnke J, Gorzelniak K, Janke J, Schling P, Bader M, Luft FC, Sharma AM. Weight loss and the renin‐angiotensin‐aldosterone system. Hypertension. 2005;45:356–362. [DOI] [PubMed] [Google Scholar]
- 46. Harp JB, Henry SA, DiGirolamo M. Dietary weight loss decreases serum angiotensin‐converting enzyme activity in obese adults. Obes Res. 2002;10:985–990. [DOI] [PubMed] [Google Scholar]
- 47. Ohashi K, Ouchi N, Matsuzawa Y. Adiponectin and hypertension. Am J Hypertens. 2011;24:263–269. [DOI] [PubMed] [Google Scholar]
- 48. Dorresteijn J, Visseren F, Spiering W. Mechanisms linking obesity to hypertension. Obes Rev. 2012;13:17–26. [DOI] [PubMed] [Google Scholar]
- 49. Wan R, Ahmet I, Brown M, Cheng A, Kamimura N, Talan M, Mattson MP. Cardioprotective effect of intermittent fasting is associated with an elevation of adiponectin levels in rats. J Nutr Biochem. 2010;21:413–417. [DOI] [PMC free article] [PubMed] [Google Scholar]
- 50. Varady KA, Allister CA, Roohk DJ, Hellerstein MK. Improvements in body fat distribution and circulating adiponectin by alternate‐day fasting versus calorie restriction. J Nutr Biochem. 2010;21:188–195. [DOI] [PubMed] [Google Scholar]
- 51. Hoddy KK, Bhutani S, Phillips SA, Varady KA. Effects of different degrees of insulin resistance on endothelial function in obese adults undergoing alternate day fasting. Nutr Healthy Aging. 2016;4:63–71. [DOI] [PMC free article] [PubMed] [Google Scholar]
- 52. Beltowski J. Role of leptin in blood pressure regulation and arterial hypertension. J Hypertens. 2006;24:789–801. [DOI] [PubMed] [Google Scholar]
- 53. da Silva AA, do Carmo JM, Li X, Wang Z, Mouton AJ, Hall JE. Role of hyperinsulinemia and insulin resistance in hypertension: metabolic syndrome revisited. Can J Cardiol. 2020;36:671–682. [DOI] [PMC free article] [PubMed] [Google Scholar]
- 54. Hall JE, do Carmo JM, da Silva AA, Wang Z, Hall ME. Obesity, kidney dysfunction and hypertension: mechanistic links. Nat Rev Nephrol. 2019;15:367–385. [DOI] [PMC free article] [PubMed] [Google Scholar]
- 55. Michalsen A, Kuhlmann MK, Lüdtke R, Bäcker M, Langhorst J, Dobos GJ. Prolonged fasting in patients with chronic pain syndromes leads to late mood‐enhancement not related to weight loss and fasting‐induced leptin depletion. Nutr Neurosci. 2006;9:195–200. [DOI] [PubMed] [Google Scholar]
- 56. Faselis C, Doumas M, Papademetriou V. Common secondary causes of resistant hypertension and rational for treatment. Int J Hypertens. 2011;2011:236239. [DOI] [PMC free article] [PubMed] [Google Scholar]
- 57. Cohen JS. Adverse drug effects, compliance, and initial doses of antihypertensive drugs recommended by the Joint National Committee vs the Physicians' Desk Reference. Arch Intern Med. 2001;161:880–885. [DOI] [PubMed] [Google Scholar]
Associated Data
This section collects any data citations, data availability statements, or supplementary materials included in this article.
Supplementary Materials
Tables S1–S7
Figures S1–S3
Data S1