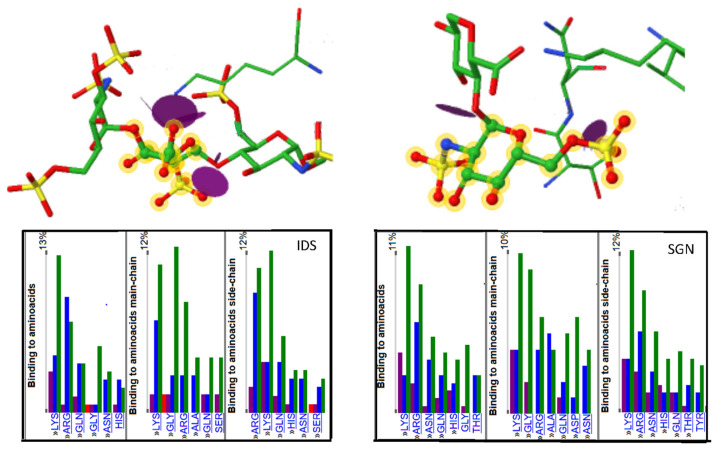
Figure 4.
Example of graphical representation of GAG binding site obtained from the PDBe ligand interface. Distribution of the amino acids involved in the binding to GAGs oligosaccharides in cocrystallized complexes. Illustration of two cases showing the hydrogen bonding and electrostatic interaction involved in the interaction. https://www.ebi.ac.uk/pdbe-site/pdbemotif/?tab=ligandbindingstats&ligandCode3letter1=IDS; https://www.ebi.ac.uk/pdbe-site/pdbemotif/?tab=ligandbindingstats&ligandCode3letter1=SGN.

