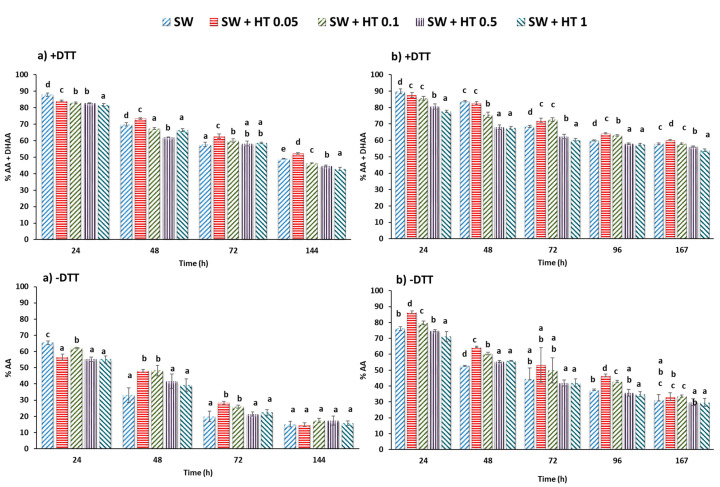
Figure 2.
Evolution of vitamin C in strawberry (SW) puree of the Calinda varieties with different concentrations of HT added (0.05, 0.1, 0.5 and 1 mg/g strawberry) (a) and in the Inspire variety (b) with DTT (+DTT = total ascorbic [AA + ADHA]) and without DTT (−DTT only acid ascorbic, AA) during storage at 4 °C. Influence of HT added to different concentrations. The data are shown as mean ± SD of quadruplicates. Letters (a–d), indicate different differences between groups with p < 0.05.

