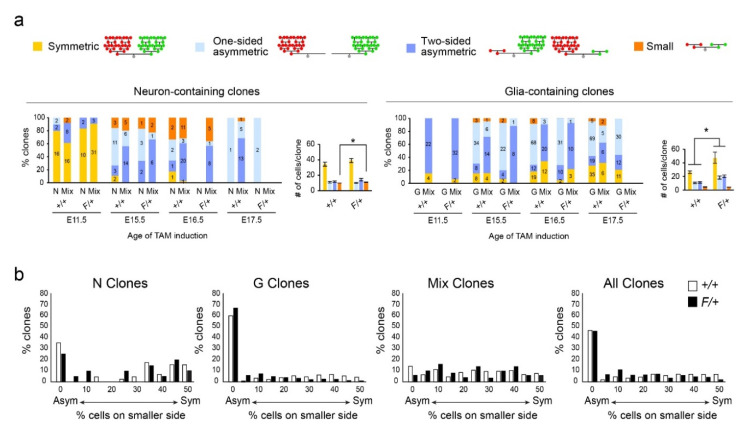
Figure 4.
Analysis of clonal MADM data in Neuron-containing and Glia-containing clones in the dorsolateral cortices. (a) Analysis of symmetry in clones at different time points and genotypes. Data are percentages of clones that form the different categories of clones as indicated. Numbers in the bars indicate the numbers of clones that fall into each category. Charts present numbers of cells per clone for each category of neuron-containing and glia-containing clones for all time points combined. Data are mean ± sem. *, rank-sum test, p < 0.05. (b) Percentages of clones across a gradient of asymmetry depicted on the x-axes (0 = one-sided asymmetric; 50 = symmetric) in +/+ and F/+ cortices. Data are shown separately for each clone type and for all clones combined. The majority of G clones are one-sided asymmetric in both genotypes (green and red MADM cells are combined).

