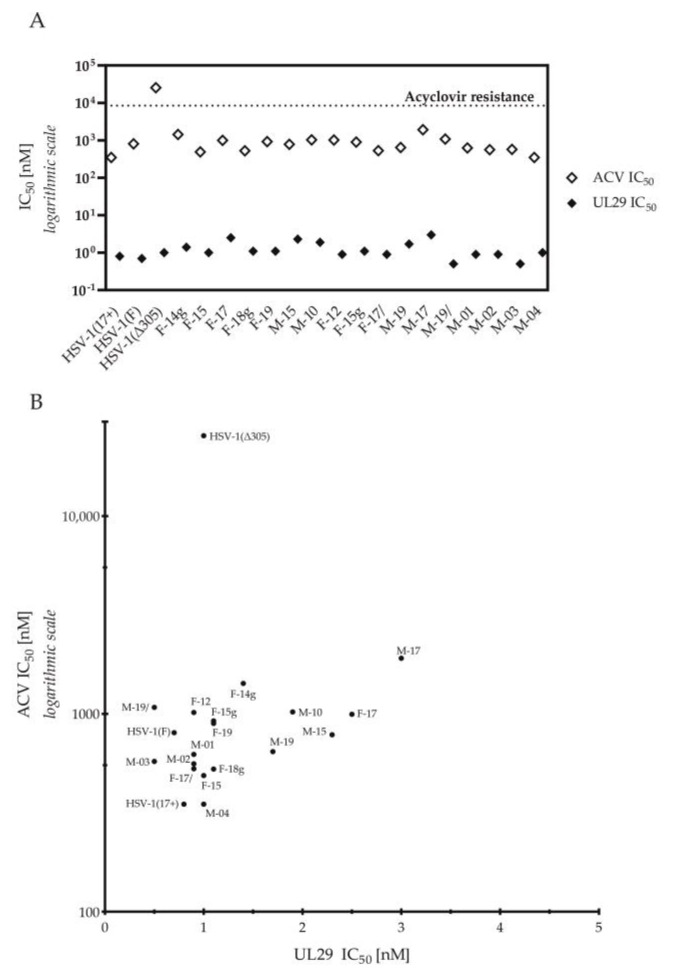
Figure 3.
Comparison of the antiviral susceptibility of the strains. (A) Acyclovir (ACV) and UL29 RNAi sensitivities (IC50) of HSV-1 strains. The dotted line shows the limit of ACV resistance (1.9 µg/mL, 8.43 µM). (B) A scatter plot analysis for correlation of ACV and UL29 sensitivities. The sensitivity (IC50) of the HSV-1 strains for ACV is shown on the y-axis and for UL29 siRNA swarm shown on the x-axis. The values are shown as nM. ACV sensitivity is plotted in logarithmic scale. There was no significant correlation between the ACV sensitivities and UL29 siRNA swarm sensitivities of the circulating strains (p = 0.49) (Spearman’s r = 0.19).

