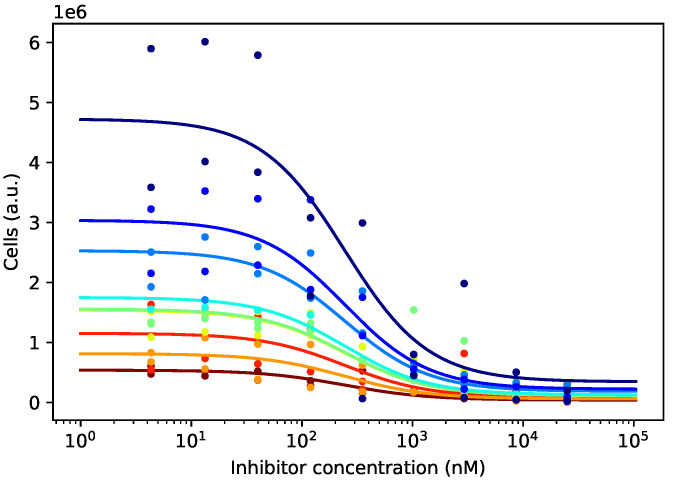
Figure 3.
Different cell lines have different growth patterns, and after 72 h of incubation, their numbers differ significantly at every drug concentration. Curves differing only in the amplitude parameter and sharing the remaining three parameters, , , and , were fitted to the empirical data. The different amplitudes were later used for normalizing the curves.

