

Abstract
Bone degradation of the condylar surface is seen in temporomandibular joint osteoarthritis (TMJ OA); however, the initial changes occur in the subchondral bone. This cross-sectional study was performed to evaluate 23 subchondral bone imaging biomarkers for TMJ OA. The sample consisted of high-resolution cone beam computed tomography scans of 84 subjects, divided into two groups: TMJ OA (45 patients with TMJ OA) and control (39 asymptomatic subjects). Six regions of each mandibular condyle scan were extracted for computation of five bone morphometric and 18 grey-level texture-based variables. The groups were compared using the Mann-Whitney U-test, and the receiver operating characteristics (ROC) curve was determined for each variable that showed a statically significance difference. The results showed statistically significant differences in the subchondral bone microstructure in the lateral and central condylar regions between the control and TMJ OA groups (P < 0.05). The area under the ROC curve (AUC) for these variables was between 0.620 and 0.710. In conclusion, 13 imaging bone biomarkers presented an acceptable diagnostic performance for the diagnosis of TMJ OA, indicating that the texture and geometry of the subchondral bone microarchitecture may be useful for quantitative grading of the disease.
Keywords: cone beam computed tomography, osteoarthritis, temporomandibular joint, biomarkers
Introduction
Osteoarthritis (OA) is the most common joint disease, affecting approximately 10% of women and 18% of men over 60 years of age around the world1. OA is a degenerative musculoskeletal disease and its natural cycle occurs mainly in three inflammatory stages: enzymatic, cartilaginous, and bony changes. In temporomandibular joint (TMJ) OA, the signs and symptoms include pain, a continuous inflammatory process with articular cartilage degradation, cortical and trabecular bone resorption, sclerotic bone formation, and synovial proliferation. Clinically, TMJ OA patients often present deficiencies in TMJ functions and facial asymmetry2,3.
The clinical assessment is a non-invasive method indicated prior to imaging examinations to diagnose TMJ conditions, as part of the standardized diagnostic criteria for temporomandibular disorders (TMD)4. However, signs and symptoms may manifest only at more advanced stages of the disease, when bone, cartilage, and articular disc alterations have irreversibly progressed. Complementary diagnostic examinations such as radiography and magnetic resonance imaging (MRI)5–7 continue to be used extensively, while advanced quantitative texture analysis of imaging data is becoming more popular8. Machine learning methods have recently been applied to automatically segment joint structures and automate quantitative imaging grading9,10. In light of these technological advances, image analysis workflows are needed for predictive models harnessing the available multi-modality, multiparametric, and demographic data .
As a progressive degenerative joint disorder, OA has long been viewed as a primary disorder of articular cartilage. However, the microarchitecture of the subchondral bone has recently been reported to play a vital role in the pathogenesis of OA, as evidenced by initial changes in the subchondral bone organization11. Such diagnosis has been compromised by the absence of quantitative methodologies to analyze and extract bone texture information6,12. The relatively new high-resolution low radiation cone beam computed tomography (hr-CBCT) has facilitated the analysis of the bone morphometry microstructure and textural features, which was previously only possible using micro-computed tomography2,8,13–18. The selection of the most informative textural and morphometric subchondral bone features has the potential to change clinical practice from qualitative analysis to a more dynamic and phenotypical characterization of suspected lesions, using integrated textural biomarkers that combine subsets of collected patient data19,20. New software applications, with a user-friendly interface, can now easily extract large amounts of quantitative features from hr-CBCT greyscale images21–24. Towards these promising methodologies, a paradigm shift in diagnosis is necessary, from the traditional radiological assessments to integrative statistical models. Thus, diseases that have a silent onset, such as TMJ OA, may potentially be detected using non-invasive examinations12,25–27.
In view of the above, this study was performed to evaluate the diagnostic performance of quantitative bone texture and morphometry imaging biomarkers extracted from hr-CBCT scans for the diagnosis of TMJ OA. The main objective was to investigate the ability of these biomarkers to differentiate control and TMJ OA patients. It was hypothesized that there would be significant differences between control subjects and TMJ OA patients in the microstructure of the condylar subchondral bone. The null hypothesis was that there would be no differences in the tested imaging biomarkers between the control and TMJ OA groups.
Materials and methods
This study followed the STROBE guidelines for observational studies28.
Study design and participants
This cross-sectional study was conducted at the University of Michigan, Ann Arbor, Michigan, USA from January 2016 to December 2018. The study was approved by the Institutional Review Board of the University of Michigan (HUM00105204 and HUM00113199). All patients signed an informed consent and agreed to participate. The following inclusion criteria were applied for all patients: age between 21 and 70 years, no history of systemic disease, no history of TMJ trauma, surgery, or recent TMJ injections, no current pregnancy, and no congenital bone or cartilage disease. The control subjects were recruited by advertisements placed in the University of Michigan School of Dentistry and at The University of Michigan Dentistry Hospital; potential participants were first screened by telephone interview . The TMJ OA patients were recruited during personal interviews with a single temporomandibular disorders (TMD) specialist from the University of Michigan, at the first appointment. A total of 84 patients were selected, for a total 168 hr-CBCT scans of the mandibular condyles. One condyle per patient was then selected, as explained below .
All subjects were clinically evaluated by the same TMD specialist according to their clinical symptoms using the Diagnostic Criteria for Temporomandibular Disorders (DC/TMD)29. They were then divided into two groups: a control group (n = 39 patients, 39 condyles) and a TMJ OA group (n = 45 patients, 45 condyles). The reason for choosing one condyle was to reduce possible bias due to technical problems in the hr-CBCT image acquisition, imaging artifacts, presence of large alterations in the condylar surface, poor image quality, and presence of unilateral TMJ OA.
The inclusion criteria for control subjects were no history of clinical signs/symptoms of TMD, as evaluated using the DC/TMD, and the absence of radiographic TMJ OA findings in the CBCT evaluation29. The inclusion criteria for the TMJ OA group were the presence of TMJ pain for less than 10 years, with clinical signs and symptoms evaluated using the DC/TMD: TMJ noise during movement or function in the last 30 days and crepitus detected during mandible excursive movements. The radiographic CBCT assessment was conducted by a radiologist to confirm the presence of TMJ OA and was positive for at least one of the following: subchondral cyst, erosion, generalized sclerosis, and/or osteophytes29. The exclusion criteria for the TMJ OA group were subjects with more than 10 years since the diagnosis of TMJ OA, or condyles with chronic or severe stages of bone destruction, subchondral cyst, erosion, generalized sclerosis, and/or osteophytes.
Regarding demographic characteristics, the samples presented a similar age range, being a mean 36 ± 11.4 years for control subjects and 40.2 ± 13.1 years for TMJ OA patients (mean ± standard deviation). Both groups showed a higher number of female subjects than male subjects, corroborating the sex distribution reported in the literature30–32 .
Imaging acquisition
All hr-CBCT scans were acquired using a 3D Accuitomo scanner (J. Morita Mfg. Corp., Tokyo, Japan). The TMJ acquisition protocol was as follows: field of view (FOV) of 40 × 40 mm, 90 kVp, 5 mAs, scanning time of 30.8 s, and a voxel size of 0.08 mm3. All scans were performed at the University of Michigan, School of Dentistry . The images were exported in DICOM format (.dcm files) using i-Dixel software (J. Morita Mfg. Corp., Tokyo, Japan). The images were de-identified and coded to avoid investigator bias. The limitation of the exposure to the smallest FOV possible is in accordance with the ALARA (as low as reasonably achievable) principle15, and this radiation reduction to the patient, maintaining or even improving the level of precision and accuracy in the diagnosis, supports the concept ‘as low as diagnostically acceptable’ (ALADA)33.
Image pre-processing
In order to standardize the grey-level hr-CBCT images, a novel detailed pre-processing protocol was used, as shown in Fig. 1. Two imaging software were used: 3D Slicer34 (https://www.slicer.org) and ITK-SNAP35. The common orientation of each three-dimensional (3D) condyle mesh allowed a standardized selection of the volumes of interest (VOIs). As each patient had a hr-CBCT scan taken in a different spatial position, the mandibular condyles were approximated in a common coordinate system for all subjects (Fig. 2).
Fig. 1.
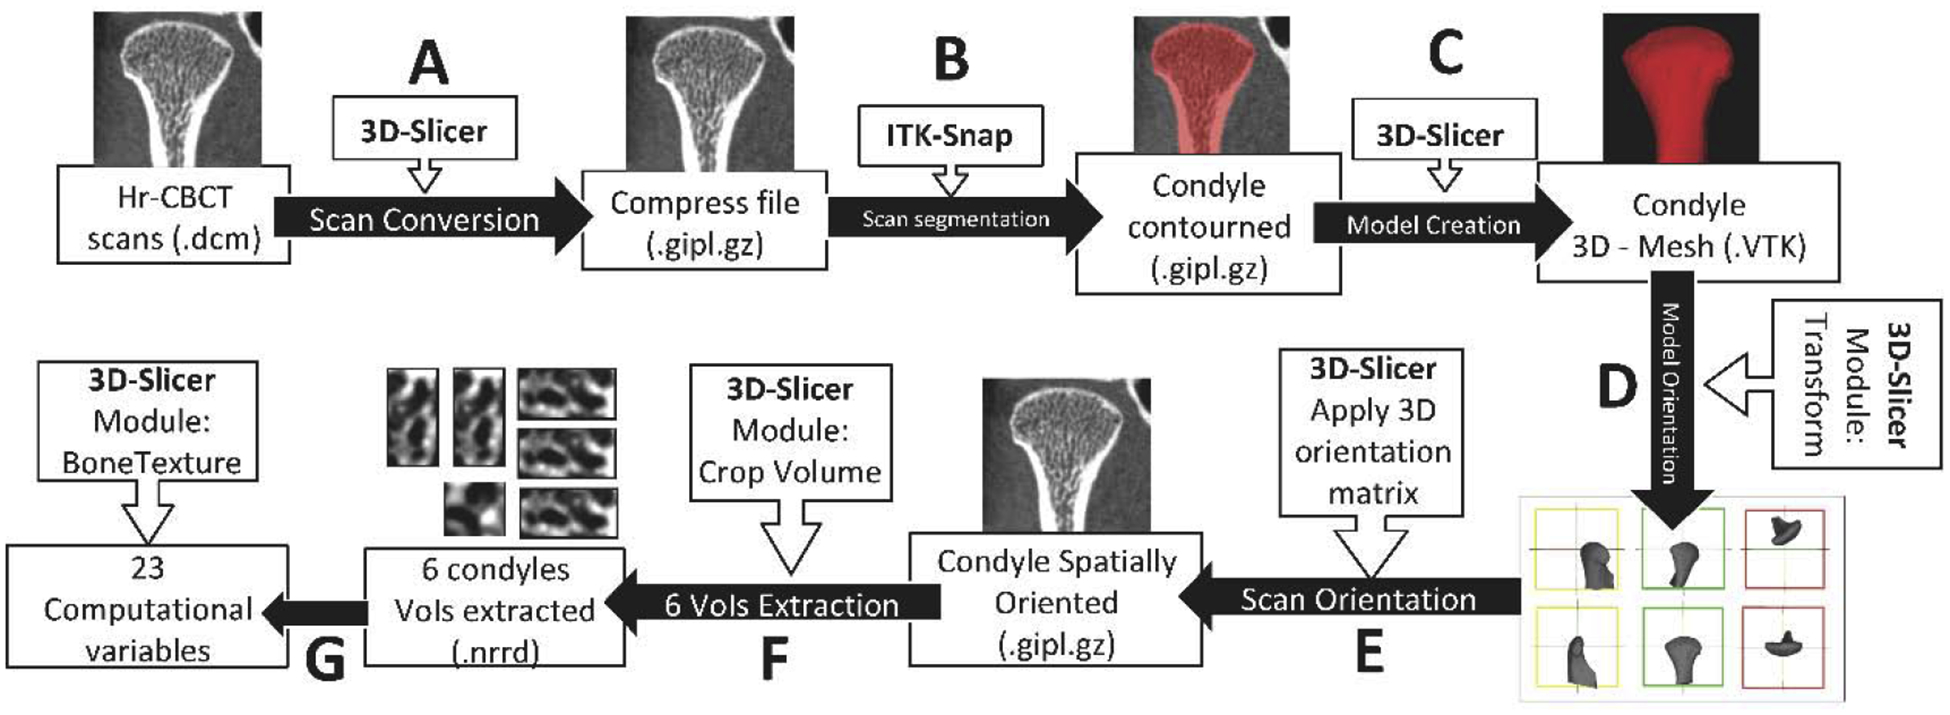
Computational processing workflow. First, all the left hr-CBCT scans were mirrored to the right side using the ‘transforms’ tool in 3D Slicer software. The subsequent steps were as follows: (A) 3D Slicer software was used to convert the original hr-CBCT files to a compressed format. (B) ITK-Snap software was used to segment the entire condyle. (C) 3D Slicer was used to convert the segmented condyle volume to a 3D surface. (D) Using the ‘transform’ module in 3D Slicer, a spatial orientation for each 3D condyle model was made. (E) The spatial orientation matrix created in the last step was applied to the condyle scan. Each condyle had its proper orientation according to its orientation matrix. (F) Using the ‘crop-volume’ tool, six different regions of the condyle (anterior, posterior, lateral, medial, superior, and central) were selected. (G) Using the ‘BoneTexture’ module in 3D Slicer, all of the variables studied for each region of the condyle were computed.
Fig. 2.
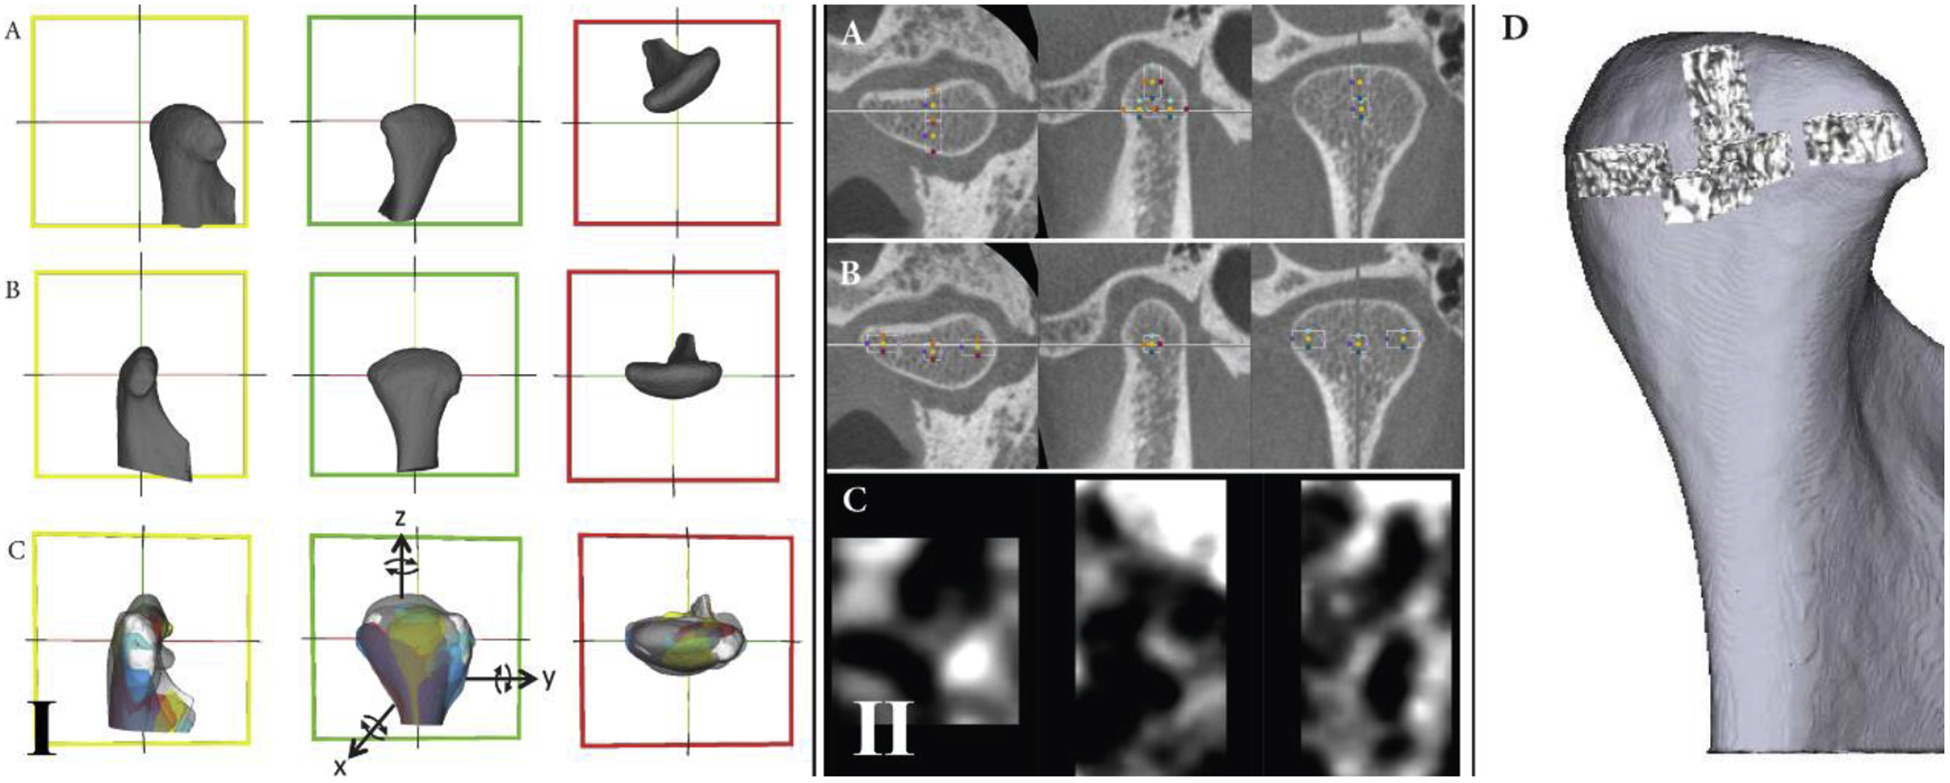
Mandibular condyle orientation. (I) The ‘transforms’ tool of the 3D Slicer software was used to standardize the spatial orientation of the 3D condyles: (A) the condyle before orientation; (B) the condyle after orientation; (C) example of eight condyles oriented. Reference lines (red, green, and yellow) were used in the same spatial position for all condyles to allow a common spatial position for all condyles. In the lateral view, the yellow line was parallel to the condylar neck. In the posterior view, the red line connects the lateral and medial poles. In the superior view, the green line also connects the lateral and medial poles. (II) Volume of interest (VOI) extractions. After spatial orientation, the ‘crop-volume’ module in 3D Slicer was used to generate the VOIs: (A) selection of the anterior, posterior, and superior VOIs; (B) selection of the lateral, medial, and central VOIs; (C) example of the anterior region containing the greyscale information of that VOI; (D) 3D rendering to illustrate each VOI and the condylar region where it belongs. The criteria for the boundaries were as follows: for the lateral, medial, posterior, superior, and anterior VOIs, the rectangular prism starts in the most external condylar bone and extends in the direction of the trabecular condyle center; for the central VOI, the cube is positioned in the central region of the trabecular bone.
Volumes of interest (VOI)
Six different VOI regions were selected and extracted using the ‘crop-volume’ module of 3D Slicer software (Fig. 1F). The VOIs were lateral, medial, posterior, anterior, superior, and central (Fig. 2). For the lateral, medial, anterior, superior, and posterior regions, the VOI had a rectangular prism shape and each was cropped with 25 × 25 × 50 slices; the central region had a cube shape with 25 × 25 × 25 slices.
Bone imaging biomarkers
A total of 23 surrogate imaging biomarkers were evaluated36–40, as described in the Supplementary Material (Table S1). The five bone morphometry features included trabecular thickness (Tb.Th), trabecular separation (Tb.Sp), trabecular number (Tb.N), bone volume per total volume (BV/TV), and bone surface per bone volume (BS/BV). The 18 quantitative bone texture features included two main groups of variables: (1) grey-level co-occurrence matrix (GLCM)37 and (2) grey-level run length matrix (GLRLM)38,39. The GLCM variables quantified the distribution of co-occurring pixel values and included energy, entropy, autocorrelation, inverse difference moment (IDM), inertia, cluster shade, cluster prominence, and Haralick correlation (HC). The GLRLM variables quantified the size of homogeneous runs for each grey level and included short run emphasis (SRE), long run emphasis (LRE), grey-level non uniformity (GLNU), run length non uniformity (RLNU), low grey-level run emphasis (LGLRE), high grey-level run emphasis (HGLRE), short run low grey-level emphasis (SRLGLE), short run high grey-level emphasis (SRHGLE), long run low grey-level emphasis (LRLGLE), and long run high grey-level emphasis (LRHGLE).
Computational parameters for bone imaging biomarker computation
The BoneTexture module of 3D Slicer software (https://www.slicer.org) was used to compute the bone imaging biomarkers and obtain the subchondral bone microstructure values34,40. The software computation parameters were chosen based on the user manual and our pilot calibration studies. The following computational software parameters were selected in the BoneTexture module: (1) for GLCM: mask ‘inside’ value = 1; number of bins = 10; voxel intensity range min = −1000, max = 2500; neighborhood radius = 4; (2) for GLRLM: mask ‘inside’ value = 1; number of bins = 10; voxel intensity range min = −1000, max = 2500; distance range min = 0, max = 1; neighborhood radius = 4. For bone morphometry (BM), the software parameters were threshold = 250 and neighborhood radius = 4.
Statistical analysis
The statistical analysis was performed using IBM SPSS Statistics version 25.0 (IBM Corp., Armonk, NY, USA). The intra-class correlation coefficient (ICC) was assessed with an interval of 2 weeks to evaluate the study repeatability. The Mann-Whitney U-test for independent samples was used to compare the two groups, and the bone imaging biomarker rank values were computed due to the non-normal data distribution after analysis of kurtosis and symmetry. Receiver operating characteristics curves (ROC) were computed to determine the diagnostic performance of the biomarkers to diagnose TMJ OA41. The correlations among the imaging variables and the correlations between patient age and the imaging variables was evaluated by Spearman correlation
Results
Participants, descriptive data, and method error
The sex distribution in the control group was six male and 33 female (n = 39); in the TMJ OA group, it was seven male and 38 female (n = 45 patients). The ICC values are reported in the Supplementary Material (Table S2) and exhibited moderate to high repeatability for all variables (≥0.7), except for cluster shade (ICC = 0.1), cluster prominence (ICC = 0.1), and autocorrelation (ICC = 0.6). Due to the poor repeatability, these three variables were excluded from the next computational and statistical analysis. The correlations among the biomarkers and between the biomarkers and patient age (Spearman’s correlation) are presented in the Supplementary Material (Table S3) . Correlations were found between most of the variables, and age was correlated with the TMJ OA and control groups for imaging variables . These results suggest that the aging process might occur together with the disease changes in the trabecular bone organization.
Statistical tests of TMJ OA diagnosis
Table 1 shows the Mann–Whitney U-test analysis and the ranked values for each variable. Statistically significant bone changes in texture features were detected in the lateral and central VOI regions of TMJ OA patients compared to control subjects (P < 0.05). The lateral VOI region of the TMJ OA patients showed significantly decreased values of energy, IDM, and LRE, and significantly increased values of entropy, inertia, HC, SRE, RLNU, HGLRE, and SRHGLE. The central VOI region of TMJ OA patients showed significantly decreased values of LGRLE and significantly increased values of HGLRE and SRHGLE. Fig. 3 summarizes the results obtained using the Mann–Whitney U-test. Descriptive statistics for each variable that showed statistical significance in differentiating the groups are reported in the Supplementary Material (Table S4).
Table 1.
Differences between the control group and the TMJ OA group: Mann-Whitney U-test analysis for two independent samples.
| Variables | Lateral | Central | Medial | ||||||
|---|---|---|---|---|---|---|---|---|---|
| Mean rank | Mean rank | Mean rank | |||||||
| Control | OA | P-value | Control | OA | P-value | Control | OA | P-value | |
| Number | 39 | 45 | 39 | 45 | 39 | 45 | |||
| Energy | 51.5 | 34.6 | 0.002* | 44.0 | 41.1 | 0.581 | 45.2 | 40.1 | 0.344 |
| Entropy | 32.9 | 50.7 | 0.001* | 40.9 | 43.8 | 0.575 | 38.8 | 45.6 | 0.201 |
| InverseDifferenceMoment | 49.7 | 36.2 | 0.012* | 43.6 | 41.4 | 0.677 | 43.5 | 41.6 | 0.723 |
| Inertia | 35.3 | 48.6 | 0.012* | 42.2 | 43.5 | 0.664 | 41.3 | 43.4 | 0.690 |
| HaralickCorrelation | 34.0 | 49.8 | 0.003* | 38.0 | 46.4 | 0.115 | 39.9 | 44.7 | 0.363 |
| ShortRunEmphasis | 35.7 | 48.3 | 0.018* | 39.4 | 45.1 | 0.284 | 42.3 | 42.6 | 0.954 |
| LongRunEmphasis | 49.2 | 36.6 | 0.018* | 44.6 | 40.6 | 0.457 | 42.5 | 42.4 | 0.982 |
| GreyLevelNonUniformity | 46.7 | 38.8 | 0.140 | 44.1 | 41.1 | 0.575 | 45.7 | 39.6 | 0.249 |
| RunLengthNonUniformity | 35.0 | 48.9 | 0.009* | 40.5 | 44.1 | 0.504 | 41.7 | 43.1 | 0.805 |
| LowGreyLevelRunEmp. | 46.6 | 38.8 | 0.143 | 48.3 | 37.4 | 0.040* | 43.5 | 41.6 | 0.716 |
| HighGreyLevelRunEmp. | 36.1 | 47.9 | 0.027* | 36.8 | 47.3 | 0.049* | 41.0 | 43.7 | 0.612 |
| ShortRunLowGreyLevelEmp. | 45.6 | 39.7 | 0.272 | 47.0 | 38.5 | 0.111 | 43.2 | 41.8 | 0.805 |
| ShortRunHighGreyLevelEmp. | 35.2 | 48.7 | 0.011* | 36.6 | 47.6 | 0.040* | 40.8 | 43.9 | 0.569 |
| LongRunLowGreyLevelEmp. | 47.6 | 38.0 | 0.072 | 47.7 | 37.9 | 0.067 | 42.9 | 42.1 | 0.882 |
| LongRunHighGreyLevelEmp. | 34.4 | 45.1 | 0.280 | 38.2 | 46.2 | 0.135 | 40.6 | 44.0 | 0.521 |
| BV/TV | 40.1 | 44.5 | 0.417 | 37.5 | 46.7 | 0.086 | 42.4 | 42.5 | 0.982 |
| Tb.Th | 37.5 | 46.8 | 0.081 | 37.6 | 46.7 | 0.089 | 41.2 | 43.5 | 0.664 |
| Tb.Sp | 43.3 | 41.7 | 0.711 | 47.3 | 38.2 | 0.088 | 42.1 | 42.8 | 0.904 |
| Tb.N | 46.0 | 39.4 | 0.221 | 42.1 | 42.8 | 0.900 | 43.8 | 41.3 | 0.638 |
| BS/BV | 47.4 | 38.1 | 0.081 | 47.3 | 38.2 | 0.089 | 43.7 | 41.4 | 0.664 |
| Posterior | Anterior | Superior | |||||||
| Mean rank | Mean rank | Mean rank | |||||||
| Control | OA | P-value | Control | OA | P-value | Control | OA | P-value | |
| Energy | 43.3 | 41.7 | 0.771 | 43.0 | 42.0 | 0.840 | 40.5 | 44.1 | 0.504 |
| Entropy | 41.5 | 43.3 | 0.730 | 42.9 | 42.0 | 0.868 | 44.0 | 41.2 | 0.600 |
| InverseDifferenceMoment | 45.3 | 40.0 | 0.322 | 43.2 | 41.8 | 0.798 | 44.6 | 40.6 | 0.454 |
| Inertia | 39.6 | 44.9 | 0.326 | 41.9 | 43.0 | 0.840 | 40.4 | 44.3 | 0.465 |
| HaralickCorrelation | 40.2 | 44.4 | 0.433 | 42.4 | 42.5 | 0.996 | 44.4 | 40.7 | 0.487 |
| ShortRunEmphasis | 37.2 | 47.0 | 0.065 | 41.2 | 43.5 | 0.664 | 36.6 | 47.5 | 0.042 |
| LongRunEmphasis | 46.8 | 38.7 | 0.131 | 44.4 | 40.8 | 0.504 | 47.2 | 38.3 | 0.094 |
| GreyLevelNonUniformity | 41.6 | 43.2 | 0.778 | 42.4 | 42.5 | 0.996 | 42.0 | 42.8 | 0.882 |
| RunLengthNonUniformity | 38.7 | 45.7 | 0.186 | 41.6 | 43.2 | 0.778 | 39.5 | 45.0 | 0.296 |
| LowGreyLevelRunEmp. | 46.6 | 38.9 | 0.145 | 42.9 | 42.0 | 0.868 | 41.8 | 43.0 | 0.826 |
| HighGreyLevelRunEmp. | 38.8 | 45.6 | 0.204 | 42.4 | 42.5 | 0.996 | 43.4 | 41.6 | 0.730 |
| ShortRunLowGreyLevelEmp. | 45.3 | 40.0 | 0.317 | 42.7 | 42.2 | 0.918 | 41.3 | 43.4 | 0.690 |
| ShortRunHighGreyLevelEmp. | 37.5 | 46.7 | 0.084 | 42.7 | 42.2 | 0.925 | 40.9 | 43.8 | 0.587 |
| LongRunLowGreyLevelEmp. | 47.2 | 38.3 | 0.096 | 43.6 | 41.5 | 0.690 | 43.0 | 42.0 | 0.840 |
| LongRunHighGreyLevelEmp. | 40.2 | 44.4 | 0.422 | 43.1 | 41.9 | 0.833 | 45.4 | 39.9 | 0.300 |
| BV/TV | 39.1 | 45.3 | 0.245 | 42.2 | 42.7 | 0.932 | 44.0 | 41.1 | 0.587 |
| Tb.Th | 39.1 | 45.4 | 0.235 | 42.3 | 42.6 | 0.968 | 44.7 | 40.5 | 0.427 |
| Tb.Sp | 45.6 | 39.7 | 0.264 | 42.8 | 42.2 | 0.911 | 41.4 | 43.4 | 0.716 |
| Tb.N | 41.3 | 43.5 | 0.677 | 40.5 | 44.1 | 0.498 | 37.3 | 46.9 | 0.072 |
| BS/BV | 45.9 | 39.5 | 0.235 | 42.6 | 42.4 | 0.968 | 40.2 | 44.4 | 0.427 |
TMJ OA, temporomandibular joint osteoarthritis; BV/TV, bone volume per total volume; Tb.Th, trabecular thickness; Tb.Sp, trabecular separation; Tb.N, trabecular number; BS/BV, bone surface per bone volume. α = 0.05.
Indicates statistical significance with P < 0.05.
Fig. 3.
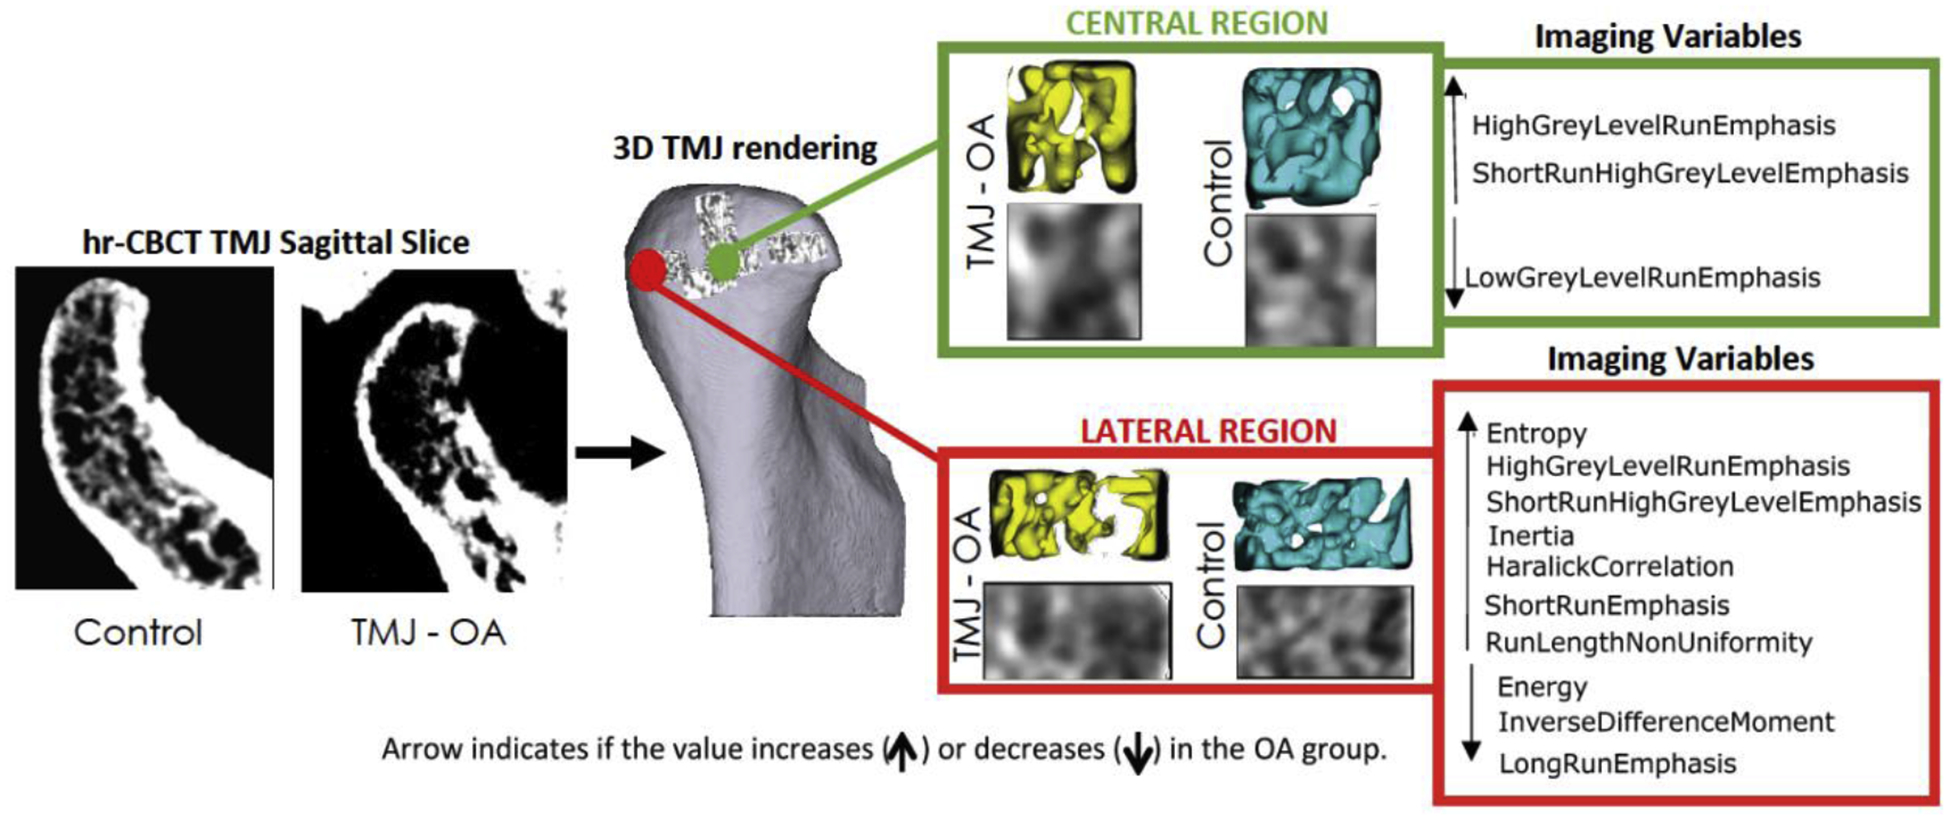
Summary illustration showing the biomarkers that were statistically significant (P < 0.05) in the Mann-Whitney analysis. Only the central and lateral regions showed significant differences between the osteoarthritis and control groups.
Fig. 4 shows the ROC curves for all of the variables that presented statistically significant differences between the TMJ OA and control groups. The lines indicate the diagnostic performance of the proposed biomarkers, showing a good prediction for energy and entropy (AUC >0.7). Table 2 shows the values of the AUC for each variable, which ranged from 0.62 to 0.71 (P < 0.05).
Fig. 4.
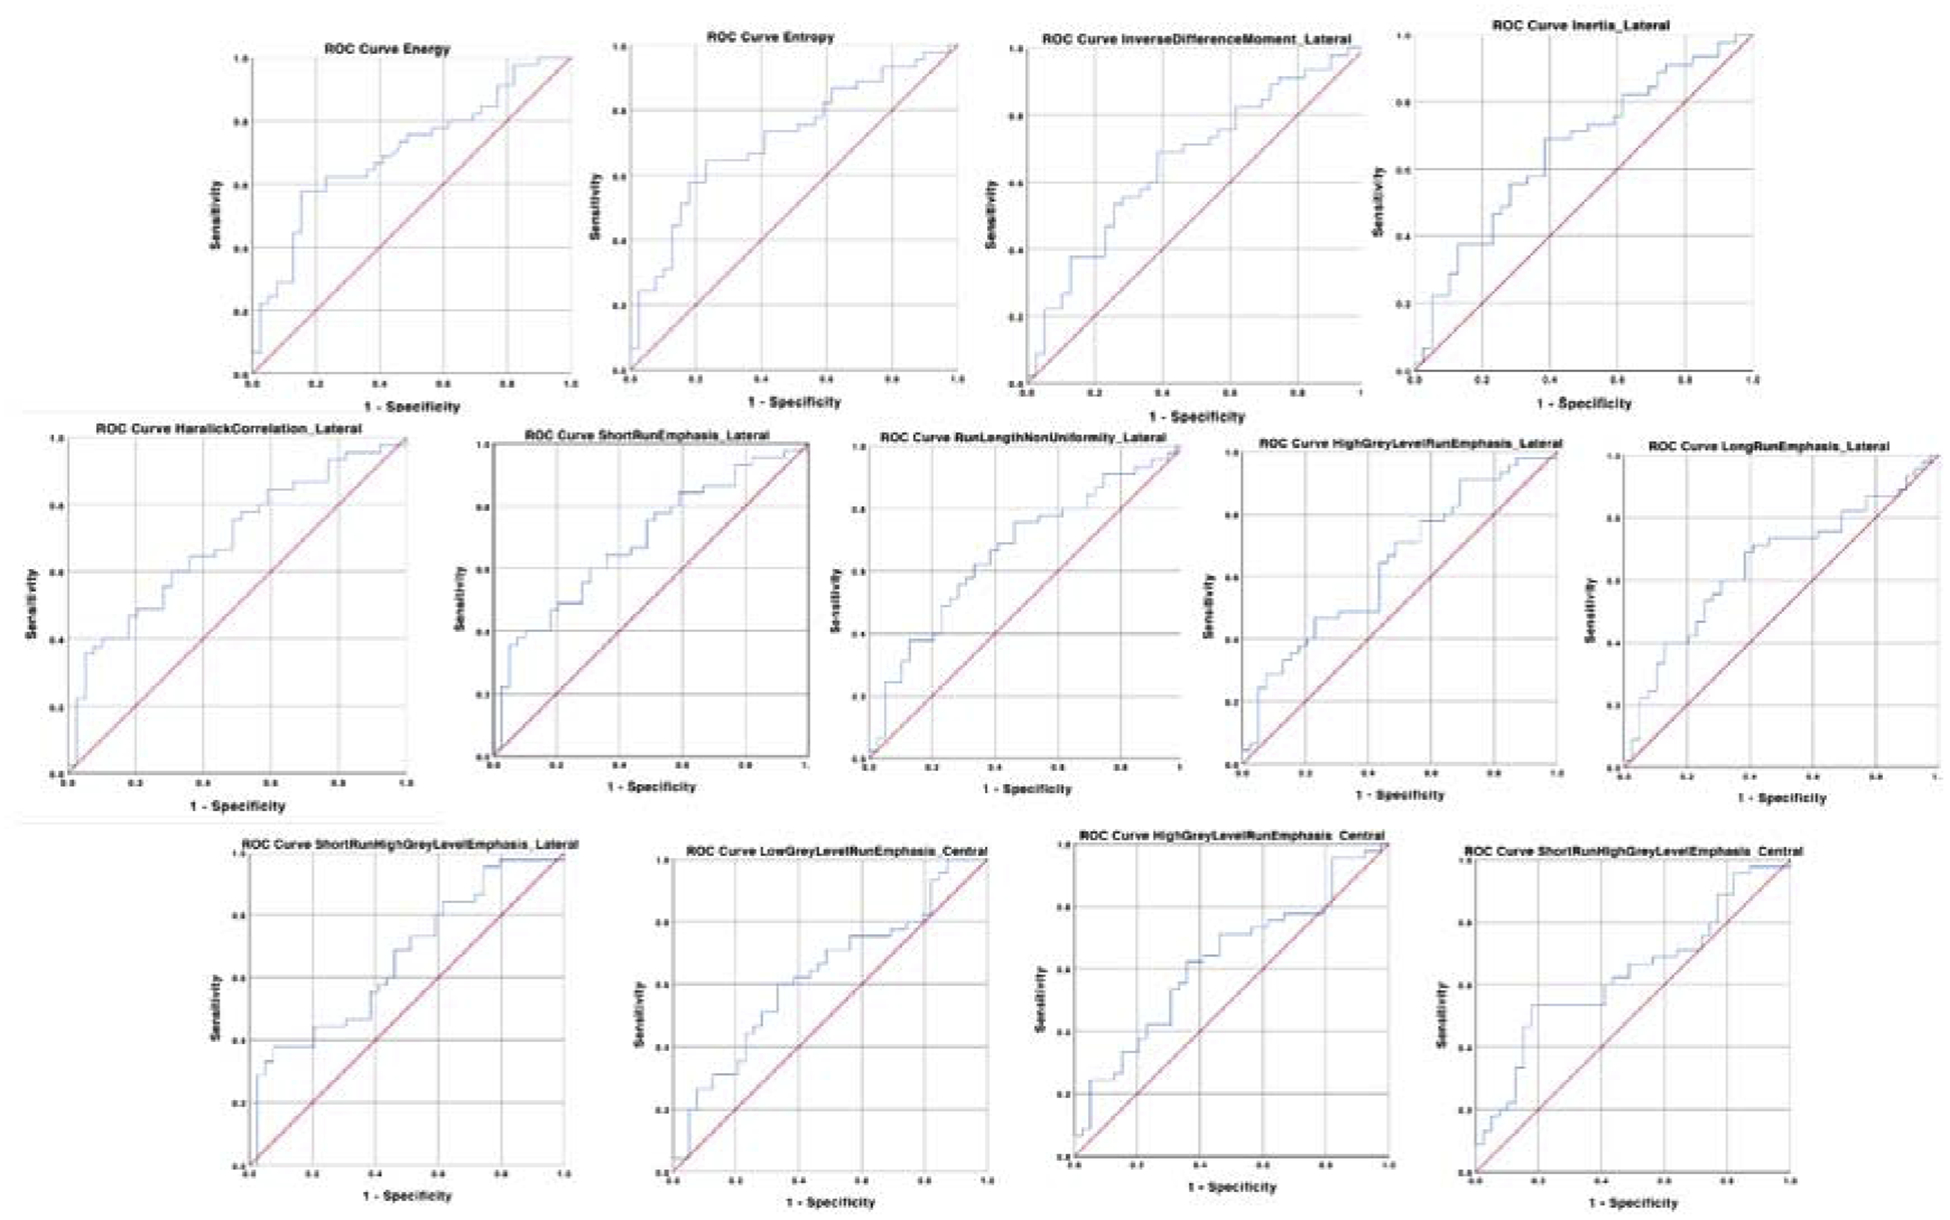
Receiver operating characteristics (ROC) curves for detecting osteoarthritis. Diagnostic performance of each variable.
Table 2.
Receiver operating characteristics (ROC) curves and their respective area under the curve (AUC) for predicting TMJ OA status.
| Variables | Area | SE | P-value | 95% CI | |
|---|---|---|---|---|---|
| Lower | Upper | ||||
| Energy_Laterala | 0.701 | 0.057 | 0.002 | 0.588 | 0.813 |
| Entropy_Lateral | 0.712 | 0.056 | 0.001 | 0.601 | 0.822 |
| InverseDifferenceMoment_Laterala | 0.660 | 0.060 | 0.012 | 0.544 | 0.777 |
| Inertia_Lateral | 0.659 | 0.060 | 0.012 | 0.542 | 0.776 |
| HaralickCorrelation_Lateral | 0.689 | 0.058 | 0.003 | 0.576 | 0.802 |
| ShortRunEmphasis_Lateral | 0.650 | 0.060 | 0.018 | 0.533 | 0.767 |
| RunLengthNonUniformity_Lateral | 0.666 | 0.059 | 0.009 | 0.549 | 0.782 |
| HighGreyLevelRunEmphasis_Lateral | 0.640 | 0.060 | 0.027 | 0.522 | 0.759 |
| LongRunEmphasis_Laterala | 0.650 | 0.060 | 0.018 | 0.532 | 0.769 |
| ShortRunHighGreyLevelEmphasis_Lateral | 0.661 | 0.059 | 0.011 | 0.545 | 0.777 |
| LowGreyLevelRunEmphasis_Centrala | 0.630 | 0.061 | 0.040 | 0.511 | 0.750 |
| HighGreyLevelRunEmphasis_Central | 0.625 | 0.061 | 0.049 | 0.505 | 0.745 |
| ShortRunHighGreyLevelEmphasis_Central | 0.631 | 0.061 | 0.040 | 0.511 | 0.075 |
SE, standard error; CI, confidence interval. Test under the non-parametric assumption and null hypothesis: true area = 0.5; asymptotic Sig. and 95% CI.
After subtracting 1 from the original value.
Discussion
This cross-sectional case-control study determined the diagnostic performance of novel imaging bone biomarkers in hr-CBCT scans of TMJ OA patients. Surrogate bone morphometry and textural features were tested and the study indicated 13 textural imaging biomarkers for the diagnosis of subchondral bone changes in TMJ OA patients. These results are based on six VOIs of 84 condyles (control + TMJ OA groups), resulting in 504 localized hr-CBCT images. The image processing and computation of those large volumetric images led to the novel and open-access methodology presented in this study to mine and extract useful clinical data.
Rapidly progressive OA may involve multiple joints, and severe stages might require joint replacement depending on the functional limitations42,43. TMJ OA is often successfully managed with conservative therapy that may include non-steroidal anti-inflammatory drugs, splints, physical therapy, low-energy laser therapy, and arthrocentesis44 . Both surgical and non-surgical management require careful follow-up with validated tools to monitor treatment outcomes. The greatest challenge in the treatment of OA is that the disease cannot be diagnosed until it becomes symptomatic, at which point structural alterations are already advanced40. Until recently, OA - frequently referred to as degenerative joint disease - was considered a localized condition that may affect only one joint, but recent studies have demonstrated that even though one joint may manifest symptoms before the other, OA is a multi-joint disease45. Furthermore, even with the addition of radiographic criteria to the DC/TMD - the standardized and widely used protocols for TMJ OA assessment - there is still a reliance on subjective radiological interpretation of pre-existing bone changes and clinical symptoms29 . Chronic stages of this degenerative disease cannot be treated conservatively, as its natural cycle causes an intermittent inflammation with large bone destruction, pathological remodeling, pain, and loss of function38. It is unlikely that a single marker would drive this complex, and disease-modifying therapy is still unknown. Our proposed imaging biomarkers extract quantitative information using mathematical algorithms (GLCM and GLRLM)32 to identify the difference in greyscale patterns between images of control subjects and OA patients6,17,19,39. The results exhibited a good diagnostic performance, especially for energy and entropy, with AUC of ≥0.70 (Table 2).
Previous studies have shown the role of subchondral bone tissue in the pathogenesis of OA, including sclerosis and hypomineralization due to abnormal bone remodeling43,48 . Histopathological findings have shown that the changes occur by microdamage, bone marrow edema-like lesions, and bone cysts in the subchondral region11. Fig. 3 summarizes the statistically significant increase in entropy and decreased energy in the present study, suggesting higher porosity in TMJ OA mandibular condyles36, which is in agreement with the histological findings described in the literature11,49.
The rationale for selecting VOIs in six different regions of the condyles in this study was based on previous results that indicated changes occurring in different surface regions, including increased bone formation in the anterior pole, bone resorption in the lateral pole and superior region pole, and overall bone surface remodeling46,50. The lateral surface of the condyles has also been highly correlated with specific inflammatory proteins, indicating that bone remodeling in this region may play an important role in the pathogenesis of TMJ OA51. Thus, a single quantitative value for the entire condyle cannot explain the different inflammatory responses leading to bone apposition and repair in the anterior and medial regions, while bone resorption occurs in other regions particularly the lateral condylar surface. Statistically significant differences were found in this study for 10 imaging biomarkers in the lateral region and three in the central region (Fig. 3). Bone resorption in the lateral VOI region of the condyles of TMJ OA patients may be explained by significantly decreased values of energy, IDM, and LRE36. Interestingly, significantly increased values of HGLRE and SRHGLE were also observed in the lateral and central condylar regions. Otherwise, the small central VOI region, deeper in the subchondral bone of the condylar head of TMJ OA patients and away from the articular surface, showed a significant decrease in one biomarker (LGLRE) that was not observed in the lateral region. The differences in subchondral bone findings between the lateral and central condylar regions in this study may possibly be related to greater vascularization/innervation and less articular loading in the central condylar region, giving passage to the reparatory response in medial and anterior condylar surfaces.
Recent histology studies by Embree et al.49, showed that in mice with early-stage TMJ OA, the subchondral bone revealed increased osteoclast activity, with a gene increase in RANKL/OPG and increased expression of five genes involved in bone resorption. Ebrahim et al.52 showed that the some of our proposed imaging biomarkers (low grey-level run emphasis and long run low grey-level emphasis) were statistically correlated with the osteoclast increase in a sample of 26 condyles. Our proposed methodology demonstrated a non-invasive workflow for 3D image analysis that may be applied to further imaging and joint studies, with the ultimate goal of assessing bone remodeling using non-invasive imaging rather than histology. The proposed methods also open opportunities for investigation of correlations between imaging biomarkers for TMJ OA staging and biomolecular findings.
The diagnosis of initial changes in the subchondral bone organization requires quantitative methodologies to analyze and extract bone texture information6,12,53. Recent studies have shown the potential and value of the imaging data mining applied in cancer studies to detect early pathological tissue changes19,54. Nieminen et al.8, in a narrative review covering the years 2017–2018, reported that radiographic imaging studies were the most commonly performed examinations to assess OA . However, spatial and contrast resolution limitations in the analysis of bone textural imaging features have been reported by Caramella et al.55. These limitations were overcome in the present study by using standardized image acquisition and processing protocols (Fig. 1) for higher spatial resolution hr-CBCT scans, with a voxel size of 0.08 mm3. The novel image processing workflow presented utilized the 3D Slicer software module called BoneTexture40 due to its user-friendly interface and fast computational processing.
A limitation of this study was that we used the DC/TMD23 imaging criteria to confirm the presence of imaging features for the diagnosis of the TMJ OA; however, our hr-CBCT has a voxel size of 0.08 mm3, showing higher resolution and details than described in the DC/TMD, which uses CT scans with 0.7–1 mm slice thickness. Also, the radiology expert selected only the TMJ OA condyles that were not in the severe stages of bone destruction, suggesting that we included only cases in initial or middle TMJ OA condition. However, this study did not investigate the degree of bone destruction. Future studies will assess these challenges and limitations using traditional CBCT images versus hr-CBCT images to objectively measure and diagnose osteoarthritic changes in mandibular condyles.
An important finding of this study is that, although of lesser degree, the same biomarkers were present in the control group. The results showed statistically significant differences between the control and TMJ OA groups in the subchondral bone microstructure in the lateral and central condylar regions. Thus, these biomarkers could be clinically significant in recognizing early OA and enabling early therapy, as we will test in further studies. Future studies should also address multisource biomarkers, such as clinical and protein markers for use in combination with the textural features, in order to obtain regression models for TMJ OA diagnosis.
In conclusion, this study showed that 13 bone imaging biomarkers presented acceptable diagnostic performance for the diagnosis of TMJ OA, with AUC values between 0.620 and 0.710. The workflow for image analysis described in this study can be applied to other imaging modalities and joints and has the potential to further elucidate the pathogenesis of OA and disease progression in future investigations.
Supplementary Material
Acknowledgements
We would like to acknowledge the subjects and patients who participated in this study.
Funding
This study was funded in part by the Coordenação de Aperfeiçoamento Pessoal de Nível Superior - Brasil (CAPES) - Finance Code 001 and supported by NIH grants DE R01DE024450 and R21DE025306.
Footnotes
Publisher's Disclaimer: This is a PDF file of an unedited manuscript that has been accepted for publication. As a service to our customers we are providing this early version of the manuscript. The manuscript will undergo copyediting, typesetting, and review of the resulting proof before it is published in its final form. Please note that during the production process errors may be discovered which could affect the content, and all legal disclaimers that apply to the journal pertain.
Patient consent
All subjects signed the consent form provided in our ethical approval protocol.
Ethical approval
This study was approved by the Institutional Review Board of the University of Michigan (HUM00105204 and HUM00113199).
Competing interests
The authors declare that there is no conflict of interest regarding the publication of this article.
References
- 1.Glyn-Jones S, Palmer AJR, Agricola R, et al. Osteoarthritis. Lancet 2015: 386: 376–387. doi: 10.1016/S0140-6736(14)60802-3 [DOI] [PubMed] [Google Scholar]
- 2.Rando C, Waldron T. TMJ osteoarthritis: a new approach to diagnosis. Am J Phys Anthropol 2012: 148: 45–53. doi: 10.1002/ajpa.22039 [DOI] [PubMed] [Google Scholar]
- 3.Abramson SB, Attur M. Developments in the scientific understanding of osteoarthritis. Arthritis Res Ther 2009: 11: 227. doi: 10.1186/ar2655 [DOI] [PMC free article] [PubMed] [Google Scholar]
- 4.Schiffman E, Ohrbach R, Truelove E, et al. Diagnostic criteria for temporomandibular disorders (DC/TMD) for clinical and research applications: recommendations of the International RDC/TMD Consortium Network and Orofacial Pain Special Interest Group. J Oral Facial Pain Headache 2014: 8: 6–27. doi: 10.11607/jop.1151 [DOI] [PMC free article] [PubMed] [Google Scholar]
- 5.Wenham CYJ, Grainger AJ, Conaghan PG. The role of imaging modalities in the diagnosis, differential diagnosis and clinical assessment of peripheral joint osteoarthritis. Osteoarthritis Cartilage 2014: 22: 1692–1702. doi: 10.1016/J.JOCA.2014.06.005 [DOI] [PubMed] [Google Scholar]
- 6.Neogi T, Felson DT. Osteoarthritis: bone as an imaging biomarker and treatment target in OA. Nat Rev Rheumatol 2016: 12: 503–504. doi: 10.1038/nrrheum.2016.113 [DOI] [PMC free article] [PubMed] [Google Scholar]
- 7.Menashe L, Hirko K, Losina E, et al. The diagnostic performance of MRI in osteoarthritis: a systematic review and meta-analysis. Osteoarthritis Cartilage 2012: 20: 13–21. doi: 10.1016/j.joca.2011.10.003 [DOI] [PMC free article] [PubMed] [Google Scholar]
- 8.Nieminen MT, Casula V, Nevalainen MT, Saarakkala S. Osteoarthritis year in review 2018: imaging. Osteoarthritis Cartilage 2019: 27: 401–411. doi: 10.1016/j.joca.2018.12.009 [DOI] [PubMed] [Google Scholar]
- 9.Tiulpin A, Thevenot J, Rahtu E, Lehenkari P, Saarakkala S. Automatic knee osteoarthritis diagnosis from plain radiographs: a deep learning-based approach. Sci Rep 2018: 8: 1727. doi: 10.1038/s41598-018-20132-7 [DOI] [PMC free article] [PubMed] [Google Scholar]
- 10.Norman B, Pedoia V, Majumdar S. Use of 2D U-Net convolutional neural networks for automated cartilage and meniscus segmentation of knee MR imaging data to determine relaxometry and morphometry. Radiology 2018: 288: 177–185. doi: 10.1148/radiol.2018172322 [DOI] [PMC free article] [PubMed] [Google Scholar]
- 11.Li G, Yin J, Gao J, et al. Subchondral bone in osteoarthritis: insight into risk factors and microstructural changes. Arthritis Res Ther 2013: 15: 223. doi: 10.1186/ar4405 [DOI] [PMC free article] [PubMed] [Google Scholar]
- 12.Burr DB, Gallant MA. Bone remodelling in osteoarthritis. Nat Rev Rheumatol 2012: 8: 665–673. doi: 10.1038/nrrheum.2012.130 [DOI] [PubMed] [Google Scholar]
- 13.Paniagua B, Pascal L, Prieto J, et al. Diagnostic index: an open-source tool to classify TMJ OA condyles. Proc SPIE Int Soc Opt Eng 2017: 10137. doi: 10.1117/12.2254070 [DOI] [PMC free article] [PubMed] [Google Scholar]
- 14.Tsiklakis K, Syriopoulos K, Stamatakis HC. Radiographic examination of the temporomandibular joint using cone beam computed tomography. Dentomaxillofac Radiol 2004: 33: 196–201. doi: 10.1259/dmfr/27403192 [DOI] [PubMed] [Google Scholar]
- 15.Editorial. ALARA still applies. Oral Surg Oral Med Oral Pathol Oral Radiol Endod 2005: 100: 395–397. [DOI] [PubMed] [Google Scholar]
- 16.ICRP; Rehani MM, Gupta R, et al. Radiological protection in cone beam computed tomography (CBCT). ICRP Publication 129. Ann ICRP 2015: 44: 9–127. doi: 10.1177/0146645315575485 [DOI] [PubMed] [Google Scholar]
- 17.Dempster DW, Compston JE, Drezner MK, et al. Standardized nomenclature, symbols, and units for bone histomorphometry: a 2012 update of the report of the ASBMR Histomorphometry Nomenclature Committee. J Bone Miner Res 2013: 28: 2–17. doi: 10.1002/jbmr.1805 [DOI] [PMC free article] [PubMed] [Google Scholar]
- 18.Paniagua B, Ruellas AC, Benavides E, Marron S, Wolford L, Cevidanes L. Validation of CBCT for the computation of textural biomarkers. SPIE Med Imaging 2015: 9417: 1–15. doi: 10.1117/12.2081859 [DOI] [PMC free article] [PubMed] [Google Scholar]
- 19.Gillies RJ, Kinahan PE, Hricak H. Radiomics: images are more than pictures, they are data. Radiology 2016: 278: 563–577. doi: 10.1148/radiol.2015151169 [DOI] [PMC free article] [PubMed] [Google Scholar]
- 20.Lambin P, Rios-Velazquez E, Leijenaar R, et al. Radiomics: extracting more information from medical images using advanced feature analysis. Eur J Cancer 2012: 48: 441–446. doi: 10.1016/j.ejca.2011.11.036 [DOI] [PMC free article] [PubMed] [Google Scholar]
- 21.Valentin M, Bom C, Albuquerque M, Albuquerque M, Faria E, Correia M. Texture classification based on spectral analysis and Haralick features. Notas Técnicas 2016: 6: 28–51. doi: 10.7437/NT2236-7640/2016.01.004 [DOI] [Google Scholar]
- 22.Paniagua B, Ruellas AC, Benavides E, et al. Validation of CBCT for the computation of textural biomarkers. Proc SPIE Int Soc Opt Eng 2015: 9417: 94171B. doi: 10.1117/12.2081859 [DOI] [PMC free article] [PubMed] [Google Scholar]
- 23.Shirvaikar M, Huang N, Dong XN. The measurement of bone quality using gray level co-occurrence matrix textural features. J Med Imaging Health Inform 2016: 6: 1357–1362. doi: 10.1166/jmihi.2016.1812 [DOI] [PMC free article] [PubMed] [Google Scholar]
- 24.Vimort JB, Ruellas A, Prothero J, et al. Detection of bone loss via subchondral bone analysis. Proc SPIE Int Soc Opt Eng 2018: 10578: 25. doi: 10.1117/12.2293654 [DOI] [PMC free article] [PubMed] [Google Scholar]
- 25.Jiao K, Niu LN, Wang MQ, et al. Subchondral bone loss following orthodontically induced cartilage degradation in the mandibular condyles of rats. Bone 2011: 48: 362–371. doi: 10.1016/J.BONE.2010.09.010 [DOI] [PubMed] [Google Scholar]
- 26.Chen J, Sorensen KP, Gupta T, Kilts T, Young M, Wadhwa S. Altered functional loading causes differential effects in the subchondral bone and condylar cartilage in the temporomandibular joint from young mice. Osteoarthritis Cartilage 2009: 17: 354–361. doi: 10.1016/j.joca.2008.05.021 [DOI] [PMC free article] [PubMed] [Google Scholar]
- 27.Strimbu K, Tavel JA. What are biomarkers? Curr Opin HIV AIDS 2010: 5: 463–466. doi: 10.1097/COH.0b013e32833ed177 [DOI] [PMC free article] [PubMed] [Google Scholar]
- 28.von Elm E, Altman DG, Egger M, et al. The Strengthening the Reporting of Observational Studies in Epidemiology (STROBE) statement: guidelines for reporting observational studies. J Clin Epidemiol 2008: 61: 344–349. doi: 10.1016/j.jclinepi.2007.11.008 [DOI] [PubMed] [Google Scholar]
- 29.Schiffman EL, Ohrbach R, Truelove EL, et al. Diagnostic criteria for temporomandibular disorders (DC/TMD) for clinical and research applications: recommendations of the International RDC/TMD Consortium Network and Orofacial Pain Special Interest Group. J Oral Facial Pain Headache 2014: 28: 6–27. doi: 10.1002/aur.1474.Replication [DOI] [PMC free article] [PubMed] [Google Scholar]
- 30.Rando C, Waldron T. TMJ osteoarthritis: a new approach to diagnosis. Am J Phys Anthropol 2012: 148: 45–53. doi: 10.1002/ajpa.22039 [DOI] [PubMed] [Google Scholar]
- 31.Hunter DJ, Bierma-Zeinstra S. Osteoarthritis. Lancet 2019: 393: 1745–1759. doi: 10.1016/S0140-6736(19)30417-9 [DOI] [PubMed] [Google Scholar]
- 32.Zhao YP, Zhang ZY, Wu YT, Zhang WL, Ma XC. Investigation of the clinical and radiographic features of osteoarthrosis of the temporomandibular joints in adolescents and young adults. Oral Surg Oral Med Oral Pathol Oral Radiol Endod 2011: 111: 27–34. doi: 10.1016/j.tripleo.2010.09.076 [DOI] [PubMed] [Google Scholar]
- 33.Jaju PP, Jaju SP. Cone-beam computed tomography: time to move from ALARA to ALADA. Imaging Sci Dent 2015: 45: 263–265. doi: 10.5624/isd.2015.45.4.263 [DOI] [PMC free article] [PubMed] [Google Scholar]
- 34.Kikinis R, Pieper SD, Vosburgh KG. 3D Slicer: a platform for subject-specific image analysis, visualization, and clinical support In:, eds.: Intraoperative imaging and image-guided therapy. New York, NY: Springer, 2014: 277–289. doi: 10.1007/978-1-4614-7657-3_19 [DOI] [Google Scholar]
- 35.Yushkevich PA, Piven J, Hazlett HC, et al. User-guided 3D active contour segmentation of anatomical structures: significantly improved efficiency and reliability. Neuroimage 2006: 31: 1116–1128. doi: 10.1016/j.neuroimage.2006.01.015 [DOI] [PubMed] [Google Scholar]
- 36.Bianchi J, Gonçalves JR, Ruellas AC de O, et al. Software comparison to analyze bone radiomics from high resolution CBCT scans of mandibular condyles. Dentomaxillofac Radiol May 2019: 20190049. doi: 10.1259/dmfr.20190049 [DOI] [PMC free article] [PubMed] [Google Scholar]
- 37.Galloway MM. Texture analysis using gray level run lengths. Comput Graph Image Process 1975: 4: 172–179. doi: 10.1016/S0146-664X(75)80008-6 [DOI] [Google Scholar]
- 38.Haralick R, Shanmugan K, Dinstein I. Textural features for image classification. IEEE Trans Syst Man Cybern 1973: 3:610–621. doi: 10.1109/TSMC.1973.4309314 [DOI] [Google Scholar]
- 39.Haralick RM, Shapiro LG. Computer and robot vision. Vol. 1. Boston, MA: Addison-Wesley Longman Publishing Co., Inc., 1992: 459. [Google Scholar]
- 40.Documentation/Nightly/Extensions/BoneTextureExtension - SlicerWiki. https://www.slicer.org/wiki/Documentation/Nightly/Extensions/BoneTextureExtension [Accessibility verified April 2, 2019]
- 41.Hanley JA, McNeil BJ. The meaning and use of the area under a receiver operating characteristic (ROC) curve. Radiology 1982: 143: 29–36. doi: 10.1148/radiology.143.1.7063747 [DOI] [PubMed] [Google Scholar]
- 42.Abrahamsson AK, Kristensen M, Arvidsson LZ, Kvien TK, Larheim TA, Haugen IK. Frequency of temporomandibular joint osteoarthritis and related symptoms in a hand osteoarthritis cohort. Osteoarthritis Cartilage 2017: 25: 654–657. doi: 10.1016/j.joca.2016.12.028 [DOI] [PubMed] [Google Scholar]
- 43.O’Connor RC, Fawthrop F, Salha R, Sidebottom AJ. Management of the temporomandibular joint in inflammatory arthritis: involvement of surgical procedures. Eur J Rheumatol 2017: 4: 151–156. doi: 10.5152/eurjrheum.2016.035 [DOI] [PMC free article] [PubMed] [Google Scholar]
- 44.Wang XD, Zhang JN, Gan YH, Zhou YH. Current understanding of pathogenesis and treatment of TMJ osteoarthritis. J Dent Res 2015: 94: 666–673. doi: 10.1177/0022034515574770 [DOI] [PubMed] [Google Scholar]
- 45.Nelson AE, Golightly YM, Renner JB, et al. Brief report: differences in multijoint symptomatic osteoarthritis phenotypes by race and sex: the Johnston County Osteoarthritis Project. Arthritis Rheum 2013: 65: 373–377. doi: 10.1002/art.37775 [DOI] [PMC free article] [PubMed] [Google Scholar]
- 46.Ryan P, Lie SA, Havelin LI, et al. The progression of end-stage osteoarthritis: analysis of data from the Australian and Norwegian joint replacement registries using a multi-state model. Osteoarthritis Cartilage 2012: 21: 405–412. doi: 10.1016/j.joca.2012.12.008 [DOI] [PubMed] [Google Scholar]
- 47.Schaible HG. Mechanisms of chronic pain in osteoarthritis. Curr Rheumatol Rep 2012: 14: 549–556. doi: 10.1007/s11926-012-0279-x [DOI] [PubMed] [Google Scholar]
- 48.Embree M, Ono M, Kilts T, et al. Role of subchondral bone during early-stage experimental TMJ osteoarthritis. J Dent Res 2011: 90: 1331–1338. doi: 10.1177/0022034511421930 [DOI] [PMC free article] [PubMed] [Google Scholar]
- 49.Embree M, Ono M, Kilts T, et al. Role of subchondral bone during early-stage experimental TMJ osteoarthritis. J Dent Res 2011. doi: 10.1177/0022034511421930 [DOI] [PMC free article] [PubMed] [Google Scholar]
- 50.de Dumast P, Mirabel C, Cevidanes L, et al. A web-based system for neural network based classification in temporomandibular joint osteoarthritis. Comput Med Imaging Graph 2018: 67: 45–54. doi: 10.1016/j.compmedimag.2018.04.009 [DOI] [PMC free article] [PubMed] [Google Scholar]
- 51.Cevidanes LHS, Walker D, Schilling J, et al. 3D osteoarthritic changes in TMJ condylar morphology correlates with specific systemic and local biomarkers of disease. Osteoarthritis Cartilage 2014: 22: 1657–1667. doi: 10.1016/j.joca.2014.06.014 [DOI] [PMC free article] [PubMed] [Google Scholar]
- 52.Ebrahim FH, Ruellas ACO, Paniagua B, et al. Accuracy of biomarkers obtained from cone beam computed tomography in assessing the internal trabecular structure of the mandibular condyle. Oral Surg Oral Med Oral Pathol Oral Radiol 2017: 124: 588–599. doi: 10.1016/j.oooo.2017.08.013 [DOI] [PMC free article] [PubMed] [Google Scholar]
- 53.Bousson V, Lowitz T, Laouisset L, Engelke K, Laredo JD. CT imaging for the investigation of subchondral bone in knee osteoarthritis. Osteoporos Int 2012: 23(8 Suppl): 861–865. doi: 10.1007/s00198-012-2169-5 [DOI] [PubMed] [Google Scholar]
- 54.Starkov P, Aguilera TA, Golden DI, et al. The use of texture-based radiomics CT analysis to predict outcomes in early-stage non-small cell lung cancer treated with stereotactic ablative radiotherapy. Br J Radiol 2019: 92: 20180228. doi: 10.1259/bjr.20180228 [DOI] [PMC free article] [PubMed] [Google Scholar]
- 55.Caramella C, Allorant A, Orlhac F, et al. Can we trust the calculation of texture indices of CT images? A phantom study. Med Phys 2018: 45: 1529–1536. doi: 10.1002/mp.12809 [DOI] [PubMed] [Google Scholar]
Associated Data
This section collects any data citations, data availability statements, or supplementary materials included in this article.