Abstract
The analysis of -ray spectra can be an arduous task, especially in the case of room temperature semiconductor detectors, where several distortions and instrumental artifacts conceal the true spectral shape. We developed a genetic algorithm to perform the unfolding of -spectra in order to restore the true energy distribution of the incoming radiation. We successfully validated our approach on experimental spectra of four radionuclides (Am, Co, Cs and Ba) acquired with two -based detectors with different contact geometries (single pixel and drift strip). The unfolded spectra consist of -like peaks in correspondence with the radiation emissions of each radioisotope.
Keywords: gamma spectrum, unfolding algorithm, genetic algorithm
1. Introduction
For many years, experimental scientists have pursued the goal of extracting the ground truth from a measurement by removing the instrumental response function. This attempt is fundamental in every field where the relevant information may be concealed or distorted by non-ideal behavior of the measuring instrument, such as the one of room temperature semiconductor detectors (RTSD). RTSDs are largely employed today for medical and astrophysical applications [1], as well as for environmental monitoring [2] and for high flux applications [3,4]. The main source of distortion is related to those events of radiation interaction for which the total energy deposited is inferior to the real energy of the incoming photon. These events produce several specific features in the final spectrum: fluorescence and escape peaks, Compton edges, backscattered peaks, and pair production peaks. Such additional features clearly appear in the spectrum of a mono-energetic incident radiation, but they are hard to distinguish in the case of a multi-energy radioactive source or a continuous incident spectrum. Secondly, the photogenerated charges may undergo an incomplete collection due to carrier trapping, which leads to asymmetric peaks (“hole tailing”); such incomplete collection depends on defect concentration, contacts geometry, and crystal thickness. Finally, RTSDs are characterized by a poorer signal-to-noise ratio than cooled - or -based detectors, which leads to broad and overlapped lines. Since most common isotope identification algorithms are based on peak search methods, all of these features represent an obstacle to a straightforward data analysis. Although advanced technological solutions can be adopted to improve the overall performances of these devices [5,6], in some applications, compactness and cost-effectiveness of the whole system are of primary concern, leading to limited spectral performances.
The so-called spectral unfolding or spectral deconvolution consists of removing all the distortions mentioned above from a measured spectrum and restoring the real energy distribution of the incident radiation [7]. In the case of -spectra, this process is able to extract -like peaks which correspond to the characteristic emissions of a given radionuclide. In this way, spectral unfolding drastically improves the output spectra of devices with low or average energy resolution, where different peaks often overlap owing to poor signal-to-noise ratio. As a matter of fact, the final goal of analyzing -spectra is to identify the radionuclides which produced it: this is a typical pattern recognition problem that can be addressed with various approaches (e.g., peak search and match, template matching, regions of interest) [8]. Spectral unfolding could ease this task by removing undesired features and bringing out the relevant ones. This can be achieved by solving the Fredholm integral equation of the first kind which describes the response of the instrument:
| (1) |
where is the measured energy distribution, is the real energy distribution, and R is the response function of the detector. The meaning of is straightforward: it represents the probability density function (PDF) that an incoming photon of energy E is measured with an energy . For actual measurements, spectra are discretized, that is, and S are vectors, and R is a matrix:
| (2) |
However, inverting R is not trivial since it is quasi-singular, making the problem ill-posed. Moreover, the problem is further complicated by the presence of a noise term which modifies Equation (2) into
| (3) |
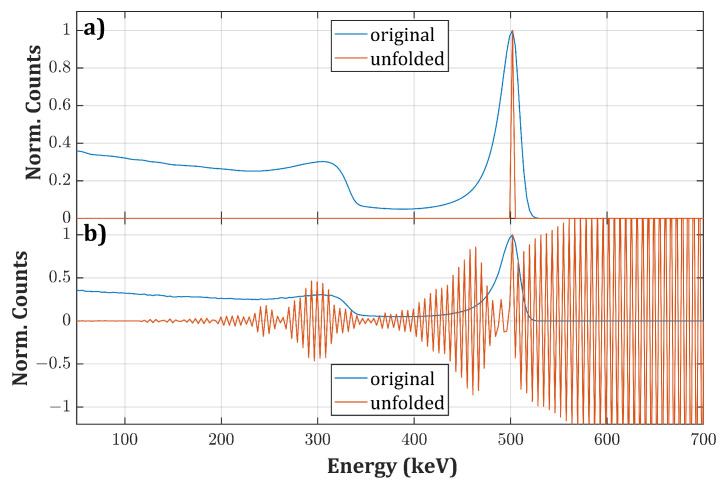
If vectors satisfying or exist, where is negligible with respect to , they can be added to the true physical solution and Equation (3) would still be satisfied. However, since the problem is unstable for small fluctuations, these additional terms may dominate with respect to the true spectrum , thus making the number of potential solutions infinite within error bounds [7]. As a consequence, if we just apply to a measured spectrum, small uncertainties cause large oscillations and non-physical features in the unfolded spectrum (Figure 1).
Figure 1.
(a) Ideal synthetic spectrum (i.e., a column of R) for a monoenergetic radiation of 500 keV (blue curve) and the corresponding unfolded spectrum after applying R (orange curve); (b) same spectrum after adding a slight Gaussian noise (blue curve) and the corresponding unfolded spectrum after applying R (orange curve).
The mathematical complexity of the problem encouraged the scientific community to develop innovative and robust methods to invert Equation (2) in order to find S. Different methods have appeared on the scene over the decades which can be gathered into various categories (direct inversion [9], least-squares [10,11], Monte Carlo [12,13], iterative [14,15,16,17,18,19], and Bayesian [20,21,22]). Recently, thanks to the increasing popularity of machine learning, alternative approaches have been proposed for unfolding neutron spectra (neural networks [23,24,25,26] and genetic algorithms [27,28]). This class of algorithms certainly allows for facing the problem in a completely new way. Here, we propose an approach based on the Genetic Algorithm (GA) which is inspired by the Darwinian theory of natural selection. This type of algorithm is a branch of the evolutionary computation family and is usually employed in the optimization and search problem. Here, the task of GA is neither inverting R nor finding the mathematical solution to this problem: it searches for an approximate and physically reasonable solution which best matches the measured spectrum. As a matter of fact, the metaheuristic procedure performed by a GA allows for speeding up the solution search with respect to a Monte Carlo approach. At the same time, it is characterized by a random component which permits a better exploration of the solution space with respect to other iterative and predetermined methods, where, given a certain input, the algorithm always converges to the same output [15,17,18]. The stochastic optimization performed by GAs is extremely fast and accurate even without prior assumptions. Moreover, we propose an approach to further accelerate the search by choosing a proper initialization in order to direct the algorithm on the right path. The algorithm has been validated on actual experimental spectra of different radionuclides acquired with different detectors based on ().
2. Materials and Methods
In this section, we outline the basic principles of GAs and how these procedures have been implemented in this work. Furthermore, we describe the experimental conditions and the characteristics of the CZT detectors employed to acquire the -spectra.
2.1. Genetic Algorithm
GAs, as already briefly mentioned, emulate the process of selection performed by a hostile environment on a population of individuals. The ones with the best characteristics are more likely to pass down their gene pool to the offspring, whereas weak individuals die without reproducing (“survival of the fittest”). As a result, the overall fitness of the population will improve through generations. In computer science, the individuals (or solutions) are arrays of bits/integers/real numbers that undergo four basic operations:
production the first generation of individuals (initialization)
selection of individuals for mating (selection)
generation of new individuals (crossover)
modification of the genome (mutation)
In the present work, the individuals represent possible incident energy PDF. They consist of vectors of non-negative values with a unitary area whose length L is equal to the length of the measured spectrum. Their genes, which are the normalized number of counts in each channel, determine how the measured spectrum would appear through the convolution with the response function . Thus, the fitness, which represents the objective function, is defined as
| (4) |
where is a potential solution. Therefore, the best individual is the one that minimizes the normalized residual sum of squares (RSS) between the observed spectrum and its convolution with R. In order to maximize the exploration of the search space, the initial population is randomly generated, and it is composed of individuals. The selection is performed by running a number of “tournaments” given by the product, where is the crossover probability (see Table 1). The fitnesses of the competitors are compared, and the one with the lower f obtains the right of procreating:
| (5) |
where and are two randomly selected individuals. Then, the selected individuals are combined in pairs to produce an equal number of offspring: given two parents and (i.e., the winners of two different tournaments), the offspring and are defined as the weighted average of the parents:
| (6) |
where is a constant. Subsequently, a number of genes, given by the product where is the mutation probability, is randomly selected in each new generated solution for the mutation: their values are replaced with random ones in the interval , where is the value in the selected i-th channel, and m is a tuned parameter (see Table 1). Usually, at this point, a smoothing step is required since highly oscillating solutions can still give good results because of the quasi-singularity of R [28], although this operation would also broaden true peaks. However, in this case, smoothing is not required thanks to the choice of the crossover method, which allows for attenuating great differences among individuals without smearing out the real characteristic lines. After normalizing the area of the mutated offspring, the fitness is again evaluated for all the new individuals and the entire population is resized by discarding the worst ones (elitist selection). The algorithm stops after a maximum number of iterations or when f falls below a certain threshold. As the last step, each bin is multiplied by a gain which accounts for the photons which pass through the crystal without interacting. This information is provided by the simulation tool used to obtain R (see the next section). The values of the parameters used in each step are reported in Table 1, and the flow chart of the code is shown in Figure 2. A calibration procedure has been performed to tune them to obtain the best overall performances in terms of running time (time required per each generation) and convergence speed (number of generations required to reach the goal). The algorithm has been implemented in MATLAB and has been tested on a standard single-core laptop.
Table 1.
Description and values of the parameters used in the GA.
| Parameter | Description | Value |
|---|---|---|
| Size of the population | 50 | |
| Crossover probability | 0.8 | |
| Mutation probability | 0.01 | |
| w | Crossover weight | 0.3 |
| m | Mutation upper bound | 3 |
Figure 2.
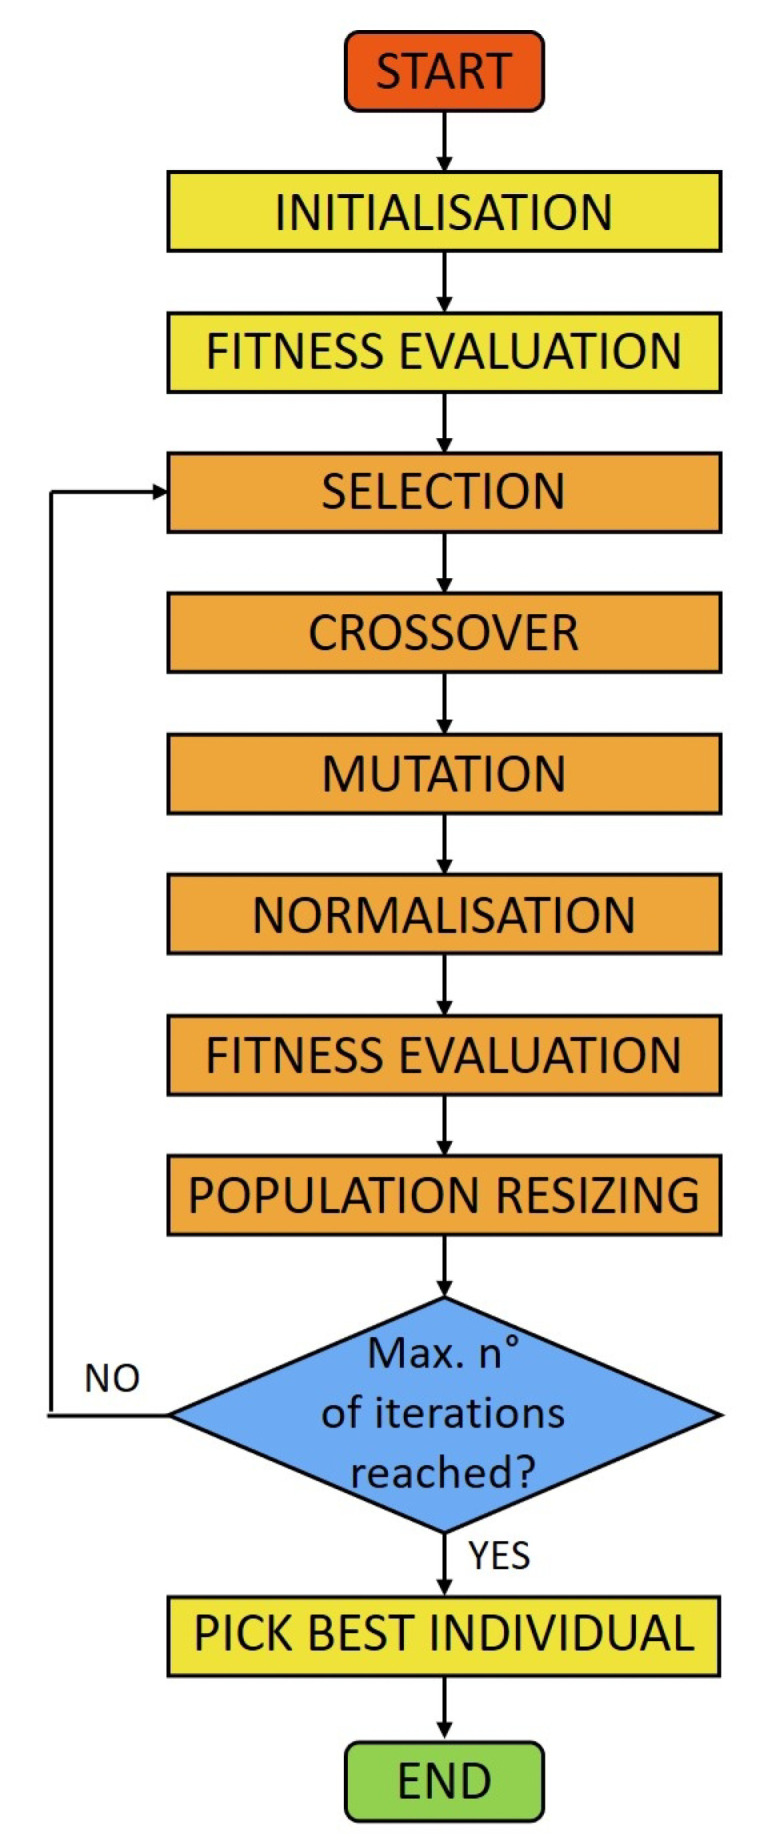
Flowchart of the GA used in this work.
2.2. Experimental Validation
We tested the algorithm on experimental spectra acquired with detectors with different size and contact geometry.
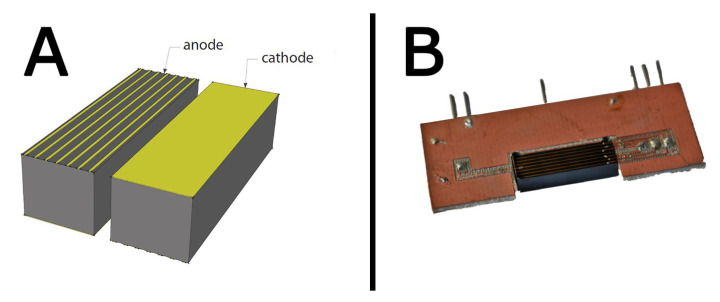
The first detector consists of a mm crystal realized by reprocessing standard spectroscopic grade CZT material purchased from Redlen Technologies (Canada). The crystal presents a strip electrode geometry: the anode is segmented in seven 250 m strips with an intergap of 550 m, whereas the cathode is full area (Figure 3). Contacts were realized with gold electroless deposition in aqueous solution. Starting from the most external to the central one, the strips were polarized at V, V, V, and 0 V, respectively, and the cathode was biased at V. This geometry allows for drifting the photogenerated carriers towards the collecting central strip and guarantees a high energy resolution above 100 keV regardless of the irradiation direction. The analog readout system was developed by due2Lab s.r.l. The readout channel includes a Cremat CR110 CSP (decay time s), a shaper amplifier (shaping time s), and a peak detector. The energy resolution is 3.9% FWHM @662 keV.
Figure 3.
(A) 3D model of the drift strip detector; (B) actual CZT detector bonded to the intermediate electronic board.
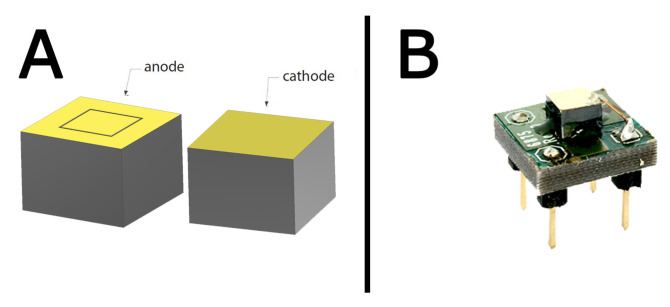
The second detector consists of a mm detector obtained by reprocessing a standard CZT crystal purchased from Redlen Technologies (Canada) with a full-area cathode, a mm pixel, and a guard ring on the anode with a gap of 50 m (Figure 4). Sensor refabrication has been carried out by due2lab s.r.l.; gold contacts were fabricated using the electroless deposition process from alcoholic solution as described in [29,30]. The detector was biased at V, and it was irradiated from the cathode side. The CZT sensor unit (D2L001) and the single-channel digital pulse processor unit (D2L009-1) are part of the Hyperspectral X-ray Spectrometer (HXS) developed by due2lab. The energy resolution is 4.0% FWHM @60 keV.
Figure 4.
(A) 3D model of the single pixel detector; (B) actual CZT detector bonded to the intermediate electronic board.
The response function of both detectors was obtained using the simulation tool described in [31], which considers each step of the signal generation process, from the radiation–matter interaction to the charge transport to the signal induction on contacts. We tested the algorithm on four different radioactive sources: and with the drift strip detector; and with the single pixel detector. Experimental spectra were re-binned on the energy vector of (256 bins in the 0–150 keV and 0–750 keV energy range for the single pixel and drift strip detectors, respectively).
3. Results
In this section, we present the experimental validation of the proposed algorithm on actual -spectra of four different radionuclides: , Ba, and . The best individual in the population after generations is taken as the final solution (referred to as unfolded spectrum) which is compared to the tabulated intensities for emission of X- and -photons in the case of unshielded radioactive sources [32]. In the case of , the -ray emissions’ intensities are compared to the ones reported in [33] (self-fluorescence of and scattered bumps are not considered). Tabulated intensities are normalized with respect to the main photopeak. The convolution of the solution with (referred to as the folded spectrum) is instead compared to the measured spectrum. We observed that a number of iterations greater than would not improve the fitness because of non-idealities of R and the presence of experimental noise. Thus, the reported RSS values represent the lower achievable limit. The PhotoPeak Enhancement (PPE) is defined as the ratio between the intensities of the main photopeaks of each source before and after applying the algorithm. Results are summarized in Table 2.
Table 2.
RSS and PPE values for each deconvoluted spectra reported in this work.
| Isotope | Detector | RSS | PPE |
|---|---|---|---|
| Drift strip | 64.8 | ||
| Drift strip | 17.6 | ||
| Single pixel | 12.0 | ||
| Single pixel | 4.9 |
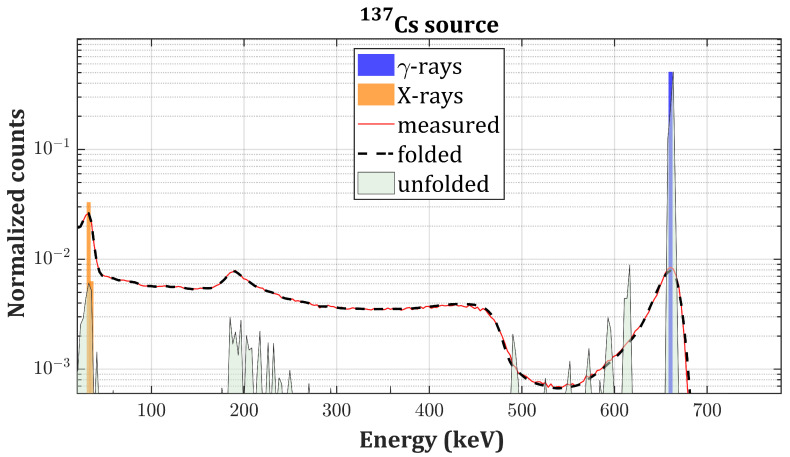
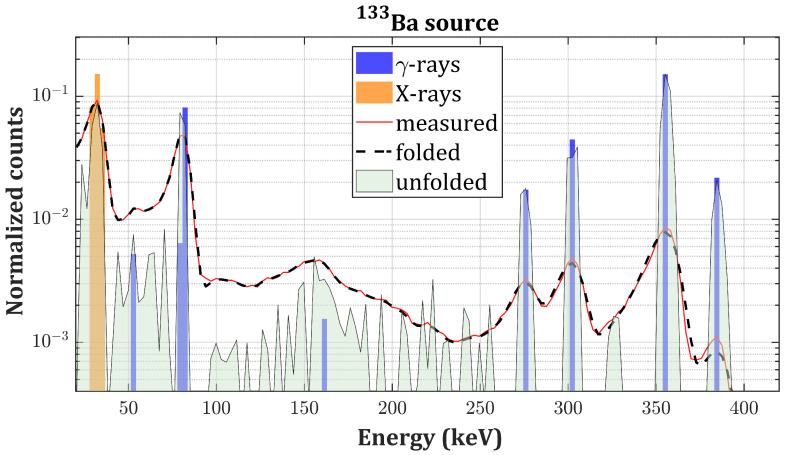
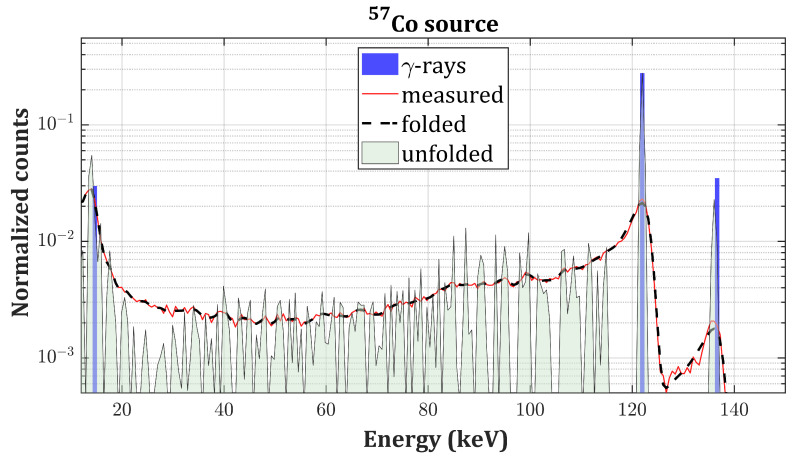
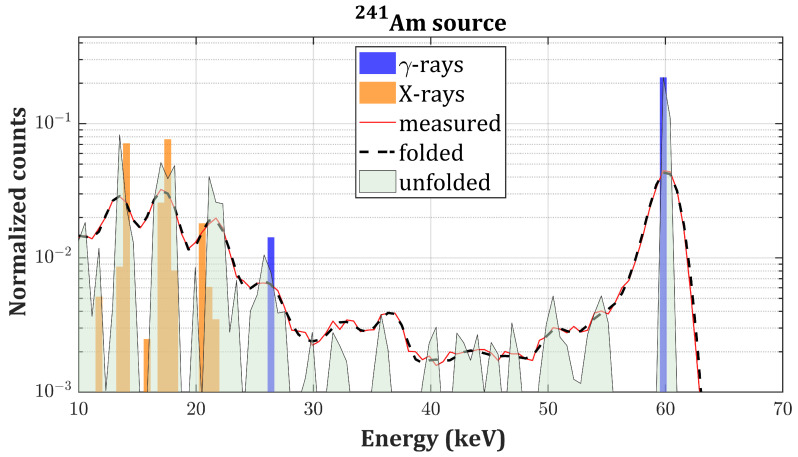
Figure 5 and Figure 6 present the results of the deconvolution of and -spectra, respectively, measured with the drift strip detector (Figure 3). Figure 7 and Figure 8 present the results of the deconvolution of and -spectra, respectively, measured with the single pixel detector (Figure 4).
Figure 5.
unfolded spectrum (gray curve) compared to the measured spectrum (red curve), the folded spectrum (black dashed curve), and the tabulated intensities of the -emissions (blue bars) and X-emissions (orange bars) of on a logarithmic scale.
Figure 6.
unfolded spectrum (gray curve) compared to the measured spectrum (red curve), the folded spectrum (black dashed curve) and the tabulated intensities of the -emissions (blue bars) and X-emissions (orange bars) of on a logarithmic scale.
Figure 7.
unfolded spectrum (gray curve) compared to the measured spectrum (red curve), the folded spectrum (black dashed curve) and the tabulated intensities of the -emissions (blue bars) of on a logarithmic scale.
Figure 8.
unfolded spectrum (gray curve) compared to the measured spectrum (red curve), the folded spectrum (black dashed curve) and the tabulated intensities of the -emissions (blue bars) and X-emissions (orange bars) of on a logarithmic scale.
4. Discussion
The unfolding process based on GA successfully removed escape peaks, Compton edges, and continua and peak broadening from the -spectra of four different radionuclides (, , and ), and the unfolded spectra consists of -like peaks. PPE values indicate a remarkable improvement of the signal-to-noise-ratio. By increasing the energy, the extent of Compton scattering grows, hence the enhancement is more evident. First of all, it should be emphasized that these results prove and confirm the accuracy of the simulation tool used to produce the response function R [31]. Secondly, this approach effectively takes advantage of all the information contained in the measured spectra to reconstruct and enhance even the weakest photopeaks without prior assumptions about the incident radiation.
Regarding the drift strip detector, the relative intensities of the unfolded peaks are in good agreement with the tabulated ones except in the 0–30 keV energy region (probably because of a partial shielding from the detector case), and the folded spectra remarkably match the measurements. However, spiky residuals are still present on the low energy side of the photopeaks in the 500–600 keV and in the 200–250 keV energy ranges in Figure 5b and Figure 6b, respectively. This is due to the non-idealities of the response matrix, which partially fails to reproduce the effect of double Compton events, the only ones which could produce counts in these energy ranges. The simulator underestimates the extent of this effect, and additional peaks are required to match folded spectra with the measurements. Furthermore, the backscattering peaks are still present after the deconvolution in the 190–300 keV energy range in Figure 5b and in the 120–190 keV energy range in Figure 6b. The reason relies on the fact that the response matrix was obtained by simulating the interaction of the radiation with a bare crystal. The absence of components in the physical surroundings of the detector (e.g., metallic case, electronic read out) prevented the formation of this feature in the simulated spectra. Thus, the algorithm interprets the backscattering peak as an actual photon source. The overall shape and intensity of the backscattering peaks are indeed preserved in the unfolded spectra (without the noise broadening) because it is not considered as an artifact introduced by the instrument. This could be easily fixed by simulating the interaction with the whole detector.
The results of the unfolding process applied to the spectra measured with the single pixel detector are slightly less satisfactory. As a matter of fact, the simulation tool does not consider the possibility of the photogenerated charge cloud to be collected by multiple electrodes (“charge sharing effect”). In this case, this phenomenon occurs when a photon interacts in the volume below the gap between the pixel and the guardring. After drifting towards the anode, the cloud is shared among these two contacts and the amount of charge collected by the pixel (i.e., what we actually measure) depends on the distance of the cloud from the center of the pixel. The extent of these losses spans from 0 to the full energy of the photon, hence producing residuals in the whole energy range up to the photopeak position: this is approximately what we observe in the unfolded spectra in Figure 7 and Figure 8. The algorithm struggles to reconstruct the intermediate region, and the final RSS values are slightly higher with respect to the drift strip detector.
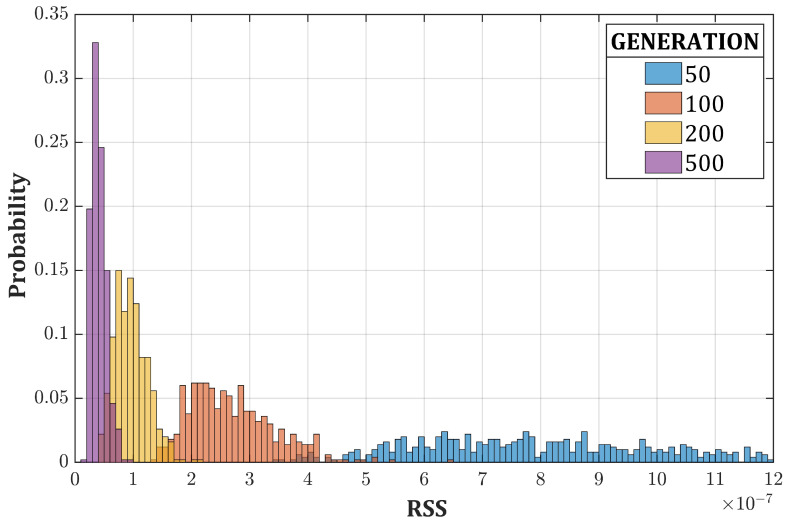
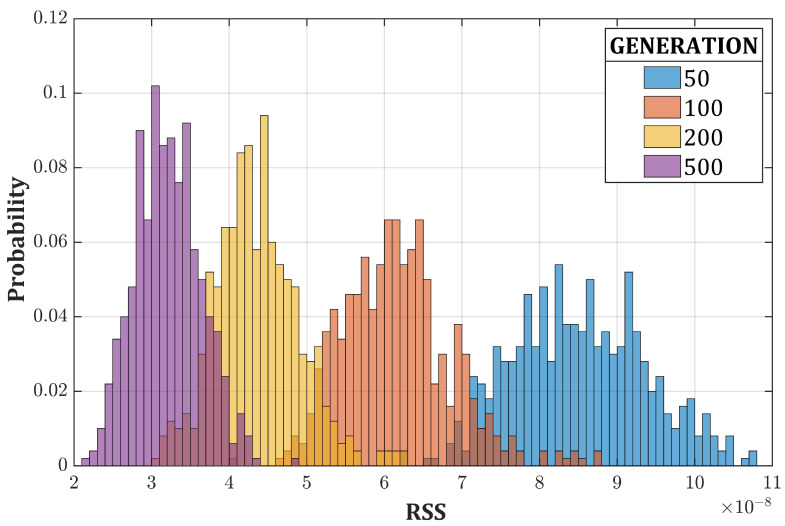
We demonstrated the robustness of the algorithm by obtaining remarkable results even starting from randomly generated candidate solutions. We stress the fact that the algorithm is able to reproducibly find the best approximate solution, provided that a sufficient number of generations has passed as shown in Figure 9, where the RSS of the unfolded spectrum is reported as a function of the number of generations. This is indeed a peculiarity of GAs: if the random component (selection, crossover and mutation) is correctly calibrated, local minima do not represent an obstacle.
Figure 9.
Probability density function of the RSS for the spectrum as a function of the number of iterations for the standard GA (500 run each).
However, at the beginning, the convergence speed is low. The reason relies on the fact that the GA starts from a completely random situation and the first few hundreds of iterations are required just to find good candidate solutions which are later refined. In the first generations, the crossover is less effective since randomly generated individuals are combined, thus obtaining nearly equivalent solutions. An actual improvement can only be achieved when the correct genes are mutated (i.e., when peaks starts appearing), but this means that the main leading operation is the mutation whose extent is, however, quite limited. Mutating a larger number of genes would indeed stimulate the generation of better candidate solutions, but this would be detrimental in the second part where an excessive mutation would deteriorate the new individuals. A possible solution consists of using a variable mutation parameter which decreases as the average fitness improves (Adaptive GA), but it would be difficult to finely tune and m in combination with to obtain the best overall performances. Instead, we propose to exploit the information contained in the measured spectra to overcome this problem by smartly initializing the population. This procedure is referred to as “seeding”, and it consists of inserting suitable guesses in the first generation to direct the algorithm on the right path and to greatly increase the convergence speed. As a matter of fact, the measured spectrum still preserves several features of the true incident radiation (photopeaks), and it would definitely represent a valid guess. A much better candidate can actually be obtained by applying the iterative method described in [15]:
| (7) |
where and are the partially unfolded spectra after n and iterations, respectively. Our choice of this algorithm derives from its simplicity and, thus, its speed. After few iterations (5 in this case), Compton continua are reduced and the peaks are emphasized. Inserting only one partially unfolded individual in the initial population (RSS ∼5 × 10 in the case of the spectrum) is enough because the crossover (Equation (6)) and the elitist selection facilitate a fast diffusion of the strong genes among the whole population. In this way, the crossover is extremely effective since the beginning, and we achieved the goal of guiding the algorithm without excessively restricting the search process, which could lead to local optima (Figure 10). The performances (RSS average values and standard deviations) of Figure 9 and Figure 10 are summarized in Table 3.
Figure 10.
Probability density function of the RSS for the spectrum as a function of the number of iterations for the boosted GA (500 run each).
Table 3.
Average value and standard deviation of RSS and average running time as a function of the number of iterations (500 run each) for both standard and seeding GA.
| Standard GA | Seeding GA | ||||
|---|---|---|---|---|---|
|
N of
Generations |
RSS |
Av. Running
Time (ms) |
N of
Generations |
RSS |
Av. Running
Time (ms) |
| 50 | 84 | 50 | 85 | ||
| 100 | 157 | 100 | 158 | ||
| 200 | 313 | 200 | 316 | ||
| 500 | 780 | 500 | 785 | ||
5. Conclusions
An unfolding approach of -spectra based on GA is proposed. The experimental validation was performed by unfolding of the spectra of four radionuclides: and measured with the drift strip detector; and measured with the single pixel detector. The unfolded spectra successfully consist of -like lines in correspondence with the characteristic - and X-emissions of each source, and the relative intensities are in good agreement with the tabulated ones. The physical explanation of the residuals present after the deconvolution process is given. Fundamentally, the limits of this approach derive from the accuracy of the simulation toolkit used to calculate the spectral response matrix, provided that statistical noise is negligible in the energy region in which the relevant features are present. Studies are ongoing to consider the charge sharing effect in the simulation of R, hence allowing to extend the approach on pixelated detectors. The application of GA in this context allows for bypassing the problem of inverting R, hence avoiding the need of regularizations. The simplicity of the operations used in this work ensures low computation and high speed, thus allowing its implementation on a Field Programmable Gate Array. Furthermore, a method to boost the search process is proposed to effectively exploit the physical information contained in the measured spectra.
This approach can be extended to different classes of radiation detectors where it is possible to accurately simulate the response function of the device.
Abbreviations
The following abbreviations are used in this manuscript:
| RTSD | Room Temperature Semiconductor Detector |
| GA | Genetic Algorithm |
| CZT | Cadmium Zinc Telluride |
| RSS | Residual Sum of Squares |
| CSP | Charge Sensing Preamplifier |
| PPE | PhotoPeak Enhancement |
Author Contributions
Conceptualization, N.S.A., M.B., and A.Z.; methodology, N.S.A. and M.B.; software, N.S.A., M.B., and N.Z.; validation, N.S.A. and M.B.; formal analysis, N.S.A. and M.B.; investigation, N.S.A., M.B., N.Z., S.Z., and A.Z.; resources, N.Z., G.B., and A.Z.; data curation, N.S.A., M.B., and N.Z.; writing—original draft preparation, N.S.A.; writing—review and editing, M.B., N.Z., S.Z., G.B., and A.Z:; visualization, N.S.A.; supervision, N.Z. and A.Z.; project administration, N.Z. and A.Z. All authors have read and agreed to the published version of the manuscript.
Funding
This research received no external funding.
Conflicts of Interest
The authors declare no conflict of interest.
Footnotes
Publisher’s Note: MDPI stays neutral with regard to jurisdictional claims in published maps and institutional affiliations.
References
- 1.Del Sordo S., Abbene L., Caroli E., Mancini A.M., Zappettini A., Ubertini P. Progress in the Development of CdTe and CdZnTe Semiconductor Radiation Detectors for Astrophysical and Medical Applications. Sensors. 2009;9:3491–3526. doi: 10.3390/s90503491. [DOI] [PMC free article] [PubMed] [Google Scholar]
- 2.Aleotti J., Micconi G., Caselli S., Benassi G., Zambelli N., Bettelli M., Zappettini A. Detection of Nuclear Sources by UAV Teleoperation Using a Visuo-Haptic Augmented Reality Interface. Sensors. 2017;17:2234. doi: 10.3390/s17102234. [DOI] [PMC free article] [PubMed] [Google Scholar]
- 3.Abbene L., Gerardi G., Turturici A., Raso G., Benassi G., Bettelli M., Zambelli N., Zappettini A., Principato F. X-ray response of CdZnTe detectors grown by the vertical Bridgman technique: Energy, temperature and high flux effects. Nucl. Instrum. Methods Phys. Res. Sect. Accel. Spectrom. Detect. Assoc. Equip. 2016;835:1–12. doi: 10.1016/j.nima.2016.08.029. [DOI] [Google Scholar]
- 4.Abbene L., Gerardi G., Raso G., Principato F., Zambelli N., Benassi G., Bettelli M., Zappettini A. Development of new CdZnTe detectors for room-temperature high-flux radiation measurements. J. Synchrotron Radiat. 2017;24:429–438. doi: 10.1107/S1600577517000194. [DOI] [PubMed] [Google Scholar]
- 5.Zhang F., He Z., Xu D. Analysis of detector response using 3-D position-sensitive CZT gamma-ray spectrometers. IEEE Trans. Nucl. Sci. 2004;51:3098–3104. doi: 10.1109/TNS.2004.839078. [DOI] [Google Scholar]
- 6.Abbaszadeh S., Gu Y., Reynolds P.D., Levin C.S. Characterization of a sub-assembly of 3D position sensitive cadmium zinc telluride detectors and electronics from a sub-millimeter resolution PET system. Phys. Med. Biol. 2016;61:6733–6753. doi: 10.1088/0031-9155/61/18/6733. [DOI] [PubMed] [Google Scholar]
- 7.Bouchet L. A comparative study of deconvolution methods for gamma-ray spectra. Astron. Astrophys. Suppl. 1995;113:167–183. [Google Scholar]
- 8.Nelson K.E., Monteral M., USDOE National Nuclear Security Administration (NNSA) Benchmark Algorithm for RadioNuclide Identification v1.0, Version 1. USDOE National Nuclear Security Administration (NNSA); Washington, DC, USA: 2019. [DOI] [Google Scholar]
- 9.Hubbell J.H., Scofield N.E. Unscrambling of Gamma-Ray Scintillation Spectrometer Pulse-Height Distributions. IRE Trans. Nucl. Sci. 1958;5:156–158. doi: 10.1109/TNS2.1958.4315646. [DOI] [Google Scholar]
- 10.Perey F.G. Least-Squares Dosimetry Unfolding: The Program STAY’SL. Oak Ridge National Lab., Tenn. (USA); Oak Ridge, TN, USA: 1977. Technical Report 9374132. [Google Scholar]
- 11.Routti J.T., Sandberg J.V. General purpose unfolding program LOUHI78 with linear and nonlinear regularizations. Comput. Phys. Commun. 1980;21:119–144. doi: 10.1016/0010-4655(80)90081-8. [DOI] [Google Scholar]
- 12.Sanna R., O’Brien K. Monte-Carlo unfolding of neutron spectra. Nucl. Instrum. Methods. 1971;91:573–576. doi: 10.1016/0029-554X(71)90680-X. [DOI] [Google Scholar]
- 13.O’Brien K., Sanna R. Neutron spectral unfolding using the Monte Carlo method. Nucl. Instrum. Methods Phys. Res. 1981;185:277–286. doi: 10.1016/0029-554X(81)91222-2. [DOI] [Google Scholar]
- 14.Su Y. Study of scintillation spectrometry: Unfolding methods. Nucl. Instrum. Methods. 1967;54:109–115. doi: 10.1016/S0029-554X(67)80014-4. [DOI] [Google Scholar]
- 15.Guttormsen M., Tveter T.S., Bergholt L., Ingebretsen F., Rekstad J. The unfolding of continuum γ-ray spectra. Nucl. Instrum. Methods Phys. Res. Sect. Accel. Spectrom. Detect. Assoc. Equip. 1996;374:371–376. doi: 10.1016/0168-9002(96)00197-0. [DOI] [Google Scholar]
- 16.Bandžuch P., Morháč M., Krištiak J. Study of the Van Cittert and Gold iterative methods of deconvolution and their application in the deconvolution of experimental spectra of positron annihilation. Nucl. Instrum. Methods Phys. Res. Sect. Accel. Spectrom. Detect. Assoc. Equip. 1997;384:506–515. doi: 10.1016/S0168-9002(96)00874-1. [DOI] [Google Scholar]
- 17.Beach S.M., DeWerd L.A. Deconvolution and reconstruction techniques of closely spaced low-energy spectra from high-purity germanium spectrometry. Nucl. Instrum. Methods Phys. Res. Sect. Accel. Spectrom. Detect. Assoc. Equip. 2007;572:794–803. doi: 10.1016/j.nima.2006.12.006. [DOI] [Google Scholar]
- 18.Morháč M., Matoušek V. Complete positive deconvolution of spectrometric data. Digit. Signal Process. Rev. J. 2009;19:372–392. doi: 10.1016/j.dsp.2008.06.002. [DOI] [Google Scholar]
- 19.Chen Y., Chen X., Lei J., An L., Zhang X., Shao J., Zheng P., Wang X. Unfolding the fast neutron spectra of a BC501A liquid scintillation detector using GRAVEL method. Sci. China Phys. Mech. Astron. 2014;57:1885–1890. doi: 10.1007/s11433-014-5553-7. [DOI] [Google Scholar]
- 20.Tichy M. Bayesian approach to neutron spectrum adjustment. Nucl. Instrum. Methods Phys. Res. Sect. Accel. Spectrom. Detect. Assoc. Equip. 1988;267:502–508. doi: 10.1016/0168-9002(88)90492-5. [DOI] [Google Scholar]
- 21.Reginatto M., Goldhagen P., Neumann S. Spectrum unfolding, sensitivity analysis and propagation of uncertainties with the maximum entropy deconvolution code MAXED. Nucl. Instrum. Methods Phys. Res. Sect. Accel. Spectrom. Detect. Assoc. Equip. 2002;476:242–246. doi: 10.1016/S0168-9002(01)01439-5. [DOI] [Google Scholar]
- 22.Medkour Ishak-Boushaki G., Allab M. Comparison between standard unfolding and Bayesian methods in Bonner spheres neutron spectrometry. Nucl. Instrum. Methods Phys. Res. Sect. Accel. Spectrom. Detect. Assoc. Equip. 2012;689:35–39. doi: 10.1016/j.nima.2012.06.016. [DOI] [Google Scholar]
- 23.Koohi-Fayegh R., Green S., Crout N., Taylor G., Scott M. Neural network unfolding of photon and neutron spectra using an NE-213 scintillation detector. Nucl. Instrum. Methods Phys. Res. Sect. Accel. Spectrom. Detect. Assoc. Equip. 1993;329:269–276. doi: 10.1016/0168-9002(93)90946-F. [DOI] [Google Scholar]
- 24.R. Kardan M., Setayeshi S., Koohi-Fayegh R., Ghiassi-Nejad M. Neutron spectra unfolding in Bonner spheres spectrometry using neural networks. Radiat. Prot. Dosim. 2003;104:27–30. doi: 10.1093/oxfordjournals.rpd.a006158. [DOI] [PubMed] [Google Scholar]
- 25.Avdic S., Pozzi S.A., Protopopescu V. Detector response unfolding using artificial neural networks. Nucl. Instrum. Methods Phys. Res. Sect. Accel. Spectrom. Detect. Assoc. Equip. 2006;565:742–752. doi: 10.1016/j.nima.2006.06.023. [DOI] [Google Scholar]
- 26.Yan J., Liu R., Li C., Jiang L., Wang M. Application of artificial neural networks for unfolding neutron spectra by using a scintillation detector. Sci. China Physics, Mech. Astron. 2011;54:465–469. doi: 10.1007/s11433-011-4258-4. [DOI] [Google Scholar]
- 27.Mukherjee B. BONDI-97: A novel neutron energy spectrum unfolding tool using a genetic algorithm. Nucl. Instrum. Methods Phys. Res. Sect. Accel. Spectrom. Detect. Assoc. Equip. 1999;432:305–312. doi: 10.1016/S0168-9002(99)00535-5. [DOI] [Google Scholar]
- 28.Suman V., Sarkar P.K. Neutron spectrum unfolding using genetic algorithm in a Monte Carlo simulation. Nucl. Inst. Methods Phys. Res. A. 2014;737:76–86. doi: 10.1016/j.nima.2013.11.012. [DOI] [Google Scholar]
- 29.Bettelli M., Benassi G., Nasi L., Zambelli N., Zappettini A., Gombia E., Abbene L., Principato F., Calestani D. Mechanically stable metal layers for ohmic and blocking contacts on CdZnTe detectors by electroless deposition; Proceedings of the 2015 IEEE Nuclear Science Symposium and Medical Imaging Conference (NSS/MIC); San Diego, CA, USA. 31 October–7 November 2015; pp. 1–3. [DOI] [Google Scholar]
- 30.Benassi G., Nasi L., Bettelli M., Zambelli N., Calestani D., Zappettini A. Strong mechanical adhesion of gold electroless contacts on CdZnTe deposited by alcoholic solutions. J. Instrum. 2017;12 doi: 10.1088/1748-0221/12/02/P02018. [DOI] [Google Scholar]
- 31.Bettelli M., Sarzi Amadè N., Calestani D., Garavelli B., Pozzi P., Macera D., Zanotti L., Gonano C.A., Veale M.C., Zappettini A. A first principle method to simulate the spectral response of CdZnTe-based X- and gamma-ray detectors. Nucl. Instrum. Methods Phys. Res. Sect. Accel. Spectrom. Detect. Assoc. Equip. 2020;960:163663. doi: 10.1016/j.nima.2020.163663. [DOI] [Google Scholar]
- 32.Bé M.M., Chisté V., Dulieu C., Kellett M., Mougeot X., Arinc A., Chechev V., Kuzmenko N., Kibédi T., Luca A., et al. Table of Radionuclides. Volume 8 Bureau International des Poids et Mesures; Pavillon de Breteuil, France: 2016. Monographie BIPM-5. [Google Scholar]
- 33.Lépy M., Plagnard J., Ferreux L. Measurement of 241Am L X-ray emission probabilities. Appl. Radiat. Isot. 2008;66:715–721. doi: 10.1016/j.apradiso.2008.02.078. [DOI] [PubMed] [Google Scholar]


