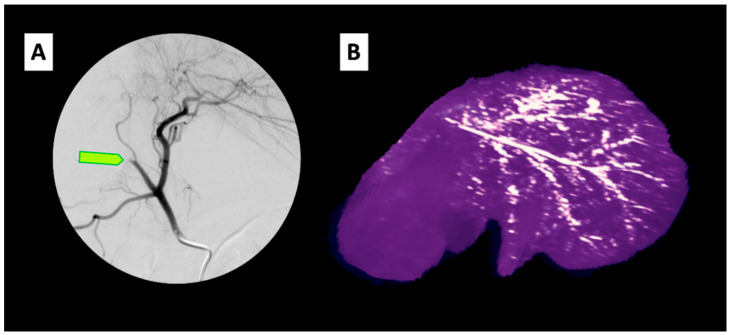
Figure 4.
In vivo imaging of thermoembolization in vivo in a pig model. (A) Digitally subtracted angiogram following contrast injection through catheter in the common hepatic artery in a pig. Light green arrow indicates abrupt cessation of the flow in the vessel treated using a microcatheter in the target vessel. (B) Reconstructed CT image of the liver from the pig obtained the following day showing the branching distribution of the ethiodized oil embolic solution in the arterial tree.

